Abstract
In vitro–in vivo correlation (IVIVC) is a biopharmaceutical tool recommended to be used in development of formulation. When validated, it can speed up development of formulation, be used to fix dissolution limits and also as surrogate of in vivo study. However, as do all tools, it presents limitations and traps. The aim of the present paper is to investigate five common traps which could limit either the setting or use of IVIVC (1) using mean or individual values; (2) correction of absolute bioavailability; (3) correction of lag time and time scaling; (4) flip-flop model; and (5) predictability corrections.
KEY WORDS: biowaiver, in vitro–in vivo correlation (IVIVC), predictability, prediction, time scaling
INTRODUCTION
Time is an important factor in successful drug development and all strategies to shorten development duration while supporting safety and overall quality of the product are encouraged. One tool that can be used in this race against the clock is in vitro–in vivo correlation (IVIVC) and its establishment, when possible, is recommended by authorities (1–12). An acceptable IVIVC requires that the in vitro dissolution and in vivo release or dissolution behavior of a dosage form should be either similar or have a scalable relationship to each other. IVIVC could only be established when the factor controlling the appearance of the drug in the blood flow is linked with the formulation (for example: slow release (SR) formulation for class I drug) or the characteristics of the active pharmaceutical ingredient (API; for example slow dissolution of API (Class II drug) presented as an immediate release (IR) formulation in vivo) and not with any physiological limiting factor (for example rate limited permeation). In practice, the formulations with a release from the drug dosage form slower than the dissolution of the API and a high permeability (SR formulations of class I and II) are the best candidates as everything depends of the formulation. In IVIVC, the pharmacokinetic (PK) absorption or in vivo release parameters are related to the in vitro dissolution which reflects a global performance of the drug product. A difference in dissolution could reflect, as expected in IVIVC, either a difference in release from the drug dosage form based on known characteristics (e.g., polymer grade or quantity for an extended release formulation), a difference in API characteristics or a difference in the manufacturing process, which is of great interest for the identification of the critical quality attribute.
When correlation is established and validated, prediction of in vivo profile can be done based on in vitro dissolution profile. Those predictions can be used in a wide range of applications such as to be a surrogate of in vivo study for formulation variation and also, for example, to validate scale up with a factor more than 10, to justify widening of dissolution limits, to validate production transfers, to modify the manufacturing process (2,6,8–10) as the predictions allow to guaranty the in vivo performance and the bioavailability or bioequivalence of the formulations.
However making accurate prediction of in vivo performance based on in vitro dissolution is not a straightforward process and many traps could involuntarily bias the predictions. The quality of the predictions depends on the tools, hypothesis and shortcuts used to establish them.
The aim of the present paper is to investigate common traps which could limit either the setting or use of IVIVC. Five common traps will be investigated in detail: (1) using mean or individual values; (2) correction of absolute bioavailability; (3) correction of lag time and time scaling; (4) presence of a flip-flop model; and (5) predictability corrections.
USE OF MEAN OR INDIVIDUAL CURVES
This point has been extensively described (13–17). Averaging the full set of data means that the dataset is restricted to a limited number of points implying a loss of information. However, is this loss the key factor of failure of IVIVC? To answer this question, the distinction between the averaging of in vitro data and of in vivo data as well as their implications must be investigated.
In Vitro
Averaging in vitro data for analysis is a common practice used in tests such as the f1 and f2 tests (8). Such averaging may not really be a serious problem for the following reasons:
The analysis of each formulation before its intake by subjects could not be done and thus its content could not be adjusted for further analysis.
The uniformity of content is usually fulfilled and the difference vs. the theoretical value quite low and in a BE study, the drug content of the test product cannot differ from that of the reference listed product by more than 5 % (6). If that is not the case a correction could be applied (see CORRECTION OF BIOAVAILABILITY) but only if batch is homogeneous.
In clinical practice, the dose mentioned on the label is the only one that is going to be used by the prescribing physician who does not adjust his prescription to the real content; and rely on the strength indicated on the label
The dissolution is a reproducible technique with a controllable environment (pH, temperature, medium composition, etc.) leading to tight results and low variability. Highly variable dissolution denotes non homogeneous production or non-robust formulation that may be associated in vivo with a large inter individual variability. However, if that is not the case, then dissolution is not the key factor contributing to in vivo variability.
In Vivo
The question of averaging is here more interesting and a pragmatic approach must be taken. Many points must be answered to make the right decision. Is the variability mainly within or between the subjects? In the first case, large intra subject variability, IVIVC cannot necessarily detect the difference between two different formulations and the inherent subject variability. In other words, two different profiles could be due to either the large intra subject variability or to the difference in formulations. This means that IVIVCs are discouraged for highly variable drugs as study power and predictability are low.
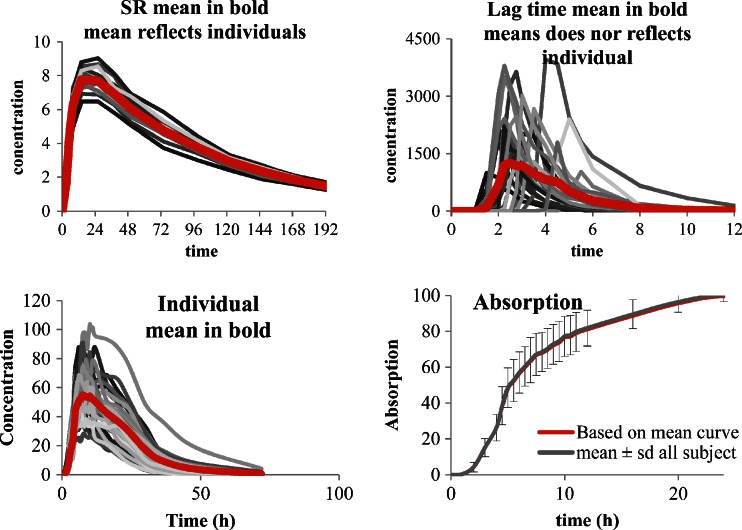
The second case, with usual or low intra subject variability, is more interesting. Here, the first question is to see if the mean curve reflects the individual behaviors or not. A simple pragmatic approach is to study two main parameters which are lag time (Tlag) and time to maximum concentration (Tmax) and to a less extent the time of last non-zero value or the terminal half-life. Of course when lag time exists and difference between subjects is significant (Tmax very different) the mean curve does not reflect the individual behavior (see Fig. 1 top right) and IVIVC is not recommended (as for some enteric-coated (EC) formulation for example). In such a case, the in vivo behavior of the formulation does not depend only on the release from the formulations but is influenced mainly by physiology (gastric emptying for example; Fig. 1 top). If the Tlag and Tmax of all subjects and of the mean curves are close together, the use of a mean curve will not modify dramatically the results, the only problem is the loss of information such as variability (that will be discussed later).
Fig. 1.
The top shows mean of curves without and with lag time, the bottom shows plasma concentration curves and related absorption (data from (18) individual and mean curves)
Let us now see two calculations based on data from Hemmingsen et al. (18) fulfilling the previous requisites. In the first approach the absorption curve is established on the mean plasma profile of a SR formulation by deconvolution vs. the mean plasma profile of the IR formulation as response function according to the numerical deconvolution method using Phoenix™ Win nonlin® (Pharsight Certara corporation).
As described in Ref. (18), the deconvolution technique was applied independently of any modelization of the absorption. Deconvolution allows isolating the input (absorption) function by a numerical algorithm as a function of the observed concentration for the studied tablet and for the IR reference tablet. In the current case, this input function reflected the in vivo release observed after administration of the SR test tablets. The simulations of the curves from the theoretic input were performed using convolution. On the second approach, individual deconvolutions were performed using the same technique and the mean of all absorption curves was calculated as recommended by some agencies. The results of individual deconvolution and of mean curves are presented in Fig. 1 (bottom).
In the example presented, the results of both techniques are similar. The frequent request from some authorities to perform individual deconvolution and then to average the results is not different in the presented case from performing directly the deconvolution on the mean of the plasma concentration curve. The more interesting point is to know whether it is better to perform IVIVC on an individual basis or on any type of averaged vales.
In case of individual IVIVC, two major points must be taken into consideration. First, is the IVIVC established on a common base for all subjects or on individual equations (see also time scaling and prediction sections later for this point)? Performing IVIVC with an individual adjustment of the equation means that the IVIVC is based on each individual’s specificity of the initial data set and cannot be extrapolated to other set of subjects. This is in contradiction with the universality of the prediction insuring the role of the in vivo surrogate of IVIVC. Second, which type of averaging is used? Many functions could be used to calculate a mean value: arithmetic, geometric, harmonic, quadratic, etc. Generally, most scientists take the simplest and most self-explanatory route which is the arithmetic mean. This seems like an obvious approach for most scientists, and is a common way for calculating mean plasma concentrations curves. However, some simple points must be addressed. Usually, the calculation of PK parameters to assess bioavailability are based on log-transformed parameters and after calculating the 90 % confidence interval (90 % CI), the results are back-transformed using exponential function. Doing such a transformation implies, de facto, the calculation of geometric means which as a property decreases the weight of extreme values and increases the chance to have normally distributed parameters. Taking into account this mode of calculation means also that the reference values for the internal predictability must be calculated in accordance with taking the Cmax and AUC of the mean curve and not the mean of individuals (or even more complicated the LS means extracted from the general linear or mixed model), and using for that the right method of calculating geometric or arithmetic means.
In addition, if the IVIVC is established on all the absorbed drug sampling points obtained for all subjects (which will reinforce the power of the IVIVC) the coefficient of correlation (r), dependent on the number of values used, will decrease. This fact must always be kept in mind to assess the quality of a IVIVC and it is better to link the appreciation of the quality of the regression (IVIVC) with a p value than with a r value.
An alternative method using direct convolution techniques, Bayesian or neural network approaches are proposed (13–17,19–22) that allows the investigator to treat all the information in a single process using specific algorithms and software. This approach needs perfect comprehension of all the mechanisms of calculation underlined and of the covariates to be included in the programing part.
TIME SCALING AND LAG TIME CORRECTION
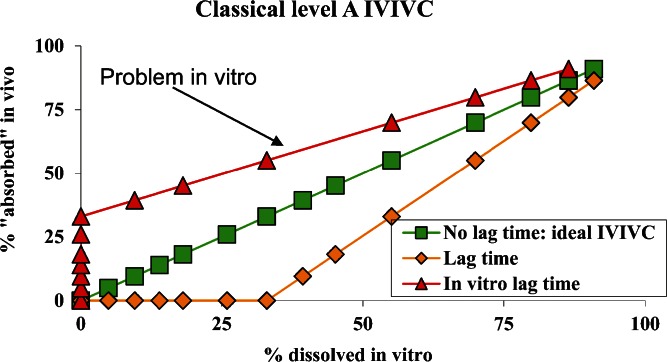
Time scaling and lag time correction are based on the same approach (2,5,7,11,23). Time scaling and lag time correction are needed if the in vitro and in vivo curves exhibit different rates and/or a difference in the starting of a phenomenon or a difference in lag time. For lag time, two basic cases exist (Fig. 2), and correspond either to an in vivo or in vitro lag time. The first curve (triangle in Fig. 2) corresponds to the situation in which absorption data in vivo is observed before the release of any drug is observed in the dissolution test in vitro. This case corresponds to an inadequate in vitro test which must be improved.
Fig. 2.
Lag time correction, different cases
The second case corresponds to dissolution data detecting drug release in vitro before any absorption data existed in vivo (diamond in Fig. 2). This case is more understandable, it could correspond either to a formulation characteristic (enterocoated formulation, delayed release or a SR formulation) or to physiology (delay in the gastric emptying). In the case of a delay linked with the formulation characteristic and not to physiology, and only if a certain homogeneity exists between the subjects, a lag time correction common to all subjects could be tried. That is not the case if the lag time is linked with a parameter which does not depend upon any process that is under control (such as formulation) but only from physiology (gastric emptying). In such a situation, lag time correction should not be encouraged as it is not reproducible.
When a lag time correction is done, all further simulation, including predictability, must be based on a similar correction even if it was modified by the formulator. Using such an approach is close to the spirit of the Japanese guideline on bioequivalence which allows, in certain case, a correction of in vitro lag time to compare formulations (24,25).
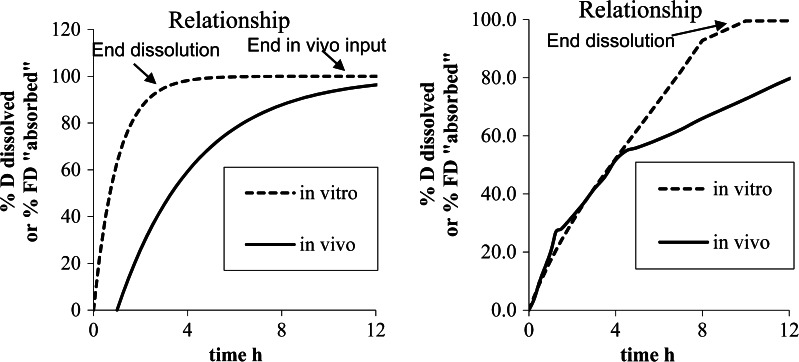
The time scaling is nothing more than an extension of the concept of correction of rate between in vivo and in vitro data (Fig. 3). As shown in Fig. 3, the correction could be of two natures (case 1 and case 2); however, in the two different cases, time scaling does not exhibit a similar meaning and strength.
Fig. 3.
Different rate between in vitro and in vivo data left case 1, right case 2
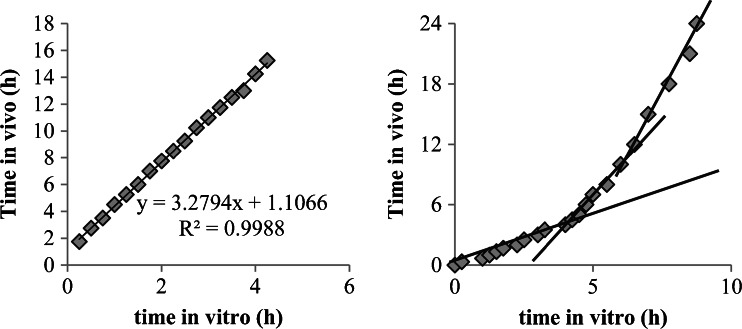
The common way to estimate the time scaling is to draw a Levy plot (2,5), which reports on the X-axis the time to have certain percentages of drug dissolved in vitro, and, on Y-axis the time to have similar percentages absorbed in vivo (Fig. 4). In the case of lag time, the intercept on the Y-axis gives the estimated lag time (Fig. 4, left; 1.1 h). If a similar process is observed between in vitro and in vivo data, the Levy plot will be a straight line (Fig. 4, left). If that is not the case (Fig. 4, right) ruptures in the Levy plot could be observed which denotes at which time the in vitro and in vivo processes diverged.
Fig. 4.
Levy plot for examples presented in Fig. 3 (right extracted from (18))
Some questions arise with Levy plots. Among them are key questions of how to interpolate the in vitro data and how to validate a time scaling. The interpolation of in vitro data is based on the existing in vitro dissolution and on functions to represent all observed values. The equations generally used are, for example, linear interpolations, Weibull, Hill, double Weibull, Makoid Banakar, Higushi, spline, polyexponetial, (26–28). The quality of the estimation depends on the number of sampling points used to generate the dissolution profile. The best and safer way is to program a large quantity of dissolution samples, which is simple when an on-line analysis can be programmed. In this case, the interpolation between two points is simple and the results of linear interpolation or more sophisticated methods bring overall similar results. In the opposite case, when only a few dissolution points exist, that often being the case for IVIVC established a posteriori (after the end of development), the equations lead often to over-parameterization of the profiles leading to inaccurate prediction. Over-parameterization starts when the number of parameters of the equation corresponds to number of sample minus one. As an example, if a double Weibull equation is used seven parameters must be established to fit the model to the data (weighting factor, amount released at infinity, two mean dissolution times, two slopes, and one intercept). If the dissolution dataset presented up to 8 dissolution points, then the fit could be perfect but the accuracy of parameters low and the predictability subjects to variation. The best equation to interpolate between two dissolution points is either the equation which reflect a known reality observed in vitro or the simpler one like a linear interpolation if the sampling points are close enough to avoid misestimation.
The Levy plots and time scaling are presented for the two previous examples in Fig. 4.
Obviously, in Fig. 4, the left graphic indicates a good linear relationship, denoting similar processes observed in vitro and in vivo, and thus validating de facto the in vitro dissolution method even if more rapid than in vivo. On the right side of Fig. 4, the graph of the relationship is not linear and two or three slopes can be observed. This nonlinear time scaling denotes that the processes explored in vivo and in vitro were not consistently similar, that is, the in vivo process was slower when time increased compared to in vitro. As described in (29), the presence of the formulation was monitored through the small intestine, ascendant and transverse colon, and descendent colon by scintigraphy. The rate of absorption was estimated to decrease gradually in each part of the intestine. This modeling of absorption could directly be linked to the observed plasma curves and the GI transit. The nonlinear time scaling could also be explained by where the tablet was in the GI tract and the resulting absorption rates (see (18,29) for more explanation). In this latter case, the time scaling is linked with observed physiology and is thus validated by observation.
Nonlinear time scaling must in all other cases be investigated and the reason for absence of consistency between vitro and vivo data determined.
FLIP-FLOP MODEL
Wagner Nelson is a mass equation which allows calculation of the absorption in the case of the one compartment model as stated in guidelines (7,8). This equation uses observed concentrations (C(t)), AUC and apparent elimination rate constant determined from the data (ke) as presented in Eq. 1.
 |
1 |
This equation exhibits a domain from 0 to 100 %. In some cases, when the Wagner Nelson equation is used, a flip-flop model could exist (30,31), especially in case of SR formulations where the absorption rate is much lower than the elimination rate. In this case, the terminal decreasing of the plasma concentration curve, which normally reflects the elimination rate (ke), becomes a reflection of actual absorption rate (ka), while the initial increasing part of the curve, which normally reflects the absorption rate (ka), is the actual representation of the elimination rate (ke). The equation is presented in Eq. 2 for normal model and Eq. 3 for flip-flop.
 |
2 |
 |
3 |
In the case of flip-flop kinetics, many parameters which influence BE studies and the IVIVC are modified:
A UC from 0 to infinity is overestimated and leads to an incorrect estimation of relative or absolute bioavailability
Absorption which is overestimated and faster than the real absorption leads to a bad IVIVC
This example is described in Fig. 5.
Fig. 5.
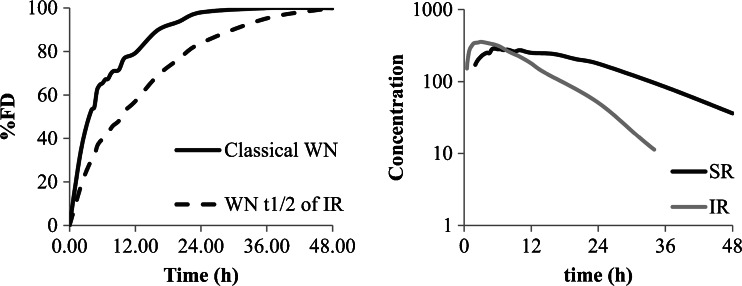
Wagner Nelson in case of flip-flop, on the right, difference in terminal half-life is clearly visible between IR and SR
In case of flip-flop, the IVIVC will not lead to a good estimate. Nonetheless, simple tricks exist to avoid such a problem. As an example, the accuracy of the terminal half-life extracted from the formulations under consideration must be compared to IR or IV data (observed or published). In addition, terminal half-life which is modified between formulations and increased when the formulation is designed to release longer is a good sign of a potential problem. In this case, Wagner Nelson could be used only if the ke estimated from IV or IR formulation is available.
CORRECTION OF BIOAVAILABILITY
During the development of new drugs and drug dosage forms one of the main concerns of the development team is the correct estimation of the bioavailability (absolute (F) or relative (f)).
The development team may want in some cases to improve this absolute bioavailability either by modifying the API itself (new salt, size of crystals, polymorphs, etc.) or by improving the formulation (usage of specific excipients, creation of the controlled released formulation, etc.). In addition, the absorption of the substance into the blood could be governed by either the solubility of the API itself, the release of the API from the drug dosage form, the permeability through the intestinal membrane, but also by the influence of efflux proteins such as pGp, and by first pass metabolism. The absolute bioavailability is a function of first pass intestinal effect, first pass membrane effect and first pass hepatic effect and can be estimated according to the following formula (Eq. 4):
 |
4 |
A change in one of the parameters related to intestinal, membrane or hepatic behavior of the drug dosage form or the drug itself or of the drug dosage form could change the absolute bioavailability.
The in vivo data are derived from the plasma concentration curve. After the calculations are performed, the input curve known as “absorption” curve is presented either as the percent of the fraction of dose (%FD) absorbed or the percent of dose (%D) vs. time. If the data are presented in %D both rate and extent as confused as the maximum of absorption corresponds to the fraction of the dose of the test formulation vs. the formulation used to perform the deconvolution (F in case of IV or f for per os solution or IR formulation). If the %FD is used, only the rate of absorption is calculated as all the formulations reach 100 % at the end, that being in particular the case with Wagner Nelson method (see above). In this last case, the value of F or f must be reintegrated in the convolution step to correct the final time concentration simulated profiles. This presentation in %FD allows differentiating between the rate of absorption and the extent of absorption (F or f).
This absorption curve, which is the input curve of the drug in the body, depends on the dosage form and the properties of the active pharmaceutical ingredient, and thereafter its pharmacokinetics input processes (first pass effect [FPE], location and type of absorption (32–35)). As in all chains of phenomena, the observation made at the end of the chain (blood concentrations) is determined by the slowest phenomenon in the whole chain. In practice, no modification of the bioavailability is allowed. This assumption is sensible when all mechanisms underlined by the release and the absorption are not dependent on the dose included in the formulation, its release rate or any physiological problems.
If by any modification technique the release or availability of the drug is increased, then the quantity that might be absorbed will be dependent on the formulation and not easily predicted. For this reason for biowaivers as well as for IVIVC (2,4,7,8,36–38), it is strongly recommended not to modify, between the formulation, the composition qualitatively and quantitatively in excipients which might influence the solubilisation and/or the permeation of the active ingredient. For per os formulation or implants, the problem could be similar. For example, for a drug which could release on a long period of time per os, the limiting factor is the duration of the transit.
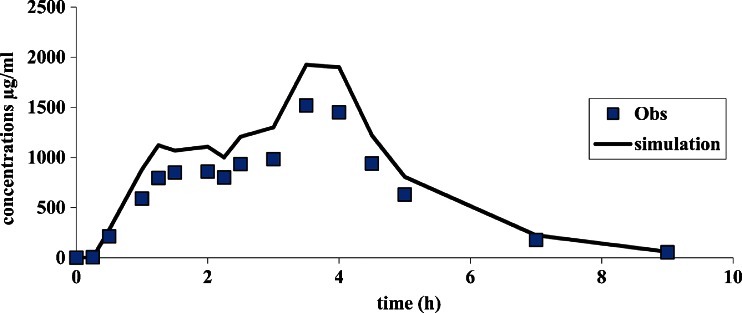
If the fraction of dose available for absorption is increased vs. the formulation used to establish the IVIVC, the simulated profile, calculated based on the in vitro release, could exhibit the proper shape but not magnitude (as the exact dose absorbed cannot be estimated (Fig. 6). In this case, the AUC as well as Cmax are overestimated by a similar magnitude
Fig. 6.
Curve simulation with an overestimation of the F
As the simulations performed with level A ICIVC can be used as a surrogate to in vivo data and replace a bioequivalence study, authorities do not allow a correction of the bioavailability in order to adjust the curves to the expected results. This position is comprehensible, as in this case, IVIVC does not exhibit a good predictability and thus cannot anticipate the bioavailability in vivo.
However, a simple question could be asked, could the uniformity of content (U of content of formulations, established according to the certificate of analysis) be taken into account? The answer is somehow presented in guideline (38) where it is specified if the U of content of the formulation differs by more than 5 % then a correction could be envisaged to correct the results of BE studied.
PREDICTABILITY AND CORRECTION OF THE REFERENCE
The last step before IVIVC can be used as biowaiver or as surrogate of any in vivo data is validation by predictability (2,4,5,7,8).
Predictability is the ability of the IVIVC to predict accurately the in vivo data. It could be based on internal (retro calculation of initial data) or external (new set of data) predictability. In this last case, the data could come from the same BE study or for a new one (Fig. 7).
Fig. 7.
Internal vs. external predictability
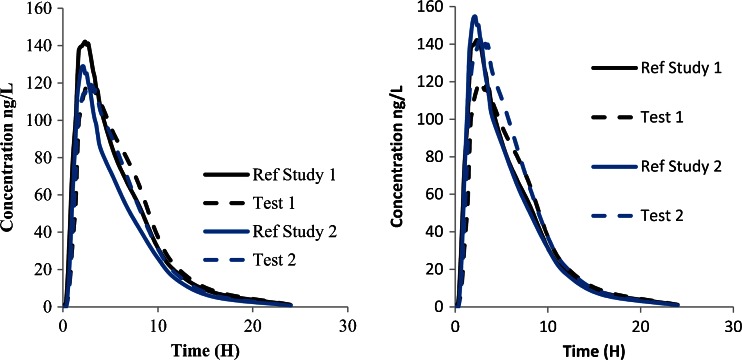
If a new study is used to validate the IVIVC or to confirm some calculations made with the IVIVC, it is rare that the same subjects participated to both studies. In this case, some differences could exist in the response due to any reason, varying from a more basic one (sex repartition, age, etc.…) to a more complicated one (dissimilar geno- or phenotyping). In this case, the response of the subjects to the drug could be different and challenge the IVIVC. Figure 8 presents some data from two studies.
Fig. 8.
Comparison of data between two studies. The curves to the left show initial data, the curves to right show corrected data
As shown in Fig. 8, it is obvious that the two test formulations are superimposable leading to a conclusion that they are equal. A more clever analysis will bring additional information. The reference formulation could be estimated to have a constant quality compared to the new tested formulation. Assuming this point, the two curves corresponding to the reference must exhibit similar patterns and magnitude. If that is not the case, it means that the subjects or patients did react on the same way to this formulation. It could be expected in this case that the test formulation must exhibit similar differences, and thus the new test formulation must be reevaluated taking into account this point. The more simple correction factor which could be used is the ratio of AUC between the two reference formulations (20 % in this case). This correction leads to the curves depicted on to the right in Fig. 8. After correction, the two reference curves are comparable in terms of AUC, although this is no longer the case for Cmax. This approach helps to compare data between studies and to take a better decision for the formulation but could not be used to support any surrogate application.
The prediction, as stated in the first part of this paper for establishing IVIVC, could be performed on the mean value or on an individual basis. Figure 9 presents the results of such a prediction.
Fig. 9.
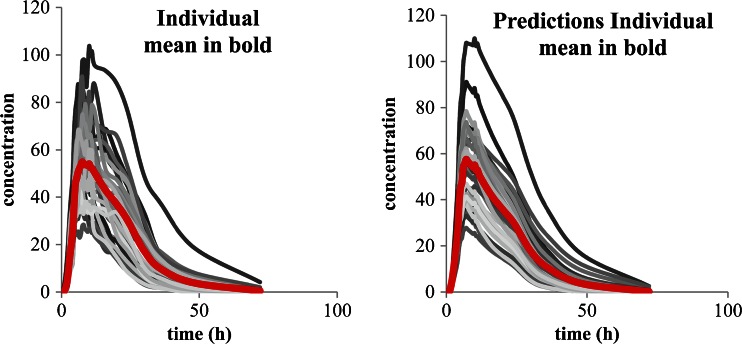
Prediction based on individual data compared to mean prediction. The curves to the left shows original individual data values whereas the curves to the right show predicted individual data values
For the prediction of the plasma concentration based on individual data values as the IVIVC is common for all subjects as well as the in vitro dissolution, the input function is similar for all subjects. That leads to an identical shape for all predicted curves even if their magnitude is different. The interest of such individual predictability is to avoid restricting the pool of data to a single set of data called a mean curve. This mean curve cannot estimate adequately the variability of response and underestimates the subject effect. As IVIVC is usually done when intra subject variability is lower than inter subject, this is not reflected by this individual predictability, which reflects only the inter subject one. In any case, the variability of the predicted set of data is equal to the variability of the initial one and thus could not estimate a specific action of the formulation on the variability of the subjects.
The next point to take into account for predictability is the data used to calculate the percentage of error. In case of use of mean curves (either plasma concentration or absorption), the simulated data refers to this mean curve. The Cmax and AUC of this mean curve is different from the mean of individual Cmax and AUC, so those parameters must be calculated in similar way in both cases to allow an accurate comparison. When parameters are calculated on a subject basis, the mean value could be different from the parameters presented in the results of the bioequivalence, as in this case the geometric LS means are often displayed. Attention must be paid to the way in which the means are calculated (see “USE OF MEAN OR INDIVIDUAL CURVES”) in order to compare comparable items. For example, based on results of Hemingsen at al (18) the Cmax observed on the mean curves is 60,400 ng/ml compared to the mean of individual Cmax of 63,900, 64,200, and 63,300 ng/ml for arithmetic, geometric, and LS means, respectively.
In this specific case the data used were considered as exhibiting no major differences between mean curves and mean of individuals (see Fig. 1 bottom).
CONCLUSION
The relationship between an in vitro property defined as example by a full dissolution curve and an in vivo response described for example by the full input (absorption) profile is defined as IVIVC. This relationship allows simulating, based on in vitro data, the in vivo behavior of the formulations or batches using the same release mechanism and no excipients which could influence physical–chemical properties of the API and its permeability. Those simulations imply some constraints. Knowledge of the limitations is mandatory to understand the possible errors and the robustness of the simulations performed afterwards. That is particularly important as those simulations could be used as a surrogate of an in vivo study.
ACKNOWLEDGEMENT
The authors thank Egalet (DK) for use of the data (Ref. 18) with permission by the authors.
Footnotes
Disclaimer
The views presented in this article are those of the author (Dr. Davit) and do not necessarily reflect those of the US Food and Drug Administration.
Contributor Information
J.-M. Cardot, Phone: +33-4-73177968, FAX: +33-4-73177959, Email: j-michel.cardot@u-clermont1.fr
B. M. Davit, Email: barbara.davit@fda.hhs.gov
REFERENCES
- 1.Cardot JM, Beyssac E. In vitro/in vivo correlations: scientific implications and standardisation. Eur J Drug Met Ph. 1993;18:113–120. doi: 10.1007/BF03220014. [DOI] [PubMed] [Google Scholar]
- 2.Cardot J-M, Beyssac E. In vitro/in vivo correlations in: James Swarbrick, James C. Boylan editors. Encyclopedia of Pharmaceutical Technology 3rd ed, Informa healthcare; 2006. vol 1 p.1062–1072.
- 3.Devane J. The impact of in vitro–in vivo relationships on product development. Adv Exp Med Biol. 1997;423:241–260. doi: 10.1007/978-1-4684-6036-0_23. [DOI] [PubMed] [Google Scholar]
- 4.EMA Note for guidance on quality of modified release products: A: Oral Dosage Forms B: Transdermal Dosage Forms, 2000; CPMP/QWP/604/96.
- 5.Emami J. In vitro–in vivo correlation: from theory to applications. J Pharm Pharmaceut Sci. 2006;9:169–189. [PubMed] [Google Scholar]
- 6.FDA Guidance for Industry Bioavailability and Bioequivalence Studies for Orally Administered Drug Products—General Considerations U.S. Department of Health and Human Services Food and Drug Administration Center for Drug Evaluation and Research (CDER) March 2003.
- 7.FDA Guidance for Industry Extended Release Oral Dosage Forms: Development, Evaluation, and Application of In Vitro/In vivo Correlations U.S. Department of Health and Human Services Food and Drug Administration Center for Drug Evaluation and Research (CDER) September 1997.
- 8.FDA Guidance for Industry Nonsterile Semisolid Dosage Forms Scale-Up and Postapproval Changes: Chemistry, Manufacturing, and Controls; In vitro Release Testing and In vivo Bioequivalence Documentation U.S. Department of Health and Human Services Food and Drug Administration Center for Drug Evaluation and Research (CDER) May 1997.
- 9.Farrell C, Hayes S. IVIVC for oral drug delivery: immediate release and extended release dosage forms in pharmaceutical product development. In: Chilukuri DM, Sunkara G, Young D, editors. In vitro–in vivo correlation. New York: Marcel Dekker; 2007. pp. 125–140. [Google Scholar]
- 10.ICH Steering Committee, Draft consensus guideline on development Q8 step 4, August 2009.
- 11.Leeson LJ. In vitro/in vivo correlations. Drug Inf J. 1995;29:903–915. doi: 10.1177/009286159502900312. [DOI] [Google Scholar]
- 12.Mauger DT, Chinchilli VM. In vitro–in vivo relationships for oral extended-release drug products. J Biopharm Stat. 1997;7:565–578. doi: 10.1080/10543409708835207. [DOI] [PubMed] [Google Scholar]
- 13.Bigora S, Piscitelli D, Dowell J, Butler J, Farrell C, Devane J, et al. Use of nonlinear mixed effects modelling in the development of in vitro–in vivo correlations. Adv Exp Med Biol. 1997;423:207–215. doi: 10.1007/978-1-4684-6036-0_19. [DOI] [PubMed] [Google Scholar]
- 14.Dunne A, Gaynor C, Davis J. Deconvolution based approach for level A in vivo–in vitro correlation modeling: statistical considerations. Clin Res Reg Aff. 2005;22:1–14. [Google Scholar]
- 15.Dunne A, O’Hara T, Devane J. Approaches to IVIVR modelling and statistical analysis. Adv Exp Med Biol. 1997;423:67–86. doi: 10.1007/978-1-4684-6036-0_6. [DOI] [PubMed] [Google Scholar]
- 16.Gaynor C, Dunne A, Davis J. A comparison of the prediction accuracy of two IVIVC modelling techniques. J Pharm Sci. 2008;97:3422–3432. doi: 10.1002/jps.21220. [DOI] [PubMed] [Google Scholar]
- 17.O’Hara T, Hayes S, Davis J, Devane J, Smart T, Dunne A. In vivo–in vitro (IVIVC) modeling incorporating a convolution step. J Pharmacokinet Phar. 2001;28:277–298. doi: 10.1023/A:1011531226478. [DOI] [PubMed] [Google Scholar]
- 18.Hemmingsen P, Haahr A-M, Gunnergaard C, Cardot J-M. Development of a new type of prolonged release hydrocodone formulation based on Egalet® ADPREM technology using in vivo in vitro correlation. Pharmaceutics. 2011;3:73–87. doi: 10.3390/pharmaceutics3010073. [DOI] [PMC free article] [PubMed] [Google Scholar]
- 19.Buchwald P. Direct, differential-equation-based in-vitro–in-vivo correlation (IVIVC) method. J Pharm Pharmacol. 2003;55:495–504. doi: 10.1211/002235702847. [DOI] [PubMed] [Google Scholar]
- 20.Dowell JA, Hussain A, Devane J, Young D. Artificial neural networks applied to the in vitro–in vivo correlation of an extended-release formulation: initial trials and experience. J Pharm Sci. 1999;88:154–160. doi: 10.1021/js970148p. [DOI] [PubMed] [Google Scholar]
- 21.Gillespie WR. Convolution-based approaches for in vitro–in vivo correlation modeling. In: Young D, Devane J, Butler J, editors. Advances in experimental medicine and biology, in vitro–in vivo correlations. New York: Plenum; 1997. pp. 53–65. [DOI] [PubMed] [Google Scholar]
- 22.Kortejarvi H, Malkki J, Marvola M, Yliperttula M, Pajunen P. Level A in vitro–in vivo correlation (IVIVC) model with Bayesian approach to formulation series. J Pharm Sci. 2006;95:1595–1605. doi: 10.1002/jps.20592. [DOI] [PubMed] [Google Scholar]
- 23.Rackley RJ. Examples of in vitro–in vivo relationships with a diverse range of quality. In: Young D, Devane J, Butler J, editors. Advances in experimental medicine and biology, in vitro–in vivo correlations. New York: Plenum; 1997. pp. 1–16. [DOI] [PubMed] [Google Scholar]
- 24.NIHS (National Institute of Health Sciences Japan) Guideline for Bioequivalence Studies of Generic Products, December, 2006.
- 25.NIHS (National Institute of Health Sciences Japan) Guideline for Bioequivalence Studies for Formulation Changes of Oral Solid Dosage Forms December, 2006.
- 26.Banakar UV, Makoid MC. Drug dissolution and bioavailability. Lancaster, PA: Technomic; 1994. [Google Scholar]
- 27.Cardot J-M, Beyssac E, Alric M. In vitro–in vivo correlation Importance of dissolution in IVIVC. Dis Tech. 2007;14:15–19. [Google Scholar]
- 28.Rohrs BR, Skoug JW and Halstead GW. Dissolution assay development for in vitro-in vivo correlations: theory and case studies. Young D., Devane J., Butler J. editors. Advances in Experimental Medicine and Biology, In vitro–in vivo Correlations, Plenum, New York 1997;423:17–30. [DOI] [PubMed]
- 29.Marvola J, Kanerva H, Slot L, Lipponen M, Kekki T, Hietanen H, et al. Neutron activation-based gamma scintigraphy in pharmacoscintigraphic evaluation of an Egalet® constant-release drug delivery system. Int J Pharm. 2004;281:3–10. doi: 10.1016/j.ijpharm.2004.05.022. [DOI] [PubMed] [Google Scholar]
- 30.Gibaldi M, Prescott L. Handbook of clinical pharmacokinetics. New York: ADIS; 1983. [Google Scholar]
- 31.Wagner JG, Nelson E. Percent absorbed time plots derived from blood level and/or urinary excretion data. J Pharm Sci. 1963;52:610–611. doi: 10.1002/jps.2600520629. [DOI] [PubMed] [Google Scholar]
- 32.Lennernas H. Human intestinal permeability. J Pharm Sci. 1997;87:403–410. doi: 10.1021/js970332a. [DOI] [PubMed] [Google Scholar]
- 33.Martinez MN, Amidon GL. A mechanistic approach to understanding the factors affecting drug absorption: a review of fundamentals. J Clin Pharmacol. 2002;42:620–643. doi: 10.1177/00970002042006005. [DOI] [PubMed] [Google Scholar]
- 34.Yu LX, Amidon GL. A compartmental absorption and transit model for estimating oral drug absorption. Int J Pharm. 1999;186:119–125. doi: 10.1016/S0378-5173(99)00147-7. [DOI] [PubMed] [Google Scholar]
- 35.Yu LX. An integrated model for determining causes of poor oral drug absorption. Pharm Res. 1999;16:1883–1887. doi: 10.1023/A:1018911728161. [DOI] [PubMed] [Google Scholar]
- 36.FDA Guidance for Industry : Waiver of In vivo Bioavailability and Bioequivalence Studies for Immediate-Release Solid Oral Dosage Forms Based on a Biopharmaceutics Classification System U.S. Department of Health and Human Services Food and Drug Administration Center for Drug Evaluation and Research (CDER) August 2000.
- 37.Lobenberg R, Amidon GL. Modern bioavailability and biopharmaceutics classification system. New scientific approaches to international regulatory standards. Eur J Pharm Biopharm. 2000;50:3–12. doi: 10.1016/S0939-6411(00)00091-6. [DOI] [PubMed] [Google Scholar]
- 38.EMA, Guideline on the investigation of bioequivalence, CPMP/QWP/EWP/1401/98 Rev. 1, January 2010.


