Abstract
When influenza vaccines are in short supply, allocating vaccines equitably among different jurisdictions can be challenging. But justice is not the only reason to ensure that poorer counties have the same access to influenza vaccines as do wealthier ones. Using a detailed computer simulation model of the Washington, D.C., metropolitan region, we found that limiting or delaying vaccination of residents of poorer counties could raise the total number of influenza infections and the number of new infections per day at the peak of an epidemic throughout the region—even in the wealthier counties that had received more timely and abundant vaccine access. Among other underlying reasons, poorer counties tend to have high-density populations and more children and other higher-risk people per household, resulting in more interactions and both increased transmission of influenza and greater risk for worse influenza outcomes. Thus, policy makers across the country, in poor and wealthy areas alike, have an incentive to ensure that poorer residents have equal access to vaccines.
Vaccine shortages during epidemics or pandemics involving novel pathogens, such as H1N1 (swine influenza) in 2009, may be the rule rather than the exception. There is usually little time to develop, test, approve, and manufacture a vaccine. Despite swift decision making by public health officials in spring 2009, the first H1N1 vaccines were not available until October, close to the pandemic’s peak. This timing represented an improvement over past influenza pandemics, like those of 19571 and 1968.2 But unless technological advances can speed up the development of new vaccines, shortages are likely to recur.
When vaccines are in short supply, distributing them quickly and equitably among populations and localities can be a difficult challenge. During the H1N1 pandemic, the Department of Health and Human Services allocated available vaccines to each state and territory by population size and shipped vaccines directly to locations designated by each jurisdiction.3 By October 14, 2009, of 11,422,900 allocated 2009 H1N1 influenza vaccine doses, only 5,885,900 doses had been shipped. California had received 836,900 doses, the highest of any jurisdiction, while American Samoa and the Marshall Islands had not received any doses. Each jurisdiction, in turn, decided which of its residents would get vaccines first. However, even with the best intentions, inadequate infrastructure, geographical or socioeconomic barriers, or cultural differences can lead to inequitable access to vaccines.
The distribution of vaccination locations and personnel might not be equal across counties.4 Although official planners may seek to allocate vaccines by risk status, economic and operational challenges—such as unequal access to health care facilities or resources—may prevent this careful distribution. For instance, during the 2009 H1N1 pandemic, Los Angeles reported unequal vaccine distribution, with relatively less vaccine available in areas with higher percentages of uninsured and low-income residents. South Los Angeles County received one dose per five people, while West Los Angeles County, which includes Malibu, Santa Monica, and Beverly Hills, received one dose per two people.5
Moreover, geographic proximity to vaccination locations does not necessarily guarantee access to vaccines. Some people may be unable to receive a vaccination because they lack insurance; because their insurance restricts where they can get preventive care; or because they cannot afford to miss work to be vaccinated. Still others may lack sufficient health literacy to realize that they should get a vaccine.4,6,7 Moreover, many poor people cross county lines to go to work and school, making it harder for them to get to vaccination centers in their own county.7,8 If vaccines are allocated based on the number of county residents, nonresidents might not be able to receive vaccines.
Studies have shown that poorer people may have less access to medical care, including vaccination, than wealthier people.4,9–13 Even in a population with equal access to overall care, there may be racial disparities in who receives antiviral treatment.14 A national survey found racial and ethnic disparities in H1N1 exposure risk (including differences in dependence on public transportation and in the ability to work at home if necessary), susceptibility to severe diseases (including higher rates of self-reported chronic conditions and immunosupression), and health care access.15
Naturally, justice argues for equitable distribution among poor and rich residents alike. But in addition, could equity help reduce an epidemic’s severity—for example, by ensuring that wealthy counties do not receive more than their fair share of vaccines?16 Many low-income neighborhoods have fairly high population densities, which means that many people interact closely with each other and that contagious diseases can spread quickly.7,8,17 Important questions remain: What are the potential effects of unequal access to vaccines among poor counties? Does society have an interest in ensuring that the vaccine distribution strategy treats these populations equitably?
We explored the effects of differential vaccination by socioeconomic status using a detailed computer simulation model of the Washington, D.C., metropolitan region. Our team developed the model during work with the Office of the Assistant Secretary for Preparedness and Response at the Department of Health and Human Services during the 2009 H1N1 pandemic. We examined how the course of the pandemic might have been affected by vaccinating residents of counties with the highest and lowest median household incomes at different rates and times.
Study Data And Methods
A previously published study provides details on our regional model, which encompassed the following census metropolitan statistical areas: Baltimore-Towson, Maryland; Washington-Arlington-Alexandria, District of Columbia-Virginia-Maryland-Virginia; Winchester, Virginia-West Virginia; Lexington Park, Maryland; and Culpeper, Virginia.18
The model contained 7,414,562 virtual “people.” We used information from the US census to give each of them sets of daily behaviors and assigned characteristics, including age, sex, occupation, household location, household membership, employment status, school assignment for students and teachers, workplace assignment for employed adults, disease status, and influenza-risk status based on these characteristics.19,20
Each simulation “day,” virtual people moved throughout the region in patterns similar to those actually observed in real life, interacting with each other at places such as offices and schools, based on the day of the week and each person’s characteristics.19,21 Exhibit 1 shows the highest- and lowest-income counties’ demographics and the number of influenza vaccine doses allocated to each county for each scenario (see Appendix Exhibit 1 for more detailed information about all of the counties).22
Exhibit 1.
Distribution of Influenza Vaccine Doses To Counties With The Highest And Lowest Incomes, According To Different Scenarios, Washington, D.C., Metropolitan Area
| Three highest-income counties
|
Three lowest-income counties
|
|||||
|---|---|---|---|---|---|---|
| Fairfax | Montgomery | Loudoun | Prince George’s | District of Columbia | Baltimore City | |
| Median household income | $100,348 | $94,184 | $91,765 | $64,064 | $64,026 | $41,039 |
| Population | 963,657 | 866,993 | 169,170 | 783,396 | 538,237 | 623,878 |
|
| ||||||
| Percent below federal poverty level | 5.6% | 6.7% | 3.4% | 7.8% | 17.6% | 20.9% |
| Number of high-risk residents | 241,343 | 225,415 | 38,620 | 175,134 | 131,293 | 153,676 |
|
| ||||||
| Number of doses if 200,000 doses allocated equally | 25,666 | 22,499 | 4,900 | 22,936 | 13,408 | 17,693 |
| Number of doses if 400,000 doses allocated equally | 51,066 | 44,967 | 9,679 | 45,773 | 26,789 | 35,133 |
| Number of doses if 700,000 doses allocated equally | 89,429 | 78,752 | 16,947 | 80,299 | 46,672 | 61,564 |
|
| ||||||
| Number of doses in scenario A | 200,000 | 0 | 0 | 0 | 0 | 0 |
| Number of doses in scenario B | 211,164 | 188,836 | 0 | 0 | 0 | 0 |
| Number of doses in scenario C | 337,415 | 302,395 | 60,190 | 0 | 0 | 0 |
|
| ||||||
| Number of doses in scenario D | 0 | 0 | 0 | 0 | 0 | 200,000 |
| Number of doses in scenario E | 0 | 0 | 0 | 0 | 182,345 | 217,655 |
| Number of doses in scenario F | 0 | 0 | 0 | 285,305 | 189,266 | 225,429 |
SOURCES Authors’ analyses. Census Bureau. Public-Use Microdata Samples (PUMS) [Internet]. Washington (DC): Census Bureau; [last updated 2010 Aug 2; cited 2011 Apr 26]. Available from: http://www.census.gov/main/www/pums.html. NOTES Number of high-risk residents is number of people at high risk of influenza. Scenario A is 200,000 doses, all to the highest-income county. Scenario B is 400,000 doses, all to the two highest-income counties. Scenario C is 700,000 doses, all to the three highest-income counties. Scenario D is 200,000 doses, all to the lowest-income county. Scenario E is 400,000 doses, all to the two lowest-income counties. Scenario F is 700,000 doses, all to the three lowest-income counties. For information on the rest of the counties, see Appendix Exhibit 1 (Note 22 in text).
DISEASE PARAMETERS
Previous publications have described the underlying characteristics of our influenza model used in this study’s analyses.18,23–29 (See Appendix Exhibit 2 for contact frequency and influenza transmission probabilities among different types of people.)22 At any given time, each person is in one of four exclusive disease states: susceptible, exposed, infectious, or recovered. If a second person comes into contact with an infectious person, the second one moves from the susceptible to the exposed state.25,30 A newly infected person remains in the exposed state during the disease’s incubation period and then moves to the infectious state, where he or she could infect others.
Only about half of infectious patients manifest symptoms. Half of those people stay home from school or work, and 40 percent of that group visits a clinic or emergency department. A person remains infectious for a maximum of seven days before transitioning into the recovered state, in which he or she is immune to subsequent infections from this particular type of influenza. If a susceptible person is vaccinated, he or she has an 80 percent chance of moving to the recovered state—without becoming exposed or infectious—two weeks later.31
VACCINE SCENARIOS
Our experiments explored a variety of scenarios based on various factors, such as limited availability of vaccines. We created three scenarios in this category, as follows: one in which only 200,000 total doses were available, and just one of the counties under consideration received doses; another in which 400,000 doses were available, and two counties received them; and another in which 700,000 doses were available and were distributed to three counties.
In each of these scenarios, we modeled what would happen if the same number of vaccines went to the three highest-income or the three lowest-income counties in the Washington, D.C., region. Within each county, vaccine distribution followed the standard recommendations for the 2009–10 influenza season, with people younger than twenty-four receiving the vaccine first.32
Next, we considered delayed availability of vaccines, which could be caused by either delays in administering the vaccine or impaired access to health care for people who otherwise would have been vaccinated. In this case, we created scenarios in which the same number of doses were available in the three lowest-income counties ten, twenty, or thirty days after doses were available elsewhere.
MODEL OUTCOMES
Each simulation generated daily measurements of new influenza infections, total current infections, absenteeism, clinic or emergency department visits, hospitalizations, and deaths.We used the following assumption to translate these data into productivity losses, or costs from the societal perspective: Influenza with symptoms caused the patient to miss 3.2 days (range: 1.5–4.9 days) of school or work.33 The Bureau of Labor Statistics databases provided salary and income data.34 Life expectancies came from the Human Mortality Database.35 We used a 3 percent discount rate to adjust costs to 2009 values. Clinic visits and hospitalizations were estimated according to the patients’ ages.35–37
SENSITIVITY ANALYSES
Sensitivity analyses systematically varied the start of the vaccination program (at zero, four, or eight weeks before the epidemic’s peak), vaccine administration rate (taking 30, 90, or 180 days to complete the immunization program, given a constant vaccination rate), the percentage of populations in counties who received the vaccine (30 percent and 50 percent of the population), symptomatic rate (50–67 percent of the population with symptoms of influenza), and probability of symptomatic individuals’ visiting a clinic or emergency department (20–40 percent).38,39
LIMITATIONS
All computer models simplify reality; none of them can account for every possible factor. Instead of making decisions themselves, models provide information to decision makers about possible scenarios and relationships. The course of an actual epidemic might not necessarily conform to our model’s data and assumptions. For example, delivering doses of vaccine to counties does not guarantee that all residents will accept being vaccinated. Our model did not vary vaccine acceptance by race or ethnicity. Our analyses used a standard point for the peak of the modeled epidemic peak, although in reality the peak is unknown until an epidemic has concluded.
Study Results
Each scenario’s set of results were averages of twenty simulations that produced an epidemic after introducing 100 randomly infected people into the population. Our baseline epidemic involved no vaccination and a reproductive rate for the influenza of 1.7—that is, the average infectious person infected 1.7 other people—and lasted approximately 144 days. There were 106,429 new infections per day at the epidemic’s peak (day 48), and 2,825,888 infections overall, which amounted to 38 percent of the total population of the region. All presented results are statistically significant.
LIMITED VACCINE AVAILABILITY
The fewest total infections and daily new infections at the epidemic’s peak resulted when we allocated the vaccines to the poorest counties. When we allocated the vaccines to the wealthiest counties, there were more total infections and daily new infections at the epidemic’s peak. In other words, when vaccines went just to the wealthiest counties, not only did more people become infected throughout the epidemic’s course, but more people also were ill at its peak, potentially straining the capacities of public health and health care systems (Exhibit 2).
Exhibit 2.
Percentage Of Population Infected With H1N1 Throughout The Epidemic And Number Of New Infections Per Day At The Epidemic’s Peak, For Each Scenario
| Allocation of vaccines | Vaccine administration rate
|
|||||
|---|---|---|---|---|---|---|
| 30 days
|
90 days
|
180 days
|
||||
| Population infected (%) | Peak daily new infections | Population infected (%) | Peak daily new infections | Population infected (%) | Peak daily new infections | |
|
200,000 doses administered
| ||||||
| Baseline | 35.26 | 90,670 | 35.25 | 91,268 | 35.33 | 92,481 |
| Lowest-income county | 34.60 | 87,024 | 34.64 | 86,741 | 34.61 | 86,981 |
| Highest-income county | 35.23 | 90,893 | 35.30 | 91,205 | 35.27 | 91,395 |
|
| ||||||
|
400,000 doses administered
| ||||||
| Baseline | 33.02 | 83,552 | 33.02 | 82,879 | 33.01 | 82,175 |
| Two lowest-income counties | 31.32 | 75,981 | 31.29 | 75,910 | 31.35 | 75,030 |
| Two highest-income counties | 32.81 | 82,412 | 32.77 | 83,288 | 32.76 | 82,656 |
|
| ||||||
|
700,000 doses administered
| ||||||
| Baseline | 28.53 | 83,552 | 28.53 | 67,946 | 28.59 | 82,175 |
| Three lowest-income counties | 27.82 | 75,981 | 27.80 | 66,060 | 27.84 | 75,030 |
| Three highest-income counties | 28.58 | 82,412 | 28.57 | 68,601 | 28.58 | 82,656 |
SOURCE Authors’ analyses. NOTE Baseline is equal distribution of vaccines across the region.
When we altered the time required to complete the immunization program, we had similar findings (Exhibit 2). For example, when only two counties could receive vaccine (400,000 total doses), immunization began eight weeks prior to the peak, and vaccine administration was completed in 180 days, allocating vaccines to the wealthiest counties rather than the poorest resulted in 1.4 percent (32.76 percent versus 31.35 percent) more of the population being infected, and 7,626 (82,656 versus 75,030) more new daily infections at the epidemic’s peak.
Exhibit 3 shows various disease outcomes under different vaccination scenarios, including the substantial productivity losses that could ensue from favoring the wealthiest counties. When 700,000 total doses went to the three wealthiest counties instead of the three poorest, an additional $12 million in productivity losses occurred. With 400,000 doses allocated to the two wealthiest counties instead of the two poorest, the difference was almost $24 million.
Exhibit 3.
Health And Economic Outcomes Of Influenza Epidemic, For Different Scenarios
| Allocation of vaccines | Mean outcome
|
|||||
|---|---|---|---|---|---|---|
| Influenza infections | Patients visiting clinics | Patients hospitalized | Deaths | Productivity loss ($ millions) | Years of life lost | |
|
200,000 doses administered
| ||||||
| Baseline | 2,614,977 | 522,995 | 279 | 21.04 | 561.6 | 275.5 |
| Lowest-income county | −49,255 | −9,851 | −2 | −0.09 | −10.5 | −1.9 |
| Highest-income county | −2,599 | −519 | —a | −0.05 | −0.6 | −0.5 |
|
| ||||||
|
400,000 doses administered
| ||||||
| Baseline | 2,449,140 | 489,828 | 257 | 19.21 | 525.8 | 252.6 |
| Two lowest-income counties | −126,993 | −25,399 | −6 | −0.23 | −27.0 | −4.8 |
| Two highest-income counties | −14,953 | −2,991 | 1 | 0.16 | −3.1 | 1.7 |
|
| ||||||
|
700,000 doses administered
| ||||||
| Baseline | 2,116,246 | 423,249 | 218 | 16.22 | 454.2 | 214.3 |
| Three lowest-income counties | −52,823 | −10,564 | −1 | 0.07 | −11.2 | −0.6 |
| Three highest-income counties | 3,899 | 780 | 5 | 0.49 | 1.0 | 5.4 |
SOURCE Authors’ analyses. NOTES Baseline is equal distribution of vaccines across the region. Negative numbers are less than baseline; positive numbers are more than baseline.
Same as baseline.
DELAYED VACCINE AVAILABILITY
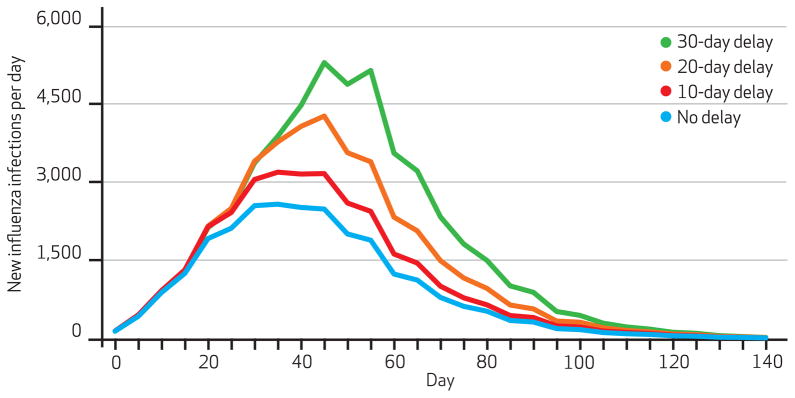
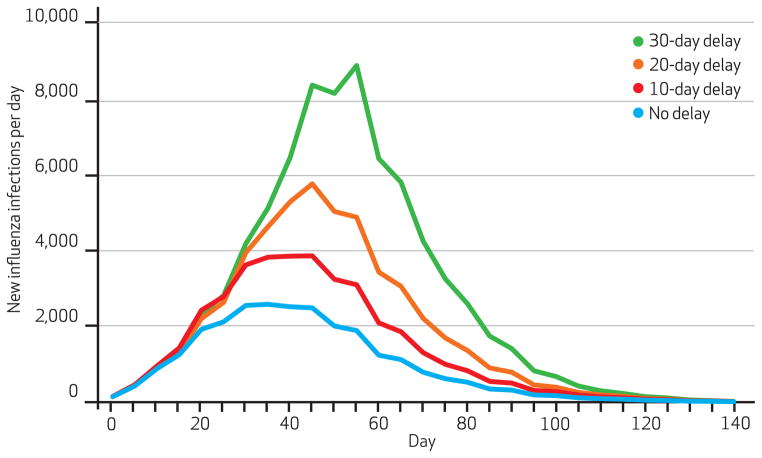
Exhibit 4 shows the number of new infections per day when the single poorest county received vaccine ten, twenty, or thirty days later than the other counties. Exhibit 5 demonstrates what happened when these delays affected the two poorest counties. (Appendix Exhibit 3 shows the results when delays affected the three poorest counties.)22 In all cases, greater delays increased the number of infections and the number of new infections at the epidemic’s peak. For example, delaying vaccination in the two poorest counties by ten days increased the percentage of the population infected by 0.68 percent and daily new infections at the epidemic’s peak by 1,477. A thirty-day delay boosted the percentage of the population infected by 2.75 percent and the number of new daily infections at the peak by 7,405.
Exhibit 4.
Number Of New Influenza Infections Each Day When Lowest-Income County Experiences Delays In Vaccination Compared To Other Counties
SOURCE Authors’ analyses. NOTE Vaccination begins eight weeks before the epidemic’s peak and has a ninety-day administration rate.
Exhibit 5.
Number Of New Influenza Infections Each Day When Two Lowest-Income Counties Experience Delays In Vaccination Compared To Other Counties
SOURCE Authors’ analyses. NOTE Vaccination begins eight weeks before the epidemic’s peak and has a ninety-day administration rate.
Delaying vaccination in the poorest counties also increased infections in the wealthiest counties (data not shown). Using the same schedule for vaccination as shown in Exhibits 4 and 5, delaying vaccination in the poorest county by only ten days increased the percentage of the wealthiest county’s residents who became infected by 0.32 percent. A thirty-day delay resulted in an increase of 1.31 percent. Delays in the two poorest counties led to increases in the two wealthiest counties ranging from 0.68 percent (with a ten-day delay) to 2.75 percent (with a thirty-day delay). If the three poorest counties experienced delays, the increases in the three wealthiest counties were 0.59 percent (with a ten-day delay) and 3.03 percent (with a thirty-day delay).
Discussion
Our study identifies the potential importance of equitable vaccine distribution. During the 2009 H1N1 pandemic, long manufacturing lead times and limited manufacturing capacity constrained the availability of vaccine. Obviously, shortages may occur in future epidemics, too. Moreover, vaccine distribution channels might not be equivalent in all counties. Residents of wealthier counties may have better access to vaccine administration locations—including health care facilities, retail clinics, and pharmacies—and vaccines, compared to people in poorer counties.
Historically, shortages have led to rationing and unequal distribution, which can leave many people unvaccinated.7,40–44 Studies have shown that poorer counties have worse access to health care and new medical technologies than richer counties. Mainstream news reports suggested that disparities in H1N1 vaccine administration occurred in 2009–10.45
In general, our study emphasizes the importance of viewing society as an ecosystem: people and counties are interconnected. Society, including wealthier counties, may have an incentive to increase immunization rates in poorer counties, which tend to have high-density populations46 and more children and other higher-risk people per household, resulting in more interactions and both increased transmission of influenza and greater risk for worse influenza outcomes. Compared to people in wealthier counties, the residents of poorer counties also may be less able to stay away from infected people at work by working remotely, be more dependent on public transportation, and be less able to keep their children from interacting with other children—who may be infectious—when schools close because of influenza outbreaks.15
The barriers to equitable vaccine distribution are formidable. Even when vaccines are available, willingness to be vaccinated varies. It is especially low among African Americans,47–49 who disproportionately reside in poorer neighborhoods.50 Although nontraditional venues for vaccination such as grocery stores and pharmacies have recently increased,51 such businesses are less common in poorer neighborhoods.46 Nevertheless, other vaccine distribution innovations—for example, distribution of vaccine in a public school system—have been successful in poorer communities52 and schools.53
Conclusions
Justice is not the only argument for an equitable distribution of influenza vaccine. Another argument is that such distribution could also be an important way to mitigate the overall severity of an epidemic, given that many poor counties have fairly high population densities with high levels of interaction among households and communities. Giving wealthier counties better access to vaccine than poorer ones could worsen an epidemic.
Before the next epidemic arrives, public health officials arguably should identify ways to ensure that vaccines are available to all counties in a timely manner.
Acknowledgments
This study was supported by the National Institute of General Medical Sciences Models of Infectious Disease Agent Study (Grant No. 1U54GM088491-0109) and the Vaccine Modeling Initiative, funded by the Bill & Melinda Gates Foundation. The funders had no role in the design and conduct of the study; collection, management, analysis, and interpretation of the data; or preparation, review, or approval of the manuscript. Bruce Lee has served as a consultant for GlaxoSmithKline and Novartis. Richard Zimmerman has provided research grant support and been a consultant on influenza vaccination in the workplace for Medimmune and has provided research grant support on unrelated vaccine topics and been a speaker for Merck.
Biographies

Bruce Y. Lee is an assistant professor at the University of Pittsburgh.
In this issue of Health Affairs, Bruce Lee and his coauthors report on modeling studies conducted at the University of Pittsburgh to determine the most effective allocation of vaccines when quantities are limited.
The paper grew out of work that Lee and colleagues did for the Department of Health and Human Services on options for the 2009 H1N1 vaccine allocation. They found that households in poorer neighborhoods often have more people, are located closer together, and include more children—all of which contribute to disease transmission. Many individuals in poorer neighborhoods also travel substantial distances to wealthier neighborhoods to work.
These and other observations led them to test simulations that showed that giving vaccine first to poorer communities would lower everyone’s risk of disease. “It was a gradual realization that this could be an example of how seemingly selfless, altruistic behavior can actually bring selfish, utilitarian benefits—always a surprise,” Lee says.
Lee is an assistant professor of medicine, epidemiology, and biomedical informatics at the University of Pittsburgh as well as the Applied Modeling Project principal investigator for the Models of Infectious Disease Agent Study, National Center of Excellence, which is also at the University of Pittsburgh. His research group specializes in developing economic and operational computer models to tackle infectious diseases of global importance. Lee received his medical degree from Harvard Medical School and has a master of business administration degree from the Stanford Graduate School of Business.
Shawn T. Brown is an assistant professor at the University of Pittsburgh.
Shawn Brown is an assistant professor of biostatistics, a research fellow at the Pittsburgh Supercomputing Center, and head of the Models of Infectious Disease Agent Study’s Network Software Working Group. His current research interests include simulations for informed decision support, vaccine distribution, agent-based modeling of disease dynamics, and high-performance computing in simulation and modeling. He earned his doctorate in chemistry from the University of Georgia.
Rachel R. Bailey is a research coordinator at the University of Pittsburgh.
Rachel Bailey is a research coordinator and senior analyst in Lee’s research group. She earned her doctorate and master of public health degree in epidemiology from the University of Pittsburgh.
Richard K. Zimmerman is a professor at the University of Pittsburgh.
Richard Zimmerman is a professor of family medicine and clinical epidemiology at the University of Pittsburgh. He earned his master of arts degree in bioethics from Trinity International, his medical degree from the Ohio State University, and his master of public health degree from the University of Minnesota.
Margaret A. Potter is the director of the Center for Public Health Practice, Graduate School of Public Health, at the University of Pittsburgh.
Margaret Potter holds several positions at the University of Pittsburgh: director of the Center for Public Health Practice; codirector for Preparedness Policy in the Center for Public Health Preparedness; associate professor of health policy and management; and codirector of the Center for National Preparedness at the University of Pittsburgh Graduate School of Public Health. She earned her juris doctor degree from the Rutgers School of Law.

Sarah M. McGlone is a senior analyst at the University of Pittsburgh.
Sarah McGlone is a research coordinator and senior analyst in Lee’s group. She earned her master of public health degree from the Ohio State University.
Philip C. Cooley is a fellow in computational biology at RTI International.
Philip Cooley is a fellow in computational biology and assistant director of bioinformatics at RTI International, an independent research institute based in North Carolina. He earned his master of science degree in operations research from the University of North Carolina.

John J. Grefenstette is a professor at the University of Pittsburgh.
John Grefenstette is director of the Public Health Dynamics Laboratory and a professor of biostatistics at the University of Pittsburgh. He earned his doctorate in computer science from the University of Pittsburgh.
Shanta M. Zimmer is an associate professor at the University of Pittsburgh.
Shanta Zimmer is an associate professor of medicine at the University of Pittsburgh. She earned her medical degree from Emory University.

William D. Wheaton is the director of geospatial science and technology at RTI International.
Bill Wheaton is senior research geographer and director of geospatial science and technology at RTI International. He earned his master of science degree in liberal studies from Duke University.
Sandra Crouse Quinn is a professor at the University of Pittsburgh.
Sandra Quinn is associate dean for public health initiatives and a professor of behavioral and community health sciences at the University of Pittsburgh. She earned her doctorate in health education from the University of Maryland.

Ronald E. Voorhees is chief of the Office of Epidemiology and Biostatistics, Allegheny County Health Department.
Ronald Voorhees is chief of epidemiology and biostatistics in the Allegheny County (Pennsylvania) Health Department and a visiting associate professor of epidemiology at the University of Pittsburgh. He earned his medical degree from the University of New Mexico and a master of public health degree from the Johns Hopkins University.

Donald S. Burke is dean of the Graduate School of Public Health at the University of Pittsburgh.
Donald Burke holds several titles at the University of Pittsburgh. He is dean of the Graduate School of Public Health, associate vice chancellor for global health, the UPMC–Jonas Salk Chair in Global Health, and principal investigator for the Models of Infectious Disease Agent Study National Center of Excellence. He earned his medical degree from Harvard Medical School.
Contributor Information
Bruce Y. Lee, Email: BYL1@pitt.edu, University of Pittsburgh, in Pennsylvania.
Shawn T. Brown, University of Pittsburgh.
Rachel R. Bailey, Departments of Medicine, Epidemiology, and Biomedical Informatics at the University of Pittsburgh.
Richard K. Zimmerman, University of Pittsburgh.
Margaret A. Potter, Center for Public Health Practice, Graduate School of Public Health, at the University of Pittsburgh.
Sarah M. McGlone, Departments of Medicine, Epidemiology, and Biomedical Informatics at the University of Pittsburgh.
Philip C. Cooley, RTI International, in Research Triangle Park, North Carolina.
John J. Grefenstette, University of Pittsburgh.
Shanta M. Zimmer, University of Pittsburgh.
William D. Wheaton, RTI International, in Research Triangle Park, North Carolina.
Sandra Crouse Quinn, University of Pittsburgh.
Ronald E. Voorhees, Allegheny County Health Department, in Pittsburgh, Pennsylvania.
Donald S. Burke, University of Pittsburgh.
NOTES
- 1.Henderson DA, Courtney B, Inglesby TV, Toner E, Nuzzo JB. Public health and medical responses to the 1957–58 influenza pandemic. Biosecur Bioterr. 2009;7(3):265–73. doi: 10.1089/bsp.2009.0729. [DOI] [PubMed] [Google Scholar]
- 2.Murray R. Production and testing in the USA of influenza virus vaccine made from the Hong Kong variant in 1968–69. Bull World Health Organ. 1969;41(3):495–6. [PMC free article] [PubMed] [Google Scholar]
- 3.Department of Health and Human Services. HHS pandemic influenza plan: supplement 6; vaccine distribution and use [Internet] Washington (DC): HHS; 2009. [cited 2011 Apr 25]. Available from: http://www.hhs.gov/pandemicflu/plan/pdf/S06.pdf. [Google Scholar]
- 4.Logan JL. Disparities in influenza immunization among US adults. J Natl Med Assoc. 2009;101:161–6. doi: 10.1016/s0027-9684(15)30830-0. [DOI] [PubMed] [Google Scholar]
- 5.Hennessy-Fiske M. Los Angeles Times. 2010. Mar 1, H1N1 vaccine was unevenly distributed across L.A. County, figures show. [Google Scholar]
- 6.Schneider EC, Cleary PD, Zaslavsky AM, Epstein AM. Racial disparity in influenza vaccination: does managed care narrow the gap between African Americans and whites? JAMA. 2001;286(12):1455–60. doi: 10.1001/jama.286.12.1455. [DOI] [PubMed] [Google Scholar]
- 7.Blumenshine P, Reingold A, Egerter S, Mockenhaupt R, Braveman P, Marks J. Pandemic influenza planning in the United States from a health disparities perspective. Emerg Infect Dis. 2008;14(5):709–15. doi: 10.3201/eid1405.071301. [DOI] [PMC free article] [PubMed] [Google Scholar]
- 8.Yen IH, Kaplan GA. Poverty area residence and changes in physical activity level: evidence from the Alameda County study. Am J Public Health. 1998;88:1709–12. doi: 10.2105/ajph.88.11.1709. [DOI] [PMC free article] [PubMed] [Google Scholar]
- 9.James AS, Hall S, Greiner KA, Buckles D, Born WK, Ahluwalia JS. The impact of socioeconomic status on perceived barriers to colorectal cancer testing. Am J Health Promot. 2008;23(2):97–100. doi: 10.4278/ajhp.07041938. [DOI] [PubMed] [Google Scholar]
- 10.Lorant V, Boland B, Humblet P, Deliege D. Equity in prevention and health care. J Epidemiol Community Health. 2002;56:510–6. doi: 10.1136/jech.56.7.510. [DOI] [PMC free article] [PubMed] [Google Scholar]
- 11.Ompad DC, Galea S, Blaney S, Coady MH, Sisco S, Glidden K, et al. Access to influenza vaccine in east Harlem and the Bronx during a national vaccine shortage. J Community Health. 2007;32(2):195–202. doi: 10.1007/s10900-006-9043-3. [DOI] [PubMed] [Google Scholar]
- 12.Shi L, Stevens GD. Vulnerability and unmet health care needs. J Gen Intern Med. 2005;20:148–54. doi: 10.1111/j.1525-1497.2005.40136.x. [DOI] [PMC free article] [PubMed] [Google Scholar]
- 13.Luman ET, McCauley MM, Shefer A, Chu SY. Maternal characteristics associated with vaccination of young children. Pediatrics. 2003;111(5):1215–8. [PubMed] [Google Scholar]
- 14.Leon K, McDonald MC, Moore B, Rust G. Disparities in influenza treatment among disabled Medicaid patients in Georgia. Am J Public Health. 2009;99(Suppl 2):S378–82. doi: 10.2105/AJPH.2008.157602. [DOI] [PMC free article] [PubMed] [Google Scholar]
- 15.Quinn SC, Kumar S, Freimuth VS, Kidwell K, Musa D, Casteneda-Angarita N, et al. Racial disparities in exposure, susceptibility, and access to health care in the US H1N1 influenza pandemic. Am J Public Health. 2011;101(2):285–93. doi: 10.2105/AJPH.2009.188029. [DOI] [PMC free article] [PubMed] [Google Scholar]
- 16.Braveman P. Health disparities and health equity: concepts and measurement. Annu Rev Public Health. 2006;27:167–94. doi: 10.1146/annurev.publhealth.27.021405.102103. [DOI] [PubMed] [Google Scholar]
- 17.Chaskin RJ. Perspectives on neighborhood and community: a review of the literature. Social Service Review. 1997;71(4):521–47. [Google Scholar]
- 18.Lee BY, Brown ST, Cooley PC, Zimmerman RK, Wheaton WD, Zimmer SM, et al. A computer simulation of employee vaccination to mitigate an influenza epidemic. Am J Prev Med. 2010;38(3):247–57. doi: 10.1016/j.amepre.2009.11.009. [DOI] [PMC free article] [PubMed] [Google Scholar]
- 19.Wheaton WD, Cajka JC, Chasteen BM, Wagener DK, Cooley PC, Ganapathi L, et al. Synthesized population databases: a US geo-spatial database for agent-based models [Internet] Research Triangle Park (NC): RTI Press; 2009. May, [cited 2011 Apr 26]. (Publication No.: MR-0010-0905). Available from: http://www.rti.org/pubs/mr-0010-0905-wheaton.pdf. [DOI] [PMC free article] [PubMed] [Google Scholar]
- 20.Zimmerman RK, Lauderdale DS, Tan SM, Wagener DK. Prevalence of high-risk indications for influenza vaccine varies by age, race, and income. Vaccine. 2010;28(39):6470–7. doi: 10.1016/j.vaccine.2010.07.037. [DOI] [PMC free article] [PubMed] [Google Scholar]
- 21.Beckman RJ, Baggerly K, McKay M. Creating synthetic baseline populations. Transportation Research Part A: Policy and Practice. 1996;30(6):415–29. [Google Scholar]
- 22.To access the Appendix, click on the Appendix link in the box to the right of the article online.
- 23.Eubank S, Guclu H, Kumar VS, Marathe MV, Srinivasan A, Toroczkai Z, et al. Modelling disease outbreaks in realistic urban social networks. Nature. 2004;429(6988):180–4. doi: 10.1038/nature02541. [DOI] [PubMed] [Google Scholar]
- 24.Ferguson NM, Cummings DA, Cauchemez S, Fraser C, Riley S, Meeyai A, et al. Strategies for containing an emerging influenza pandemic in Southeast Asia. Nature. 2005;437(7056):209–14. doi: 10.1038/nature04017. [DOI] [PubMed] [Google Scholar]
- 25.Ferguson NM, Cummings DA, Fraser C, Cajka JC, Cooley PC, Burke DS. Strategies for mitigating an influenza pandemic. Nature. 2006;442 (7101):448–52. doi: 10.1038/nature04795. [DOI] [PMC free article] [PubMed] [Google Scholar]
- 26.Germann TC, Kadau K, Longini IM, Jr, Macken CA. Mitigation strategies for pandemic influenza in the United States. Proc Natl Acad Sci USA. 2006;103(15):5935–40. doi: 10.1073/pnas.0601266103. [DOI] [PMC free article] [PubMed] [Google Scholar]
- 27.Halloran ME, Ferguson NM, Eubank S, Longini IM, Jr, Cummings DA, Lewis B, et al. Modeling targeted layered containment of an influenza pandemic in the United States. Proc Natl Acad Sci USA. 2008;105(12):4639–44. doi: 10.1073/pnas.0706849105. [DOI] [PMC free article] [PubMed] [Google Scholar]
- 28.Longini IM, Jr, Halloran ME, Nizam A, Yang Y. Containing pandemic influenza with antiviral agents. Am J Epidemiol. 2004;159(7):623–33. doi: 10.1093/aje/kwh092. [DOI] [PubMed] [Google Scholar]
- 29.Longini IM, Jr, Nizam A, Xu S, Ungchusak K, Hanshaoworakul W, Cummings DA, et al. Containing pandemic influenza at the source. Science. 2005;309(5737):1083–7. doi: 10.1126/science.1115717. [DOI] [PubMed] [Google Scholar]
- 30.Lee BY, Brown ST, Cooley P, Potter MA, Wheaton WD, Voorhees RE, et al. Simulating school closure strategies to mitigate an influenza epidemic. J Public Health Manag Pract. 2010;16(3):252–61. doi: 10.1097/PHH.0b013e3181ce594e. [DOI] [PMC free article] [PubMed] [Google Scholar]
- 31.Centers for Disease Control and Prevention. Vaccine against 2009 H1N1 influenza virus [Internet] Atlanta (GA): CDC; 2009. [cited 2011 May 4]. Available from: http://www.cdc.gov/h1n1flu/vaccination/public/vaccination_qa_pub.htm. [Google Scholar]
- 32.Fiore AE, Uyeki TM, Broder K, Finelli L, Euler GL, Singleton JA, et al. Prevention and control of influenza with vaccines: recommendations of the Advisory Committee on Immunization Practices (ACIP), 2010. MMWR Recomm Rep. 2010;59:1–62. [PubMed] [Google Scholar]
- 33.Beardsworth P. The impact of influenza on working days lost: a review of the literature. Parmacoeconomics. 2008;26(11):911–24. doi: 10.2165/00019053-200826110-00004. [DOI] [PubMed] [Google Scholar]
- 34.Department of Labor, Bureau of Labor Statistics. Occupational employment statistics: May 2008 national occupational employment and wage estimates, United States [Internet] Washington (DC): Bureau of Labor Statistics; 2009. [cited 2011 May 4]. Available from: http://stat.bls.gov/oes/2008/may/oes_nat.htm#b00-0000. [Google Scholar]
- 35.Human Mortality Database [home page on the Internet] Berkeley (CA): University of California; [cited 2011 May 4]. Available from: http://www.mortality.org. [Google Scholar]
- 36.Thompson WW, Shay DK, Weintraub E, Brammer L, Bridges CB, Cox NJ, et al. Influenza-associated hospitalizations in the United States. JAMA. 2004;292(11):1333–40. doi: 10.1001/jama.292.11.1333. [DOI] [PubMed] [Google Scholar]
- 37.Thompson WW, Shay DK, Weintraub E, Brammer L, Cox N, Anderson LJ, et al. Mortality associated with influenza and respiratory syncytial virus in the United States. JAMA. 2003;289(2):179–86. doi: 10.1001/jama.289.2.179. [DOI] [PubMed] [Google Scholar]
- 38.Rothberg MB, Rose DN. Vaccination versus treatment of influenza in working adults: a cost-effectiveness analysis. Am J Med. 2005;118(1):68–77. doi: 10.1016/j.amjmed.2004.03.044. [DOI] [PubMed] [Google Scholar]
- 39.Lee BY, Bacon KM, Donohue JM, Wiringa AE, Bailey RR, Zimmerman RK. From the patient perspective: the economic value of seasonal and H1N1 influenza vaccination. Vaccine. 2011;29(11):2149–58. doi: 10.1016/j.vaccine.2010.12.078. [DOI] [PMC free article] [PubMed] [Google Scholar]
- 40.Kempe A, Daley MF, Stokley S, Crane LA, Beaty BL, Barrow J, et al. Impact of severe influenza vaccine shortage on primary care practice. Am J Prev Med. 2007;33(6):486–91. doi: 10.1016/j.amepre.2007.07.038. [DOI] [PubMed] [Google Scholar]
- 41.Lee TH. Rationing influenza vaccine. N Engl J Med. 2004;351(23):2365–6. doi: 10.1056/NEJMp048328. [DOI] [PubMed] [Google Scholar]
- 42.Mody L, Cinti S. Pandemic influenza planning in nursing homes: are we prepared? J Am Geriatr Soc. 2007;55:1431–7. doi: 10.1111/j.1532-5415.2007.01299.x. [DOI] [PMC free article] [PubMed] [Google Scholar]
- 43.Nowalk MP, Zimmerman RK, Cleary SM, Bruehlman RD. Missed opportunities to vaccinate older adults in primary care. J Am Board Fam Pract. 2005;18:20–7. doi: 10.3122/jabfm.18.1.20. [DOI] [PubMed] [Google Scholar]
- 44.Zimmerman RK, Tabbarah M, Nowalk MP, Raymund M, Wilson SA, McGaffey A, et al. Impact of the 2004 influenza vaccine shortage on patients from inner city health centers. J Urban Health. 2006;84(3):389–99. doi: 10.1007/s11524-006-9150-6. [DOI] [PMC free article] [PubMed] [Google Scholar]
- 45.Centers for Disease Control and Prevention, Advisory Committee on Immunization Practices (ACIP) Summary report: February 24–25, 2010 [Internet] Atlanta (GA): CDC; 2010. [cited 2011 May 5]. Available from: http://www.cdc.gov/vaccines/recs/acip/downloads/min-feb10.pdf. [Google Scholar]
- 46.Morland K, Wing S, Roux AD, Poole C. Neighborhood characteristics associated with the location of food stores and food service places. Am J Prev Med. 2002;22(1):23–9. doi: 10.1016/s0749-3797(01)00403-2. [DOI] [PubMed] [Google Scholar]
- 47.Armstrong K, Berlin M, Schwartz JS, Propert K, Ubel PA. Barriers to influenza immunization in a low-income urban population. Am J Prev Med. 2001;20(1):21–5. doi: 10.1016/s0749-3797(00)00263-4. [DOI] [PubMed] [Google Scholar]
- 48.Rangel MC, Shoenbach VJ, Weigle KA, Hogan VK, Strauss RP, Bangdiwala SI. Racial and ethnic disparities in influenza vaccination among elderly adults. J Gen Intern Med. 2005;20(5):426–31. doi: 10.1111/j.1525-1497.2005.0097.x. [DOI] [PMC free article] [PubMed] [Google Scholar]
- 49.Jones TF, Ingram A, Craig AS, Schaffner W. Determinants of influenza vaccination, 2003–2004: shortages, fallacies, and disparities. Clin Infect Dis. 2004;39:1824–8. doi: 10.1086/427153. [DOI] [PubMed] [Google Scholar]
- 50.Williams DR, Jackson PB. Social sources of racial disparities in health. Health Aff (Millwood) 2005;24(2):325–34. doi: 10.1377/hlthaff.24.2.325. [DOI] [PubMed] [Google Scholar]
- 51.Helms CM, Guerra FA, Klein JO, Schaffner W, Arvin AM, Peter G. Strengthening the nation’s influenza vaccination system. Am J Prev Med. 2005;29(3):221–6. doi: 10.1016/j.amepre.2005.05.011. [DOI] [PubMed] [Google Scholar]
- 52.Coady MH, Weiss L, Galea S, Ompad DC, Glidden K, Vlahov D. Rapid vaccine distribution in non-traditional settings: lessons learned from project VIVA. J Community Health Nurs. 2007;24(2):79–85. doi: 10.1080/07370010701316163. [DOI] [PubMed] [Google Scholar]
- 53.Carpenter LR, Lott J, Lawson BM, Hall S, Craig AS, Schaffner W, et al. Mass distribution of free, intra-nasally administered influenza vaccine in a public school system. Pediatrics. 2007;120(1):e172–8. doi: 10.1542/peds.2006-2603. [DOI] [PubMed] [Google Scholar]


