

Abstract
Latent infection of EBV is linked to the development of multiple cancers that have distinct patterns of expression of viral proteins and microRNAs (miRNAs). In this study, we show that in vitro infection of a gastric epithelial cell line with EBV alters growth properties and induces growth in soft agar. The infected cells have high levels of expression of a large cluster of viral miRNAs, [the BamHI A rightward transcript (BART) miRNAs] and limited viral protein expression. Expression profile microarray analysis of this cell line revealed a large number of changes in cellular expression, with decreased expression of many genes. Inhibition of the trace-expressed levels of the viral oncoprotein, latent membrane protein 1, did not affect growth or alter the pattern of cellular expression. The expression changes are highly enriched for genes involved in cell motility and transformation pathways, suggesting these changes are important for the altered growth phenotype. Importantly, the transcripts decreased by microarray are significantly enriched in both experimentally and bioinformatically predicted BART miRNA targets. The absence of viral protein expression and the enrichment for viral miRNA targets in the modulated cell genes suggest that the BART miRNAs are major contributors to the transformed growth properties of the EBV-infected cells. The ability to affect cell growth through miRNA expression without viral protein expression would be a major factor in the development of cancer in individuals with functional immune systems.
Keywords: gastric carcinoma, oncogenesis, herpes virus
EBV is a gamma-herpesvirus that establishes a lifelong latent infection in greater than 90% of the human population (1). EBV is a contributing factor to multiple malignancies that contain the viral genome, including Burkitt lymphoma (BL), Hodgkin disease (HD), posttransplant lymphoma, nasopharyngeal carcinoma (NPC), and gastric carcinoma (GC) (1, 2). In vitro, EBV infection leads to the immortalized growth of B lymphocytes, and these transforming properties are thought to be linked to its role in the development of cancer (1, 2). Different patterns of viral gene expression have been identified in infected lymphocytes and the various malignancies. The most complex pattern, termed type III latency, is found in B lymphocytes infected in vitro as well as in lymphomas that arise in immune-compromised individuals (1). Type III latency is marked by expression of EBV nuclear antigen 2 (EBNA2), which regulates expression of additional EBNAs. The malignancies that arise in individuals with competent immune systems have a much more restricted pattern of viral protein regulation. In type I latency, which is found in BL and some GCs, EBNA1, which is required for maintenance of the EBV episome, is the only expressed viral protein (3, 4). In type II latency characteristic of HD and NPC, the oncogenic latent membrane proteins 1 and 2 (LMP1 and LMP2) can be expressed in addition to EBNA1 (1, 2).
There are also several viral noncoding RNAs associated with EBV latent infection. The BamHI A rightward transcripts (BARTs) are a set of alternatively spliced transcripts that were originally identified in NPC samples (5, 6), where they are abundantly expressed. These transcripts are the template for the precursors for as many as 44 microRNAs (miRNAs) (7–9). The miRNAs are ∼22-nt RNAs processed from longer RNA polymerase II transcripts that function much like siRNAs in inhibiting protein translation through base pair interactions with target mRNAs (10). The BART miRNAs can be detected by PCR in all forms of EBV latency, although by far the highest expression is detected in type I and II latency, particularly in epithelial cell infection (e.g., NPC, GC) (7, 11, 12), in which a large percentage of the total miRNA pool is exclusively BART miRNAs, as evidenced by high-throughput sequencing of small RNA libraries (9, 13).
The function of the BART miRNAs in the EBV life cycle and in relation to EBV malignancies is presently unknown. The EBV B95-8 laboratory strain that readily transforms primary B lymphocytes is deleted for most of the BART miRNAs, which, in combination with the minimal expression in B-cell lines, indicates that they are not required for B-cell transformation (11, 14). However, a cluster of three miRNAs that are produced from the primary EBNA2 transcript have been shown to contribute to B-cell transformation (15, 16). The contribution of the BART miRNAs to the development of EBV-associated cancers of epithelial origin has only begun to be explored. Several genes involved in apoptosis are potential targets of various BART miRNAs, including PUMA, Bim, and TOMM22 (17–19). Tumor suppressor genes, such as WIF1 and APC, have also been suggested as targets (20). However, many likely targets of the BART miRNAs and their biological effects have yet to be determined.
This study shows that EBV infection of a GC cell line results in altered growth properties. The EBV-negative AGS cell line normally grows very poorly in soft agar; however, cells latently infected with a recombinant EBV are anchorage-independent, a hallmark of transformation. The expression pattern of these cells is reminiscent of type I latency, with very limited protein expression but high levels of the BART miRNAs. Importantly, microarray analysis revealed dramatic changes in expression patterns after infection with EBV. The large numbers of genes down-regulated during EBV latent infection are enriched for potential BART miRNA targets, suggesting the BART miRNAs are major contributors to the dramatic expression changes. This finding provides evidence of EBV effects on epithelial cell growth that are likely attributable to BART miRNA expression. This in vitro system should be ideally suited for the further study of the contribution of the BART miRNAs to EBV-induced malignancy.
Results
EBV Latent Infection in AGS Cells Promotes Growth in Soft Agar.
To identify effects of EBV infection on epithelial cell growth properties, the ability of an EBV-negative GC cell line (AGS), which was stably infected in vitro with a recombinant EBV, was assessed for growth in soft agar (21). Growth in soft agar indicative of anchorage independence is a hallmark phenotype of cellular transformation. Uninfected AGS cells grew very poorly in soft agar, with dead remnants or aborted colonies remaining after 1–2 wk in culture (Figs. 1A and 2C). In contrast, cells infected with EBV grew significantly better in soft agar, with uniformly healthy looking colonies after 1–2 wk in culture (Figs. 1A and 2C).
Fig. 1.

Phenotype and expression pattern of AGS cells infected with EBV. (A) AGS cells and AGS cells infected with EBV were grown in soft agar for 12 d. A representative colony from the infected cells compared with a picture of the aborted colonies from the uninfected cells is shown. The pictures as currently shown are at 100× magnification. (B) Expression of EBV latent proteins in AGS cells; AGS cells infected with EBV; Jijoye, a type III BL cell line; and C666-1, an NPC cell line. Expression of LMP1, LMP2, and EBNA2 by Western blotting is shown, with HSC70 and GAPDH used as loading controls (Left) or overexposed to show the small amount of LMP1 (Right) expressed in the AGS-EBV cells. (C) Quantitative RT-PCR for representative BART miRNAs in AGS-EBV cells. Plotted are the relative expression levels of each miRNA relative to the NPC cell line C666-1 from three independent experiments with the SEM indicated.
Fig. 2.

Inhibition of LMP1 through a DN or with shRNAs. (A) LMP1 expression in stable cell lines expressing a DN LMP1 (204-208AAAAA, Y384G), the pBABE vector control, two independent shRNAs targeted to LMP1, and a scrambled shRNA sequence used as a negative control. Shown is a long-exposure Western blot for LMP1, illustrating the large degree of overexpression of the DN construct over the endogenous LMP1 and knockdown by the shRNAs. GAPDH is used as a loading control. (B) Stable cell lines were grown in soft agar for 12 d. Arrows point to examples of the four classes of colonies scored below; single cell (1), aborted colony (2), small colony (3), and large colony (4). The pictures as currently shown are at 50× magnification. (C) Colonies in each soft agar assay were counted and classified based on the four categories shown above. At least 150 colonies for each genotype were counted.
To assess EBV expression in the infected AGS cell line, expression of EBNA2, LMP1, and LMP2 was determined by immunoblotting. The AGS-EBV cells lacked EBNA2 expression, indicative of type III latency, and had trace levels of LMP1 compared with the Jijoye type III BL cell line although slightly higher than the NPC cell line, C666-1. LMP2 was not expressed, similar to expression in type I latency (Fig. 1B). Expression of the BART miRNAs was determined using quantitative RT-PCR of a subset of the BART miRNAs. Each BART miRNA that was assessed had reproducibly high expression, higher than the NPC C666-1 cell line in all cases, indicating that this infected cell line produces very high levels of EBV BART miRNAs (Fig. 1C).
LMP1 is necessary for lymphoid transformation and is sufficient for transformation of rodent fibroblasts (22, 23). To determine the requirement for LMP1 for the altered growth in soft agar, LMP1 was inhibited by expression of a dominant negative (DN) LMP1 construct. This construct expresses LMP1 with mutated CTAR1 and CTAR2, the major transactivating domains, and is thought to function as a DN by oligomerizing with and inactivating endogenous LMP1 (24). The LMP1 DN was stably expressed at levels many fold greater than the WT LMP1 in the infected cell lines (Fig. 2A). Additionally, two cell lines were produced that stably expressed LMP1 shRNAs that had significantly reduced expression of LMP1 protein (Fig. 2A). In both cases, the inhibition of LMP1 did not affect the enhanced growth in soft agar (Fig. 2 B and C).
Microarray Analysis of EBV-Infected AGS Cells.
Growth in soft agar is a complex phenotype that likely reflects numerous changes in multiple cellular pathways. To assess the effects of EBV infection, AGS cell gene expression, transcriptional profiling was performed using the Agilent G3 Human GE 8×60K dual-color microarray. Four arrays tested the infected AGS cells without further modification, two arrays assessed the infected cells with the LMP1 DN construct, and two arrays were used for the infected cells with the control vector for the DN construct. Each array was performed from a separate culture of cells, and the reference RNA was a pooled mix of four RNA preparations from the uninfected AGS cells. Strikingly, there were a large number of genes that were differentially expressed in the infected cells despite the lack of viral protein expression. Using a one-sample t test for genes significantly differentially expressed with EBV infection, 2,251 spots on the array were significantly down-regulated at least twofold and 1,351 spots were up-regulated at least twofold (Table 1). Hierarchical clustering analysis of the differentially expressed genes separated the arrays of cells that contained vectors (LMP1-DN or pBABE control). The two LMP1 DN samples clustered together; however, the differences between them and the vector control samples are similar to the differences between the four replicate arrays from the cells lacking any vectors (Fig. 3). To evaluate changes in expression patterns attributable to LMP1 further, a one-way ANOVA was performed comparing either the two arrays performed using the LMP1 DN cell line with the two vector control arrays or all other six microarrays. In either case, very few significant twofold changes were observed (Table 1). These data reveal that there are large-scale changes in gene expression during latent EBV infection of AGS cells and that the small amount of LMP1 expression in this situation is not responsible for these changes.
Table 1.
Summary of array data
| Down at least twofold | Up at least twofold | |
| Eight EBV arrays vs. noninfected* | 2,251 | 1,353 |
| Two LMP1 DN vs. two vector controls† | 1 | 1 |
| Two LMP1 DN vs. two vector controls and four with no vector† | 3 | 2 |
*One-sample t test with an FDR adjusted to P < 0.05.
†One-way ANOVA with an FDR adjusted to P < 0.05.
Fig. 3.

Heat map of all genes changed at least twofold on the microarray. A cluster diagram of the 3,602 entities that were statistically significantly changed twofold across the eight microarrays as produced by Partek Genomics Suite software. Blue indicates down-regulation, and red indicates up-regulation. The bracket tree at the top of the diagram demonstrates the similarity between the array data as determined by the clustering algorithm, with the length of the vertical bars being proportional to the degree of dissimilarity. The two arrays from cells expressing the LMP1 DN construct cluster together and then cluster with the pBABE vector control arrays. The expression of the LMP1 DN did not affect the expression pattern of these genes compared with the other arrays.
Ingenuity Pathway Analysis (IPA; Ingenuity Systems) software was used to analyze the 3,604 probes representing 2,859 unique genes to assign known molecular functions and relevant diseases and group them into categories. The software also statistically determines if these categories are enriched over the expected random number of genes that would fall into that category based on the size of the gene set and number of genes in that category across the genome and assigns a P value for any enrichment. The top four molecular and cellular functions enriched in this set of genes were cellular movement, cell-to-cell signaling and interaction, cell growth and proliferation, and cell death; each was highly significant with extremely low P values (Table 2). Interestingly, infection of AGS cells with EBV has been shown previously to increase cellular mobility (25), and expression of EBNA1 in AGS cells inhibits expression of promyelocytic leukemia nuclear bodies and reduces apoptosis in response to DNA damage (26). The IPA-identified categories reflect these known properties and are likely relevant to the growth in the soft agar phenotype presented here. These molecular function categories can be subdivided into more specific functions, and those that were significantly enriched along with the P values for enrichment are indicated in Table 2.
Table 2.
Enriched molecular and cellular functions in differentially expressed genes
| P value* | No. of genes | |
| Cellular movement | 373 | |
| Migration | 9.38E-16 | 344 |
| Cell movement | 9.38E-16 | 365 |
| Movement | 1.07E-15 | 345 |
| Invasion | 4.13E-07 | 120 |
| Chemotaxis | 2.28E-04 | 91 |
| Homing | 2.62E-04 | 96 |
| Recruitment | 4.84E-04 | 52 |
| Cell rolling | 6.66E-04 | 11 |
| Infiltration | 1.62E-03 | 64 |
| Extravasation | 3.57E-03 | 16 |
| Cell-to-cell signaling and interaction | 319 | |
| Binding | 1.07E-10 | 110 |
| Adhesion | 2.11E-06 | 118 |
| Activation | 2.25E-06 | 159 |
| Response | 1.27E-04 | 107 |
| Recruitment | 4.84E-04 | 52 |
| Afterhyperpolarization | 2.23E-03 | 3 |
| Density | 2.23E-03 | 3 |
| Inflammation | 2.23E-03 | 3 |
| Aggregation | 2.68E-03 | 13 |
| Stimulation | 2.75E-03 | 50 |
| Antiviral response | 3.50E-03 | 4 |
| Cell growth and proliferation | 549 | |
| Proliferation | 3.18E-09 | 444 |
| Growth | 5.52E-06 | 294 |
| Expansion | 7.38E-05 | 47 |
| Colony formation | 6.83E-04 | 80 |
| Formation | 1.99E-03 | 15 |
| Stimulation | 2.75E-03 | 50 |
| Quantity | 3.50E-03 | 4 |
| Cell death | 324 | |
| Apoptosis | 4.62E-07 | 243 |
| Cell death | 2.28E-06 | 313 |
| Self-renewal | 2.03E-04 | 5 |
| Survival | 1.34E-03 | 46 |
| Cytotoxicity | 3.18E-03 | 18 |
*Calculated using Fisher’s exact test.
Genes with Decreased Expression Are Enriched in BART miRNA Targets.
The limited viral protein expression in the AGS-EBV cells with elevated expression of the BART miRNAs suggests that if the BART miRNAs are responsible for some of the changes, the down-regulated genes should be enriched for BART miRNA targets. This would be true of not only the genes down-regulated twofold but of those down-regulated to a lesser degree, because miRNAs often have smaller changes on the level of mRNA of their targets as opposed to the protein level (27). There were 9,187 spots significantly down-regulated to any amount with a false discovery rate (FDR) of less than 0.05 on the microarray. The most comprehensive list of BART miRNA targets has been determined using a technique known as photoactivatable-ribonucleoside enhanced crosslinking and immunoprecipitation (PAR-CLIP), where miRNA targets from a dual Karposi's sarcoma-associated herpesvirus (KSHV)/EBV-infected primary effusion lymphoma cell line were immunoprecipitated and sequenced (28). Of the 2,764 unique mRNAs bound to EBV BART miRNAs, 940 were also down-regulated in the infected AGS cells Dataset S1). The 9,187 total spots down-regulated on the microarray represent 7,612 unique genes, which is 25.5% of the 29,870 unique genes represented on the Agilent arrays. A χ2 analysis revealed that the appearance of 940 predicted miRNA targets in the down-regulated genes is highly significant (P < 0.0001) over the 705 targets (25.5% of 2,764 genes) that would be expected if there were no correlation between the two sets of genes (Table 3). Interestingly, considering only those genes down-regulated greater than fourfold, there is no enrichment for miRNA targets. Of the 429 IPA-identified proteins that decreased fourfold, only 24 of these overlap with the PAR-CLIP dataset, which is fewer than the 39 genes (1.44%) that would be expected by random overlap. A similar analysis was performed on the up-regulated gene set. In this case of the 7,288 genes mapped by IPA, only 118 overlap with the BART miRNA targets, a significant depletion compared with the 674 expected by random overlap (Table 3).
Table 3.
miRNA targets are enriched in the down-regulated genes on array
| Down-regulated gene set |
Up-regulated gene set |
|||
| Observed overlap | Expected overlap* | Observed overlap | Expected overlap† | |
| EBV PAR-CLIP dataset | 940 | 705 | 118 | 674 |
| TargetScan 5.2 predictions | 1,707 | 1,576 | 214 | 1,508 |
| TargetScan 5.2 predictions of 10 highest expressing miRNAs | 737 | 527 | 82 | 504 |
| DIANA-microT predictions of 10 highest expressing miRNAs | 275 | 210 | 34 | 198 |
*Based on 25.5% of all genes recognized by IPA software down-regulated in microarray. χ2 analysis indicates P value for observed enrichment ≤0.0001 in each case.
†Based on 24.4% of all genes recognized by IPA software up-regulated in microarray. χ2 analysis indicates P value for observed depletion ≤0.0001 in each case.
The genes down-regulated in the microarray are also enriched for bioinformatically predicted BART miRNA targets. Predicted targets of all the potential BART miRNAs from the Targetscan 5.2 Web site were also significantly enriched for down-regulated genes (29) (Table 3). The enrichment is even higher if only targets predicted for 10 high-expressing miRNAs (miR-BART1-5p, 1-3p, 3, 4, 5, 7, 8, 8*, 9, and 10) are considered (Table 3). A second prediction program, Diana-microT (30), was also used to predict targets from these 10 high-expressing BART miRNAs, and this list of targets was also significantly enriched with down-regulated genes (Table 3). These data strongly suggest that a significant number of the changes identified by expression microarray in the AGS-infected cells are attributable to the expression of the BART miRNAs. Similar to the result observed with the PAR-CLIP dataset, the up-regulated genes on the array are significantly depleted for bioinformatically predicted miRNA targets (Table 3).
To determine if the changes observed at the mRNA level for these potential miRNA targets resulted in decreased protein levels, immunoblotting for several of the potentially interesting targets was performed. A majority of the targets examined had dramatic decreases in protein levels in the infected cells, including PTEN, caspase 3, STAT6, BCL3, FOXO3, IRF1, and integrins α5 and αV (Fig. 4 A and B). Many of these genes had significantly more down-regulation at the protein level than at the mRNA level (Fig. 4B and Dataset S1), which is consistent with these genes being miRNA targets. However, not all the tested genes were down-regulated at the protein level. Those not down-regulated included MCL1, STAT3, and cyclin D2 (Fig. 4 A and B), despite being statistically down-regulated on the microarrays and identified as miRNA targets in the PEL cell lines by PAR-CLIP. It is likely that the BART miRNAs may function differently depending on cell type and other variables or that these genes are under additional regulation that counteracts the inhibition of translation by the miRNAs. To determine if these miRNA targets are also affected in NPC, three NPC xenograft tumors passaged in mice with dramatically different BART miRNA expression were compared. High levels of the BART miRNAs are expressed in the C15 xenograft, whereas the C17 and C18 tumors have little to no BART miRNA expression (11). Many of the proteins tested were decreased in the C15 tumors, including FOXO3, caspase 3, and integrins α5 and αV (Fig. 4C).
Fig. 4.
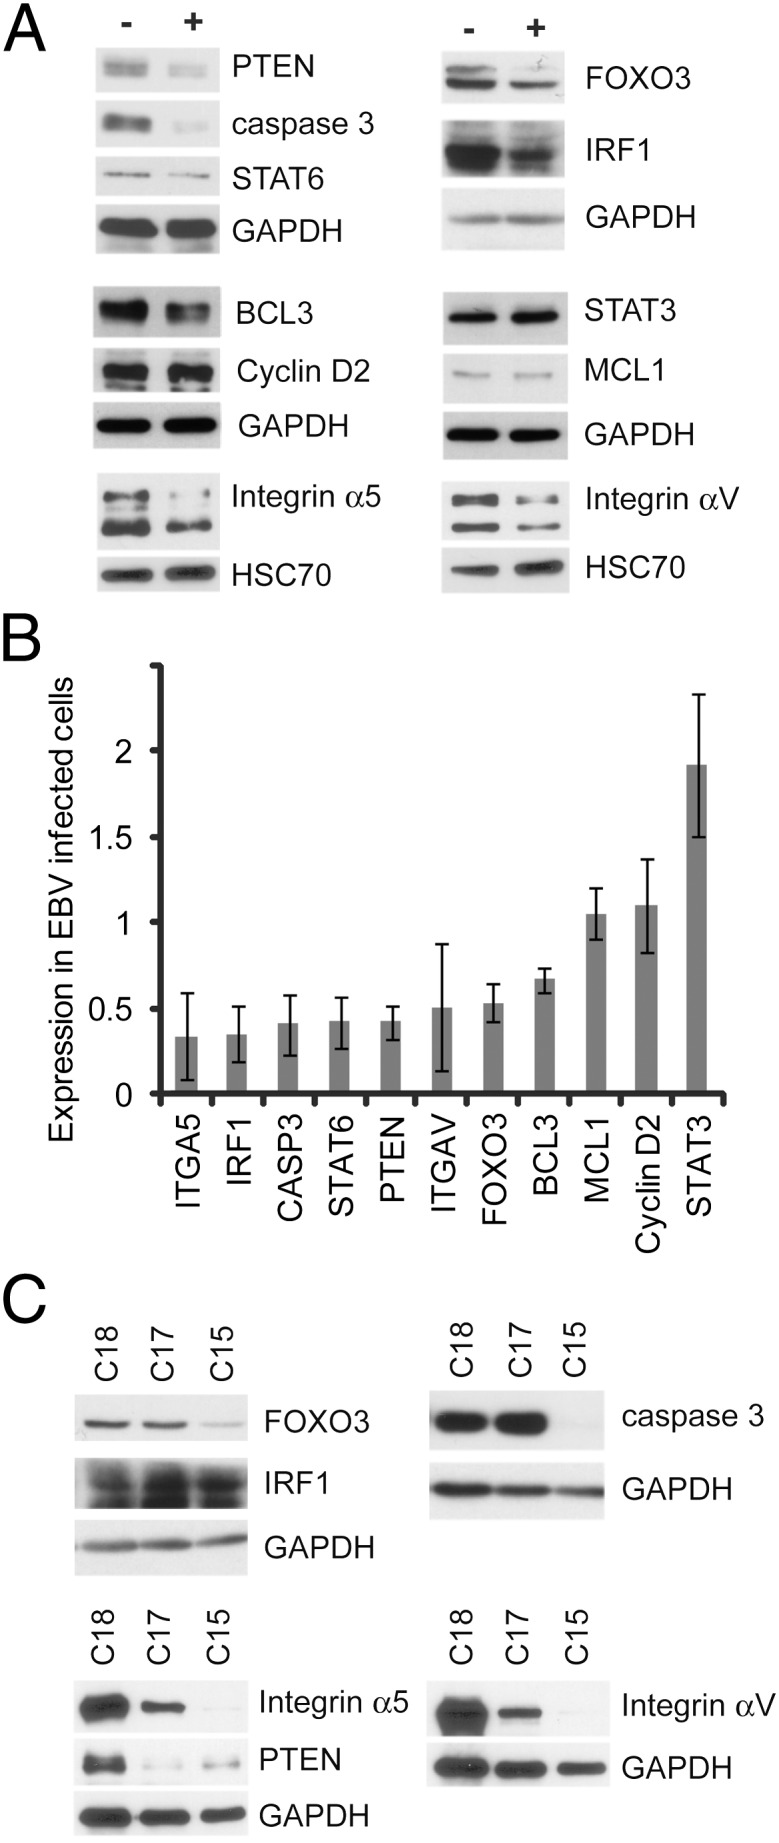
Analysis of select genes shown to be down-regulated by microarray. (A) Western blot analysis of a group of genes down-regulated by microarray and predicted to be BART miRNA targets. Expression in AGS cells infected with EBV (+) is compared with that in noninfected AGS cells (−). GAPDH and HSC70 serve as loading controls. (B) Densitometry quantification of immunoblots for the indicated proteins. The ratio of the signal in infected cells vs. uninfected cells normalized to the loading control and averaged between at least three independent experiments is indicated with error bars representing the SEM. (C) Expression of the down-regulated proteins in protein lysates prepared from the NPC xenografts C15 (BART miRNA-positive) and C17 and C18 (BART miRNA-negative). GAPDH serves as the loading control.
Discussion
Many studies have contributed to our understanding of the mechanisms by which EBV infection can immortalize B lymphocytes. However, much less is known about the effects on cellular expression that occur during epithelial cell infection, and EBV infection has not been shown to transform epithelial cells. In this study, the effects of EBV infection on epithelial growth properties were determined and the global changes in cellular expression were profiled. Strikingly, the EBV-infected cells exhibited anchorage independence, which is a major phenotype characteristic of transformation and malignancy. Additionally, there were many changes in the gene expression profile compared with uninfected cells, and the molecular functions of the altered genes were enriched for functions that would likely contribute to the altered growth of these cells.
Several lines of evidence suggest that a considerable number of the changes detected in the AGS cells on EBV infection are attributable to the expression of the BART miRNAs. First, there is very little latent protein expression in these cells other than, presumably, EBNA1, and inhibiting the small amount of LMP1 that is expressed in these cells did not affect the cells phenotypically or by microarray. Second, the majority of the significant changes in expression were down-regulation. Expression of miRNAs both inhibits translation and often results in a reduction in the mRNA levels. Secondary effects of miRNA action could also increase or decrease mRNA levels. Importantly, the genes that were down-regulated by microarray were enriched in both experimentally determined miRNA targets (PAR-CLIP dataset) and bioinformatically predicted targets from two different algorithms. These findings strongly suggest that the BART miRNAs substantially contribute to the expression profile of the AGS-EBV cells.
The microarray analysis indicates that few if any gene expression changes observed are attributable to LMP1 expression; however, other viral products expressed during this latency I-type infection could contribute to the observed changes. EBNA1 can significantly alter cellular gene expression (31). The noncoding EBER RNAs can induce IGF1 expression in GC (32), and secreted EBERs can active TLR3 signaling (33). Additionally, there is a significant level of lytic replication in these infected cells (34). It is therefore likely that some of the differences in gene expression, particularly of those genes whose expression has increased or decreased more than fourfold, reflects the expression of these viral genes. Although the overlap between the PAR-CLIP–defined BART miRNA targets and the genes down-regulated in the microarray is extremely significant, there are still many predicted targets that are not down-regulated at the mRNA level in the AGS cells. It is possible that many of these targets are not affected at the steady-state mRNA level. Additionally, many other factors likely influence the targetome of the BARTs in distinct cellular contexts. Differences in BART miRNA expression, target mRNA expression, or perhaps even expression of cellular or KSHV miRNAs are likely to be very different in the dually KSHV- and EBV-infected PEL cell line used in the PAR-CLIP study and the GC cell line used in this study. Additionally, in many cancers, there is widespread shortening of 3′ UTRs that could have dramatic effects on the ability of miRNAs to function on a range of targets (35).
This study shows that EBV infection of an epithelial cell line induces a transformed phenotype. The lack of expression of the EBV-transforming proteins EBNA2 and LMP2 and the very low levels of LMP1 suggest that the phenotype is attributable, in part, to the abundant BART miRNAs. Importantly, there is remarkable overlap between potential miRNA targets and the genes down-regulated on the expression arrays, with highly significant clustering in growth-altering pathways. These findings suggest that the BART miRNAs are likely contributors to the development of epithelial malignancies that are linked to EBV, including NPC and GC, where they are expressed at high levels. The ability to affect cell growth in the absence of viral protein expression would be particularly important to the development of EBV-associated cancers in immunocompetent individuals.
Materials and Methods
Cell Lines and Constructs.
The GC cell line AGS was grown in F-12 media (Gibco) with 10% (vol/vol) FBS and antibiotic/antimycotic reagent (Gibco). AGS-EBV cells were also maintained with 500 μg/mL G418 (Gibco) to select for retention of the EBV episome. Growth in soft agar was assessed by resuspending cells in 2 mL of media containing 0.5% bactoagar in a six-well plate. After agar solidified, an additional 4 mL of F-12 media was added to the top and the plate was allowed to grow for 12 d, changing the media every 2 d. The NPC xenograft tumors C15, C17, and C18 were serially passaged in nude mice and have been described previously (36).
The LMP1 DN construct contains mutations of amino acids 204–208 to A as well as Y348G (37). shLMP1-1 and shLMP1-2 plasmids express a hairpin RNA with a 19-mer stem, targeting sequences that have been successfully used to knock down LMP1 (38, 39). Complementary oligonucleotides (Dataset S2) were annealed and cloned into the BamHI/HindIII sites of pSilencer 5.1-U6 retro (Ambion). pScramble is a nonspecific shRNA sequence in the pSilencer 5.1 vector sold by Ambion as a negative control.
Western Blotting.
Protein lysates from cells and frozen C15, C17, and C18 tumors and Western blots were prepared as previously described (40, 41). The antibodies used are indicated in Dataset S3. Densitometry analysis was done with ImageJ software (National Institutes of Health).
Quantitative RT-PCR for miRNAs.
Total cellular RNA was prepared from cells using TRIzol reagent (Invitrogen) (11). Quantitative RT-PCR for the BART miRNAs was performed using the miScript system (Qiagen) (19). The relative abundance of each miRNA reported was obtained by normalizing the difference in cycle threshold (CT) between the AGS-EBV cells and the C666-1 for each BART miRNA to a control reaction that amplifies the small nuclear RNA U5 using the following formula: Relative Abundance = 2∧{(CT[C666 BART miRNA] − CT[AGS BART miRNA]) − (CT[C666 U5] − CT[AGS U5])}.
Microarray Analysis.
Total RNA was prepared using the RNeasy Plus Mini Kit (Qiagen) from independent cultures of cells that have been seeded at a density of 750,000 cells in a 10-cm dish and grown for 2 d in F12 media with 10% FBS without selection to 50–75% confluency at the time of harvest. RNA quality was confirmed using capillary electrophoresis (Bioanalyzer 2100; Agilent), amplified, and hybridized to an Agilent G3 Human GE 8×60K dual-color microarray by the University of North Carolina Lineberger Comprehensive Cancer Center Genomics and Bioinformatics Core Facility. Microarrays were scanned using an Axon 4200 Scanner (Molecular Devices), normalized using GenePix 5.0 software (Molecular Devices), and analyzed using the Partek Genomics Suite 6.5 software. ANOVA and t test analysis were performed using Genomics Suite 6.5 software with an FDR cutoff of P < 0.05. Clustering of the significantly changed gene set was also performed with Genomics Suite 6.5 software.
Molecular function enrichment analysis was performed using IPA software. A gene list of all the twofold significant changes was downloaded from Partek and uploaded into IPA for analysis. Enriched molecular functions were determined by running the core analysis considering only experimentally determined relationships. The miRNA target enrichment analysis was also aided by the IPA software. Gene lists were created for the entire microarray dataset as well as for those statistically down-regulated or up-regulated (P < 0.05) by any amount in the microarray. IPA was able to map 29,870, 7,612, and 7,288 genes from these datasets, suggesting that 25.5% of all IPA recognized genes were down-regulated and 24.4% were up-regulated to some degree. The compare analysis function of IPA was used to overlap the 7,612 and 7,288 genes with those genes targeted by EBV miRNA in the PEL PAR-CLIP data [downloaded from the supplementary data in the report by Gottwein et al. (28)] or from bioinformatically generated target lists from Targetscan or Diana-microT, algorithms which are available as online tools. The actual overlap in these gene sets was compared with the null hypothesis overlap (25.5% or 24.4% of each list) using a χ2 analysis.
Supplementary Material
Acknowledgments
We thank Lindsey Hutt-Fletcher for providing the AGS parental cell line cured of parainfluenza virus type 5 (PIV5) and establishing the EBV-infected derivative of the PIV5 negative cell line. A.R.M. was supported by Fellowship 5059-08 from the Leukemia and Lymphoma Society. This study was supported by Grant CA138811 from the National Institutes of Health (to N.R.-T.). This research was also funded in part by supplemental funding for HIV-associated malignancy research to the University of North Carolina (UNC) Lineberger Cancer Center and the UNC Center for AIDS Research.
Footnotes
The authors declare no conflict of interest.
This article is a PNAS Direct Submission.
Data deposition: The microarray data reported in this paper have been deposited in the Gene Expression Omnibus (GEO) database (accession no. GSE37753).
This article contains supporting information online at www.pnas.org/lookup/suppl/doi:10.1073/pnas.1202910109/-/DCSupplemental.
References
- 1.Rickinson AB, Kieff E. Epstein-Barr virus. In: Knipe DM, Howley PM, editors. Field’s Virology. 4th Ed. Philadelphia: Lippincott Williams & Wilkins; 2001. pp. 2575–2627. [Google Scholar]
- 2.Raab-Traub N. Epstein-Barr virus in the pathogenesis of NPC. Semin Cancer Biol. 2002;12:431–441. doi: 10.1016/s1044579x0200086x. [DOI] [PubMed] [Google Scholar]
- 3.Rowe M, et al. Differences in B cell growth phenotype reflect novel patterns of Epstein-Barr virus latent gene expression in Burkitt’s lymphoma cells. EMBO J. 1987;6:2743–2751. doi: 10.1002/j.1460-2075.1987.tb02568.x. [DOI] [PMC free article] [PubMed] [Google Scholar]
- 4.Lee HS, Chang MS, Yang HK, Lee BL, Kim WH. Epstein-barr virus-positive gastric carcinoma has a distinct protein expression profile in comparison with epstein-barr virus-negative carcinoma. Clin Cancer Res. 2004;10:1698–1705. doi: 10.1158/1078-0432.ccr-1122-3. [DOI] [PubMed] [Google Scholar]
- 5.Gilligan K, et al. Novel transcription from the Epstein-Barr virus terminal EcoRI fragment, DIJhet, in a nasopharyngeal carcinoma. J Virol. 1990;64:4948–4956. doi: 10.1128/jvi.64.10.4948-4956.1990. [DOI] [PMC free article] [PubMed] [Google Scholar]
- 6.Karran L, Gao Y, Smith PR, Griffin BE. Expression of a family of complementary-strand transcripts in Epstein-Barr virus-infected cells. Proc Natl Acad Sci USA. 1992;89:8058–8062. doi: 10.1073/pnas.89.17.8058. [DOI] [PMC free article] [PubMed] [Google Scholar]
- 7.Cai X, et al. Epstein-Barr virus microRNAs are evolutionarily conserved and differentially expressed. PLoS Pathog. 2006;2:e23. doi: 10.1371/journal.ppat.0020023. [DOI] [PMC free article] [PubMed] [Google Scholar]
- 8.Pfeffer S, et al. Identification of virus-encoded microRNAs. Science. 2004;304:734–736. doi: 10.1126/science.1096781. [DOI] [PubMed] [Google Scholar]
- 9.Zhu JY, et al. Identification of novel Epstein-Barr virus microRNA genes from nasopharyngeal carcinomas. J Virol. 2009;83:3333–3341. doi: 10.1128/JVI.01689-08. [DOI] [PMC free article] [PubMed] [Google Scholar]
- 10.Bartel DP. MicroRNAs: Genomics, biogenesis, mechanism, and function. Cell. 2004;116:281–297. doi: 10.1016/s0092-8674(04)00045-5. [DOI] [PubMed] [Google Scholar]
- 11.Edwards RH, Marquitz AR, Raab-Traub N. Epstein-Barr virus BART microRNAs are produced from a large intron prior to splicing. J Virol. 2008;82:9094–9106. doi: 10.1128/JVI.00785-08. [DOI] [PMC free article] [PubMed] [Google Scholar]
- 12.Kim N, et al. Expression of viral microRNAs in Epstein-Barr virus-associated gastric carcinoma. J Virol. 2007;81:1033–1036. doi: 10.1128/JVI.02271-06. [DOI] [PMC free article] [PubMed] [Google Scholar]
- 13.Chen SJ, et al. Characterization of Epstein-Barr virus miRNAome in nasopharyngeal carcinoma by deep sequencing. PLoS ONE. 2010;5:e12745. doi: 10.1371/journal.pone.0012745. [DOI] [PMC free article] [PubMed] [Google Scholar]
- 14.Raab-Traub N, Dambaugh T, Kieff E. DNA of Epstein-Barr virus VIII: B95-8, the previous prototype, is an unusual deletion derivative. Cell. 1980;22:257–267. doi: 10.1016/0092-8674(80)90173-7. [DOI] [PubMed] [Google Scholar]
- 15.Feederle R, et al. The members of an Epstein-Barr virus microRNA cluster cooperate to transform B lymphocytes. J Virol. 2011;85:9801–9810. doi: 10.1128/JVI.05100-11. [DOI] [PMC free article] [PubMed] [Google Scholar]
- 16.Seto E, et al. Micro RNAs of Epstein-Barr virus promote cell cycle progression and prevent apoptosis of primary human B cells. PLoS Pathog. 2010;6:e1001063. doi: 10.1371/journal.ppat.1001063. [DOI] [PMC free article] [PubMed] [Google Scholar]
- 17.Choy EY, et al. An Epstein-Barr virus-encoded microRNA targets PUMA to promote host cell survival. J Exp Med. 2008;205:2551–2560. doi: 10.1084/jem.20072581. [DOI] [PMC free article] [PubMed] [Google Scholar]
- 18.Dölken L, et al. Systematic analysis of viral and cellular microRNA targets in cells latently infected with human gamma-herpesviruses by RISC immunoprecipitation assay. Cell Host Microbe. 2010;7:324–334. doi: 10.1016/j.chom.2010.03.008. [DOI] [PubMed] [Google Scholar]
- 19.Marquitz AR, Mathur A, Nam CS, Raab-Traub N. The Epstein-Barr Virus BART microRNAs target the pro-apoptotic protein Bim. Virology. 2011;412:392–400. doi: 10.1016/j.virol.2011.01.028. [DOI] [PMC free article] [PubMed] [Google Scholar]
- 20.Wong AM, Kong KL, Tsang JW, Kwong DL, Guan XY. Profiling of Epstein-Barr virus-encoded microRNAs in nasopharyngeal carcinoma reveals potential biomarkers and oncomirs. Cancer. 2012;118:698–710. doi: 10.1002/cncr.26309. [DOI] [PubMed] [Google Scholar]
- 21.Molesworth SJ, Lake CM, Borza CM, Turk SM, Hutt-Fletcher LM. Epstein-Barr virus gH is essential for penetration of B cells but also plays a role in attachment of virus to epithelial cells. J Virol. 2000;74:6324–6332. doi: 10.1128/jvi.74.14.6324-6332.2000. [DOI] [PMC free article] [PubMed] [Google Scholar]
- 22.Kaye KM, Izumi KM, Kieff E. Epstein-Barr virus latent membrane protein 1 is essential for B-lymphocyte growth transformation. Proc Natl Acad Sci USA. 1993;90:9150–9154. doi: 10.1073/pnas.90.19.9150. [DOI] [PMC free article] [PubMed] [Google Scholar]
- 23.Wang D, Liebowitz D, Kieff E. An EBV membrane protein expressed in immortalized lymphocytes transforms established rodent cells. Cell. 1985;43:831–840. doi: 10.1016/0092-8674(85)90256-9. [DOI] [PubMed] [Google Scholar]
- 24.Brennan P, Floettmann JE, Mehl A, Jones M, Rowe M. Mechanism of action of a novel latent membrane protein-1 dominant negative. J Biol Chem. 2001;276:1195–1203. doi: 10.1074/jbc.M005461200. [DOI] [PubMed] [Google Scholar]
- 25.Kassis J, et al. EBV-expressing AGS gastric carcinoma cell sublines present increased motility and invasiveness. Int J Cancer. 2002;99:644–651. doi: 10.1002/ijc.10382. [DOI] [PubMed] [Google Scholar]
- 26.Sivachandran N, et al. Contributions of the Epstein-Barr virus EBNA1 protein to gastric carcinoma. J Virol. 2012;86:60–68. doi: 10.1128/JVI.05623-11. [DOI] [PMC free article] [PubMed] [Google Scholar]
- 27.Baek D, et al. The impact of microRNAs on protein output. Nature. 2008;455:64–71. doi: 10.1038/nature07242. [DOI] [PMC free article] [PubMed] [Google Scholar]
- 28.Gottwein E, et al. Viral microRNA targetome of KSHV-infected primary effusion lymphoma cell lines. Cell Host Microbe. 2011;10:515–526. doi: 10.1016/j.chom.2011.09.012. [DOI] [PMC free article] [PubMed] [Google Scholar]
- 29.Lewis BP, Burge CB, Bartel DP. Conserved seed pairing, often flanked by adenosines, indicates that thousands of human genes are microRNA targets. Cell. 2005;120:15–20. doi: 10.1016/j.cell.2004.12.035. [DOI] [PubMed] [Google Scholar]
- 30.Maragkakis M, et al. DIANA-microT web server: Elucidating microRNA functions through target prediction. Nucleic Acids Res. 2009;37(Web Server issue):W273–W276. doi: 10.1093/nar/gkp292. [DOI] [PMC free article] [PubMed] [Google Scholar]
- 31.Wood VH, et al. Epstein-Barr virus-encoded EBNA1 regulates cellular gene transcription and modulates the STAT1 and TGFbeta signaling pathways. Oncogene. 2007;26:4135–4147. doi: 10.1038/sj.onc.1210496. [DOI] [PubMed] [Google Scholar]
- 32.Iwakiri D, Eizuru Y, Tokunaga M, Takada K. Autocrine growth of Epstein-Barr virus-positive gastric carcinoma cells mediated by an Epstein-Barr virus-encoded small RNA. Cancer Res. 2003;63:7062–7067. [PubMed] [Google Scholar]
- 33.Iwakiri D, et al. Epstein-Barr virus (EBV)-encoded small RNA is released from EBV-infected cells and activates signaling from Toll-like receptor 3. J Exp Med. 2009;206:2091–2099. doi: 10.1084/jem.20081761. [DOI] [PMC free article] [PubMed] [Google Scholar]
- 34.Feng WH, et al. ZEB1 and c-Jun levels contribute to the establishment of highly lytic Epstein-Barr virus infection in gastric AGS cells. J Virol. 2007;81:10113–10122. doi: 10.1128/JVI.00692-07. [DOI] [PMC free article] [PubMed] [Google Scholar]
- 35.Mayr C, Bartel DP. Widespread shortening of 3′UTRs by alternative cleavage and polyadenylation activates oncogenes in cancer cells. Cell. 2009;138:673–684. doi: 10.1016/j.cell.2009.06.016. [DOI] [PMC free article] [PubMed] [Google Scholar]
- 36.Busson P, et al. Establishment and characterization of three transplantable EBV-containing nasopharyngeal carcinomas. Int J Cancer. 1988;42:599–606. doi: 10.1002/ijc.2910420422. [DOI] [PubMed] [Google Scholar]
- 37.Mainou BA, Everly DN, Jr, Raab-Traub N. Unique signaling properties of CTAR1 in LMP1-mediated transformation. J Virol. 2007;81:9680–9692. doi: 10.1128/JVI.01001-07. [DOI] [PMC free article] [PubMed] [Google Scholar]
- 38.Li XP, Li G, Peng Y, Kung HF, Lin MC. Suppression of Epstein-Barr virus-encoded latent membrane protein-1 by RNA interference inhibits the metastatic potential of nasopharyngeal carcinoma cells. Biochem Biophys Res Commun. 2004;315:212–218. doi: 10.1016/j.bbrc.2004.01.045. [DOI] [PubMed] [Google Scholar]
- 39.Mei YP, et al. Silencing of LMP1 induces cell cycle arrest and enhances chemosensitivity through inhibition of AKT signaling pathway in EBV-positive nasopharyngeal carcinoma cells. Cell Cycle. 2007;6:1379–1385. doi: 10.4161/cc.6.11.4274. [DOI] [PubMed] [Google Scholar]
- 40.Mainou BA, Everly DN, Jr, Raab-Traub N. Epstein-Barr virus latent membrane protein 1 CTAR1 mediates rodent and human fibroblast transformation through activation of PI3K. Oncogene. 2005;24:6917–6924. doi: 10.1038/sj.onc.1208846. [DOI] [PubMed] [Google Scholar]
- 41.Thornburg NJ, Pathmanathan R, Raab-Traub N. Activation of nuclear factor-kappaB p50 homodimer/Bcl-3 complexes in nasopharyngeal carcinoma. Cancer Res. 2003;63:8293–8301. [PubMed] [Google Scholar]
Associated Data
This section collects any data citations, data availability statements, or supplementary materials included in this article.