Abstract
Virtual ligand screening uses computation to discover new ligands of a protein by screening one or more of its structural models against a database of potential ligands. Comparative protein structure modeling extends the applicability of virtual screening beyond the atomic structures determined by X-ray crystallography or NMR spectroscopy. Here, we describe an integrated modeling and docking protocol, combining comparative modeling by MODELLER and virtual ligand screening by DOCK.
Keywords: comparative modeling, virtual screening, ligand docking
1. Introduction
Structure-based methods have been widely used in the design and discovery of protein ligands (1–4). Given the structure of a binding site on a receptor protein, its ligands can be predicted among a large library of small molecules by virtual screening (1, 5–11): Each library molecule is docked into the binding site, then scored and ranked by a scoring function. High-ranking molecules can be selected for testing in the laboratory. Virtual screening methods can significantly reduce the number of compounds to be tested, thus increasing the efficiency of ligand discovery (12–16).
Many protein structures are relatively flexible, and can adopt different conformations when binding to different ligands. Docking a ligand to a protein structure with current methods is most likely to be successful when the shape of the binding site resembles that found in the protein-ligand complex. Therefore, the protein structure for docking is best determined in complex with a ligand that is similar to the ligand being docked, by X-ray crystallography or NMR spectroscopy. Induced fit and differences between protein conformations bound to different ligands limit the utility of the unbound (apo) structure and even complex (holo) structures obtained for dissimilar ligands. The problem of the protein conformational heterogeneity is especially difficult to surmount in virtual screening, which involves docking of many different ligands, each one of which may in principle bind to a different protein conformation (17).
An even greater challenge is that many interesting receptors have no experimentally determined structures at all, especially in the early phases of ligand discovery. During the last seven years, the number of experimentally determined protein structures deposited in the Protein Data Bank (PDB) increased from 23,096 to 67,421 (November 2010) (18). In contrast, over the same period, the number of sequences in the Universal Protein Resource (UniProt) increased from 1.2 million to 12.8 million (19). This rapidly growing gap between the sequence and structure databases can be bridged by protein structure prediction (20), including comparative modeling, threading, and de novo methods. Comparative protein structure modeling constructs a three-dimensional model of a given target protein sequence based on its similarity to one or more known structures (templates). Despite progress in de novo prediction (21, 22), comparative modeling remains the most reliable method that can sometimes predict the structure of a protein with accuracy comparable to a low-resolution, experimentally determined structure (23).
Comparative modeling benefits from structural genomics (24). In particular, the Protein Structure Initiative (PSI) aims to determine representative atomic structures of most major protein families by X-ray crystallography or NMR spectroscopy, so that most of the remaining protein sequences can be characterized by comparative modeling (http://www.nigms.nih.gov/Initiatives/PSI/) (25, 26). Currently, the fraction of sequences in a genome for whose domains comparative models can be obtained varies from approximately 20% to 75%, increasing the number of structurally characterized protein sequences by two orders of magnitude relative to the entries in the PDB (27). Therefore, comparative models in principle greatly extend the applicability of virtual screening, compared to using only the experimentally determined structures (28).
Comparative models have in fact been used in virtual screening to detect novel ligands for many protein targets,(28) including G-protein coupled receptors (GPCR) (29–41), protein kinases (42–45), nuclear hormone receptors, and a number of different enzymes (14, 15, 46–57). The relative utility of comparative models versus experimentally determined structures has been assessed (17, 29, 42, 43, 58–60). Although the X-ray structure of a ligand-bound target often provides the highest enrichment for known ligands, comparative models yield better enrichment than random selection and sometimes performs comparably to the holo X-ray structure. Recently, we assessed our automated modeling and docking pipeline (17) based on MODELLER (61) for comparative modeling and DOCK (62, 63) for virtual screening. We demonstrated that when multiple target models are calculated, each one based on a different template, the “consensus” enrichment for multiple models is better or comparable to the enrichment for the apo and holo X-ray structures in 70% and 47% cases, respectively; the consensus enrichment is calculated by combining the docking results of multiple structures — for each docked compound, the best docking score across all structures was used for ranking the compound — thus, the ranking relied on optimizing the protein conformation as well as protein-ligand complementarity. Another similar criterion for ligand ranking was also described (64).
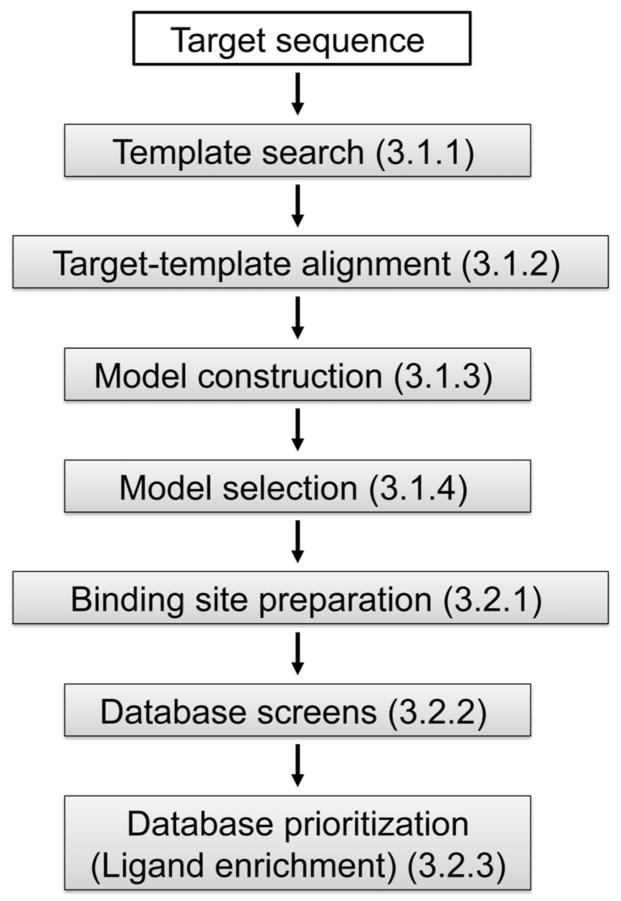
The modeling and docking protocol is carried out in 7 sequential steps (Figure 1). Steps 1–4 correspond to comparative modeling: (1) template search finds known structures (templates) related to the sequence to be modeled (target), (2) target-template alignment aligns the target sequence with the templates, (3) model construction computes multiple target models based on the input alignment, (4) model selection identifies the best-scoring model. Steps 5–7 correspond to virtual screening: (5) binding site preparation involves creating input files for generating spheres and scoring grids used in docking, (6) database screening docks database molecules into the binding site, and (7) database prioritization scores and ranks the docking poses of the database molecules. Comparative modeling is carried out by program MODELLER that implements comparative modeling by satisfaction of spatial restraints derived from the target-template alignment, atomic statistical potentials, and the CHARMM molecular mechanics force field (61). The spatial restraints are combined into an objective function that is optimized by a combination of conjugate gradients and molecular dynamics with simulated annealing; this model-building procedure is formally similar to structure determination by NMR spectroscopy. Virtual screening is performed by the DOCK suite of programs (63, 65, 66). DOCK uses a negative image of the receptor — spheres that fill the receptor site — to describe the space into which docked molecules should fit. Docking poses are generated by matching the atoms of a small molecule with the centers of the spheres. The generated poses are evaluated using a grid-based approach in which interactions between the docked molecules and the receptor are precomputed at each grid point.
Figure 1.
The automated modeling and docking pipeline. Numbers in parentheses indicate the corresponding section in the text.
2. Materials
2.1. Software for Comparative Modeling
2.1.1
The MODELLER 9v8 program can be downloaded from http://salilab.org/modeller/.
2.1.2
A typical operation in MODELLER consists of (1) preparing an input Python script, (2) ensuring that all required files (eg, files specifying sequences, structures, alignments) exist, (3) executing the input script by typing ’mod9v8 input-script-name’, and (4) analyzing the output and log files. A tutorial for the use of MODELLER 9v4 or newer is available at http://salilab.org/modeller/tutorial/.
2.2. Database for Comparative Modeling
2.2.1
Sequence database (UniProt90) contains all sequences from UniProt (clustered at 90% to remove redundancy), and can be downloaded from http://salilab.org/modeller/supplemental.html.
2.2.2
Template sequence database (pdball) contains the sequence for each protein structure in PDB, and can be downloaded from http://salilab.org/modeller/supplemental.html.
2.3. Software for Virtual Screening
2.3.1
DOCK 3.5.54 (62, 63) is available under the UCSF DOCK license http://dock.compbio.ucsf.edu/Online_Licensing/dock_license_application.html (Note 4.1). Documentation for DOCK 3.5 is provided at http://wiki.bkslab.org/index.php/Image:Dock3_5refman.pdf.
2.3.2
Third party applications.
2.3.2.1
DMS is a program that calculates the solvent-accessible molecular surface of the protein binding site (67), and can be downloaded at http://www.cgl.ucsf.edu/Overview/ftp/dms.shar.
2.3.2.2
SYBYL is a commercial molecular modeling program that can build and manipulate molecules.(68) In our study, SYBYL is used to add hydrogen atoms to polar atoms in a protein receptor (in the PDB format) that contains only non-hydrogen atoms; it can be downloaded from http://tripos.com/index.php?family=modules,General.DownloadPortal,Home.
2.3.2.3
Delphi is a program that computes numerical solutions of the Poisson-Boltzmann equation for molecules of arbitrary shape and charge distribution (69); a request for access to this program can be made at http://luna.bioc.columbia.edu/honiglab/software/cgi-bin/software.pl?input=DelPhi.
2.4. Docking Database of Small Molecules
2.4.1
The Directory of Universal Decoys (DUD) is a docking database designed to help test docking algorithms by providing challenging decoys (70). DUD contains a total of 2,950 compounds that bind to a total of 40 targets; in addition, for each ligand, it also contains 36 "decoys" with similar physical properties (eg, molecular weight, calculated LogP) but dissimilar chemical topology. DUD can be downloaded from http://dud.docking.org/r2/.
3. Method
The automated modeling and docking pipeline will be illustrated with one example taken from our benchmark study (17), adenosine deaminase (ADA, EC 3.5.4.4). ADA is a metalloenzyme in whose binding pocket one catalytic zinc ion is coordinated by three histidine residues and one aspartic acid residue (71, 72). The bovine ADA has been co-crystalized with a non-nucleoside inhibitor (PDB code 1NDW). The DUD database was screened against comparative models and the ligand-bound (holo) crystal structure of the bovine ADA, to compare the utility of comparative models and holo crystal structures for virtual screening.
3.1. Comparative Modeling of Protein Structures
3.1.1. Template search
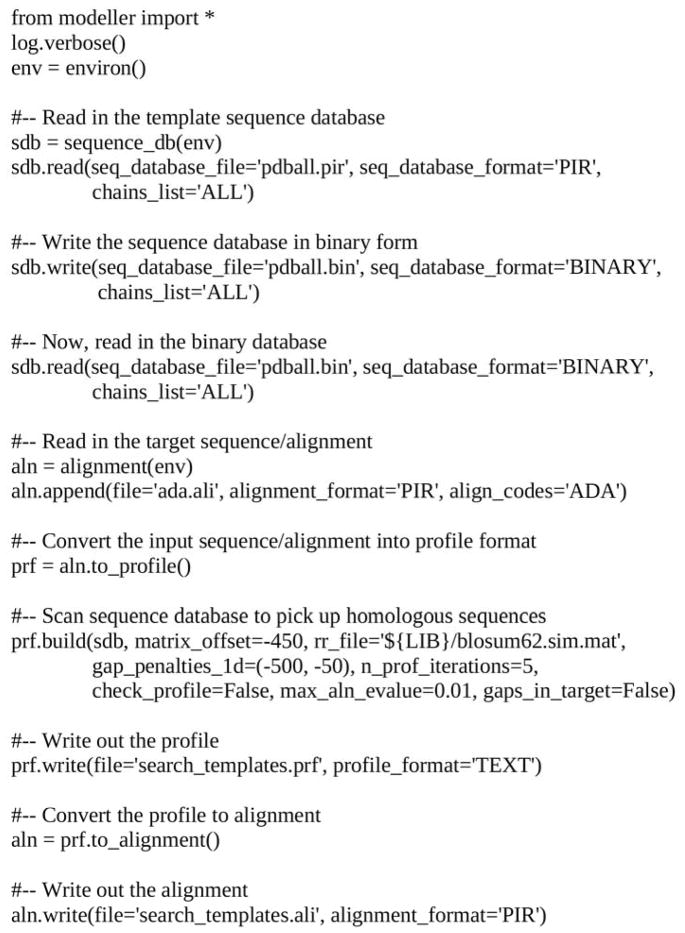
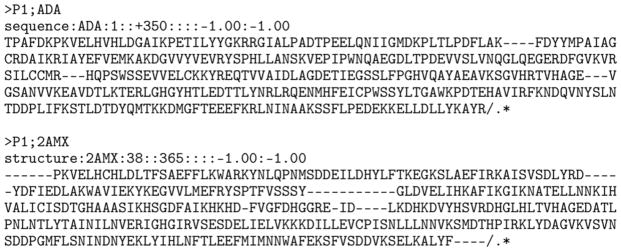
First, a file with the bovine ADA sequence in the MODELLER “PIR” format is prepared (Figure 2; Note 4.2). Then the ADA sequence is scanned against all sequences in the PDB (stored in file “pdball”) to identify suitable templates, with the MODELLER “profile.build” routine (Figure 3; Note 4.3). In this example, one holo structure (PDB code 1UIO) (73) with 85% sequence identity to the target and one apo structure (PDB code 2AMX) (74) with 27% sequence identity are selected as templates (Note 4.4), to be used independently for calculating two models of ADA.
Figure 2.
File “ADA.ali” in the “PIR” format. This file specifies the target sequence. See the MODELLER manual for the detailed description of the format.
Figure 3.
File “search_templates.py”. This script searches for potential template structures in a database of non-redundant PDB sequences.
3.1.2. Target-template alignment
For each target-template pair (ie, ADA-1UIO and ADA-2AMX), the target and template sequences are scanned against all sequences in UniProt90 independently with the “profile.build” routine, resulting in the target profile and the template profile, respectively. Next, the target profile is aligned against the template profile with the “profile.scan” routine (a sample script is given at http://salilab.org/modeller/examples/commands/ppscan.py). The resulting alignment is presented in Figure 4, for the 2AMX template (Note 4.5; the ADA-1UIO alignment is not shown).
Figure 4.
File “align.ali” in the “PIR” format. The file specifies the alignment between the sequences of ADA and 2AMX (A chain).
3.1.3 Model construction
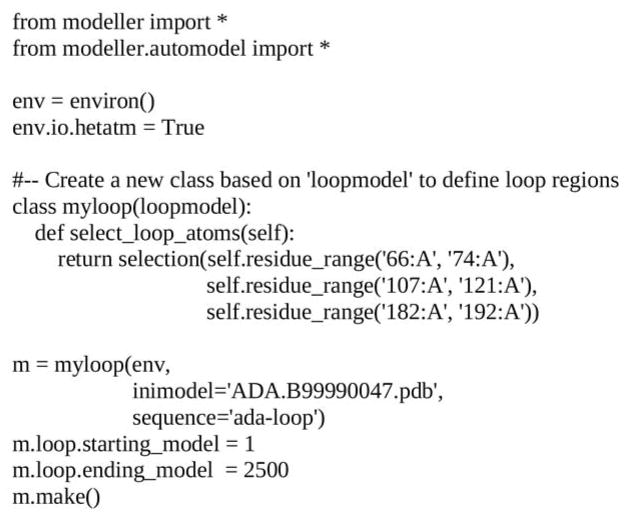
Once the target-template alignment is generated, MODELLER calculates 500 models of the target completely automatically, using its “automodel” routine (Figure 5; Note 4.6). The best model (defined in 3.1.4. Model selection) is then subjected to a refinement of binding site loops (Note 4.7) with the “loopmodel” routine (Figure 6). All three binding site loops were optimized simultaneously, resulting in 2500 conformations of ADA (Note 4.8).
Figure 5.
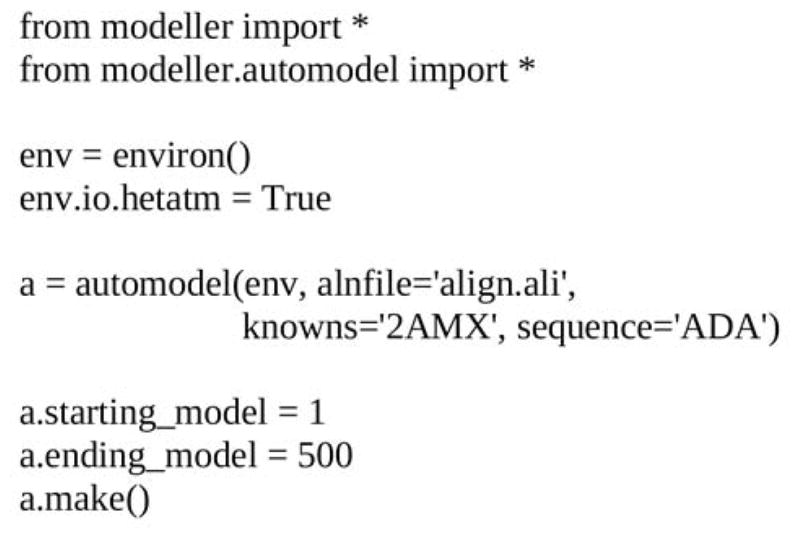
File “build_model.py”. The script generates 500 models of ADA based on 2AMX with “automodel” routine.
Figure 6.
File “loop_model.py”. Input script file that generates 2500 models with the “loopmodel” routine.
3.1.4. Model selection
When multiple models are calculated for the target based on a single template (by “automodel”, and “loopmodel”, if there are binding site loops), it is practical to select the model or a subset of models that are judged to be most suitable for subsequent docking calculations (Note 4.9). In this example, for each template, we select the model with optimized loops that has the lowest value of the MODELLER objective function (ada-loop.BL16340001.pdb for 2AMX), which is reported in the second line of the model file (Note 4.10). The most suitable model can also be selected by the Discrete Optimized Protein Energy (DOPE) (75), which is calculated using the “assess_dope” routine (Note 4.11).
3.2. Virtual Screening Against Comparative Models
As described in the previous section, a single comparative model of bovine ADA is selected from models calculated based on the 2AMX template. Another model is selected from models based on the 1UIO template. The DUD database is then screened against each of the two models independently. We will only describe the docking to the ADA model based on 2AMX.
3.2.1. Binding site preparation
3.2.1.1. Prepare input files for the automated docking pipeline
The file containing the ADA model based on 2AMX is renamed to “rec.pdb”, followed by (1) removing all lines that do not contain coordinates of non-hydrogen atoms; (2) replacing “HETATM” in the line containing the coordinates of the zinc ion by “ATOM”; and (3) removing all chain identifiers (Note 4.12). Next, the file “xtal-lig.pdb” is created, containing the binding site specification in the same format as that of “rec.pdb”. In this example, the ligand observed in the holo crystal structure of the target is given in “xtal-lig.pdb”; this ligand is transferred into the model by superposing the crystal structure on the model using the binding site residues (Note 4.13).
3.2.1.2. Automated spheres and scoring grids generation
First, the environment variable “DOCK_BASE” is defined to be the “dockenv” directory of the DOCK 3.5.54 installation. Second, file “Makefile” from “dockenv/scripts/” is copied to the current working directory, which also contains the “rec.pdb” and “xtal-lig.pdb” files. Third, file “.useligsph” is generated. Finally, command “make” is executed to generate the spheres and scoring grids (Note 4.14).
3.2.2. Database screening
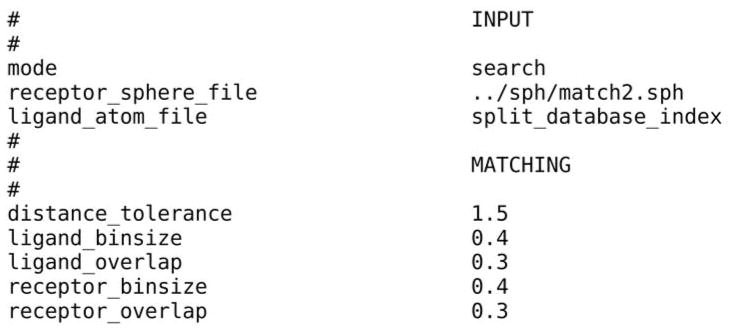
The DUD database contains 2950 annotated ligands and 95,316 decoys for 40 diverse targets (70); the DUD database is stored in 801 DOCK 3.5 hierarchy database files (DUD 2006 version) (63). 801 sub-directories corresponding to the 801 hierarchy database files are created. In each sub-directory, two files are required for docking. One is file “INDOCK” that contains the input parameters for DOCK 3.5.54 (Figure 7) (Note 4.15). Another file, “split_database_index”, contains the location and name of the corresponding database file. In file “INDOCK”, “split_database_index” is given as the value for the parameter with the keyword “ligand_atom_file”. Docking is performed by running the DOCK executable “dockenv/bin/Linux/dock” in each sub-directory. Two output files are produced: (1) the compressed file “test.eel1.gz” contains the docking poses of database molecules in the extended PDB format and (2) the compressed file “OUTDOCK.gz” contains the docking scores for the database molecules as well as the input file names and parameter values.
Figure 7.
A section of file “INDOCK” containing some input parameters for DOCK 3.5.54.
3.2.3. Database prioritization
First, the conformations of database molecules are filtered for steric complementarity using the DOCK contact score. The conformations that do not clash with the receptor are then scored by the DOCK energy function (the DOCK contact score is not included):
| (1) |
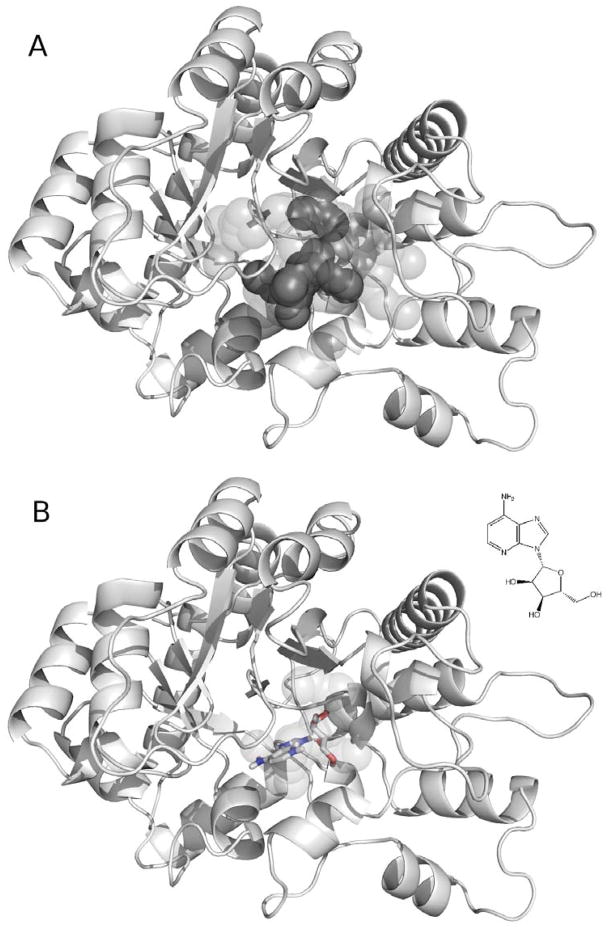
where EvdW is the van der Waals component of the receptor-ligand interaction energy based on the AMBER united-atom force field, Eelec is the electrostatic potential calculated by DelPhi, is the ligand desolvation penalty computed by solvmap, as described in Section and 3.2.2. For each ligand conformation, the total energy and all the individual energy terms are written out to file “OUTDOCK” (Figure 8; Note 4.16). The single conformation with the best total energy is saved in file “test.eel1” as the docking pose of the database molecule. The docking pose of one ADA ligand – 1-deazaadenosine (PubChem ID: 159738, ZINC ID: C03814313) – is shown in Figure 11B. After the virtual screening, the best total energy of each database molecule and the corresponding molecule ID are extracted from the “OUTDOCK” files in all sub-directories. The molecules in the docking database are ranked by their total energies. The top 500 ranked molecules are then inspected visually. Molecules forming favorable interactions with the receptor (eg, a docking pose is similar to the binding mode found in crystal structures of proteins in the same family) can be chosen for subsequent experimental testing.
Figure 8.
A section of file “OUTDOCK” containing docking scores of two DUD molecules.
Figure 11.
(A) The matching spheres (dark grey) and DelPhi spheres (light grey) generated for the binding site of the ADA model (cartoon) based on 2AMX. (B) The docking pose (stick) and the 2D structure of one ADA ligand – 1-deazaadenosine (PubChem ID: 159738, ZINC ID: C03814313) – as well as the matching spheres (light grey)
In this benchmark example, we can quantify the accuracy of modeling and docking by computing the enrichment for the known ADA ligands among the top scoring ligands:
| (2) |
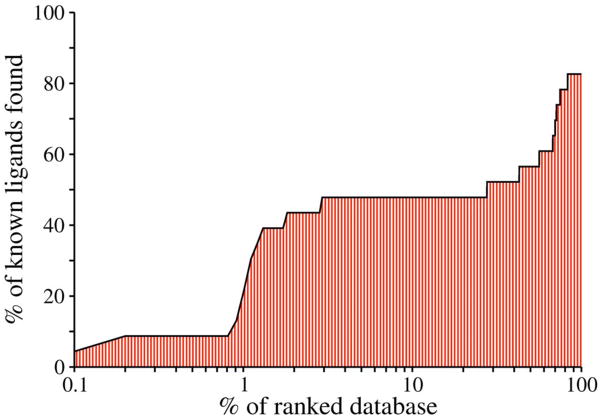
where ligandtotal is the number of known ligands in a database containing Ntotal compounds and ligandselected is the number of ligands found in a given subset of Nsubset compounds. EFsubset reflects the ability of virtual screening to find true positives among the decoys in the database compared to a random selection. An enrichment curve is obtained by plotting the percentage of actual ligands found (y-axis) within the top ranked subset of all database compounds (x-axis on logarithmic scale). To measure the enrichment independently of the arbitrary value of Nsubset, we also calculated the area under the curve (logAUC) of the enrichment plot:
| (3) |
where λ is arbitrarily set to 0.1. A random selection (ligandselected/ligandtotal = Nsubset/Ntotal) of compounds from the mixture of true positives and decoys yields a logAUC of 14.5. A mediocre selection that picks twice as many ligands at any Nsubset as a random selection has logAUC of 24.5 (ligandselected/ligandtotal = 2 * Nsubset/Ntotal; Nsubset/Ntotal ≤ 0.5). A highly accurate enrichment that produces ten times as many ligands than the random selection has logAUC of 47.7 (ligandselected/ligandtotal = 10 * Nsubset/Ntotal; Nsubset/Ntotal ≤ 0.1). In this example, the ADA model based on 2AMX yielded the logAUC of 40.3 (Figure 9). When multiple structures are available (either models or experimental structures), consensus enrichment can be calculated (Introduction).
Figure 9.
The enrichment curve for virtual screening of the DUD database against the ADA model based on 2AMX. The ligand enrichment is quantified by the logAUC of 40.3.
Figure 10.
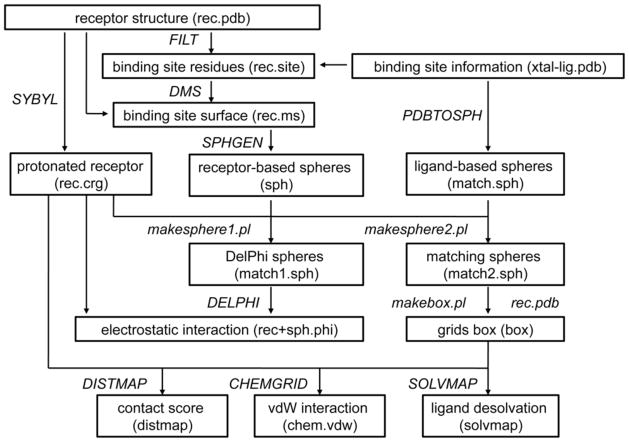
Schematic description of the automated preparation of receptor binding site, including sphere and scoring grids generation.
Acknowledgments
This article is partially based on the MODELLER manual, the DOCK 3.5 manual, and the “DISI” wiki pages (http://wiki.bkslab.org). We also acknowledge funds from Sandler Family Supporting Foundation and National Institutes of Health (R01 GM54762 to AS; R01 GM71896 to BKS and JJI; P01 GM71790 and U54 GM71790 to AS and BKS). We are also grateful to Ron Conway, Mike Homer, Hewlett-Packard, IBM, NetApp, and Intel for hardware gifts.
Footnotes
The DOCK 3.5.54 source distribution contains four items: the “dock”, the “dockenv” and the “test” directories, as well as the “README” file. The DOCK source code and executable are in the “dock” directory. Scripts used in the automated docking pipeline are in the “dockenv” directory. The binary executable “dock” in “dockenv/bin/Linux/” is used in the docking calculations.
The target protein sometimes contains modified residues, such as carboxylated lysine (KCX) and selenomethionine (MSE). These modified residues need to be replaced by standard residues with similar physical and chemical properties (eg, KCX by glutamic acid and MSE by methionine).
MODELLER script for template search
4.3.1. The environ routine initializes the environment for the modeling run, by creating a new environment object, called env. Almost all MODELLER scripts require this step, because the new environment object is needed to build most other useful objects.
4.3.2. The sequence_db routine creates a sequence database object sdb that is used to contain large databases of protein sequences.
4.3.3. The sdb.read and sdb.write routines read and write a database of sequences, respectively, in the PIR, FASTA, or BINARY format.
4.3.4. The second call to the sdb.read routine reads the binary format file for faster execution.
4.3.5. The alignment(env) routine creates a new “alignment” object (aln). The aln.append routine reads the target sequence ADA from the file ada.ali, and converts it to a profile object (prf).
4.3.6. The prf.build routine scans the target profile (prf) against the sequence database (sdb). Matching sequences from the database are added to the profile.
In general, a sequence identity value above ~25% indicates a potential template, unless the alignment is too short (ie, < 100 residues). A better measure of the alignment significance is the E-value of the alignment (the lower E-value, the better; a conservative cut-off is 0.001). Besides the sequence similarity, template structures can also be chosen on the basis of other criteria, such as the accuracy of the structures (eg, resolution of X-ray structures), conservation of active-site residues, and presence of bound ligands.
Different alignment methods vary in terms of the scoring function that is being optimized. When the target-template sequence identity is above 30–40%, different methods tend to produce very similar alignments. When similarity decreases, different methods tend to produce widely varying alignments. An accurate alignment is indicated when different methods, such as MUSCLE (76), CLUSTALW (77) and T-coffee (78), produce similar alignments.
Model building with the “automodel” routine
4.6.1. In the input script build_model.py (Figure 5), an automodel object is first created, specifying the alignment file (“align.ali”), the target (ADA), and the template (2AMX). The models are calculated by the “make” routine. 500 models for ADA are written out in the PDB format to files called ADA.B9990[0001-0500].pdb.
4.6.2. Ligands, ions, and cofactors in the template structures are copied to the target models and treated as rigid bodies, using the “BLK” functionality of MODELLER.
4.6.3. Models are computed by optimizing the MODELLER objective function in the Cartesian space. The optimization begins by the variable target function approach, deploying the conjugate gradients method, followed by a refinement by molecular dynamics with simulated annealing. The default optimization protocol can be adjusted (a sample script is given at http://salilab.org/modeller/examples/automodel/model-changeopt.py).
The binding site loops are defined as those binding site residues in the vicinity of the binding site that were not aligned to the template structure. The binding site residues may be chosen based on the prior experimental information (eg, mutagenesis data) and/or sequence conservation within a family of homologous proteins. In this study, binding site residues are defined as the residues with more than one non-hydrogen atom within 10 Å of any ligand atom in the target structure. Thus, three insertions in the ADA-2AMX alignment are defined as binding site loops (neighboring residues within 2 positions of each insertions are also included) (Figure 4).
Loop optimization with the “loopmodel” routine
4.8.1. In the input script “loop_model.py” (Figure 6), the best-scoring model generated by “automodel” (ADA.B99990047.pdb) is used as the starting conformation, thus defining the loop environment. Loop regions defined by the “select_loop_atoms” routine are randomized, followed by optimization with a combination of conjugate gradients and molecular dynamics with simulated annealing. 2500 models are written out in the PDB format to files called ada-loop.BL[0001-2500]0001.pdb.
4.8.2. Calculating multiple loop models allows for better conformational sampling of the unaligned regions. Typically, for a single 8-residue loop, 50–500 independent optimizations are recommended (79).
Most proteins are flexible, often adopting different conformations when binding to different ligands. Besides the single best model, it might be helpful to select several sub-optimal models that are structurally diverse (eg, selecting the best model from each conformational cluster of models). When no target ligand is known, the docking database can be screened against each of these representative models independently, followed by combining the screening results. However, when some target ligands are already known, the best single model could be selected based on its ability to rank these known ligands most highly in virtual screening.
The MODELLER objective function is a measure of how well the model satisfies the input spatial restraints. Lower values of the objective function indicate a better fit with the restraints. Models (of the same sequence) can only be ranked by the same objective function, consisting of the same restraints, usually derived from the same alignment.
The Discrete Optimized Protein Energy (DOPE) is an atomic distance-dependent statistical potential based on a physical reference state that accounts for the finite size and spherical shape of proteins (75). By default, the DOPE score is not included in the model building routine, and thus can be used as an independent assessment of the accuracy of the output models. DOPE considers the positions of all non-hydrogen atoms, with lower scores corresponding to models that are predicted to be more accurate. A sample script for generating a DOPE score is given at http://salilab.org/modeller/examples/assessment/assess_dope.py.
All lines in “rec.pdb” should start with “ATOM”. If the receptor contains a cofactor that has not been defined in the DOCK force field, a dictionary of parameters needs to be provided for the cofactor. “Structural” water molecules in the receptor should be renamed as “TIP”.
The binding site can be specified either using a modeled ligand or residues surrounding the binding pocket. In the latter case, at least 3 binding site residues should be defined in the file “xtal-lig.pdb”; the center of mass of these residues defines the center of the binding pocket.
The tasks that are accomplished by “make” are (Figure 10):
4.14.1. Copies of file “filt.params” (the input file for program FILT) as well as the “sph” and “grids” directories (containing input files and parameter files for sphere and scoring grids generation, respectively) are copied from directory “dockenv/scripts/”.
4.14.2. Program FILT located in “dockenv/bin/Linux” is used to identify binding site residues that are within 10 Å of any atom in the file “xtal-lig.pdb”. The result is stored in file “rec.site”.
4.14.3. Given the receptor coordinates in “rec.pdb” and the binding site definition in “rec.site”, the solvent-accessible molecular surface of the receptor binding site is calculated by the program DMS. The result is written in the file “rec.ms”.
4.14.4. The program SYBYL is used to add hydrogens on polar atoms to the receptor. The atomic coordinates of the protonated receptor are written to the file “grids/rec.crg”. All lines that do not contain atomic coordinates are removed manually; all lines in “rec.crg” should start with “ATOM”.
4.14.5. The program pdbtosph in “dockenv/bin/Linux” is used to derive spheres from atom positions in “xtal-lig.pdb”. The ligand-based spheres are stored in the file “sph/match.sph”.
4.14.6. Spheres in contact with the binding site surface are generated by the script “rec.ms” relying on the program sphgen (80) in “dockenv/bin/Linux”. These receptor-based spheres are stored in the file “sph/sph”.
4.14.7. Two perl scripts “makespheres1.pl” and “makespheres2.pl” in “dockenv/scripts” are used to generate spheres for the binding site electrostatic potential calculation with DelPhi (DelPhi spheres, named as “match1.sph”) and the spheres required for orienting database molecules in the binding site (matching spheres, named “match2.sph”), respectively. For both scripts, the ligand-based spheres “match.sph”, receptor-based spheres “sph”, and the protonated receptor “rec.crg” need to be provided as input files. DelPhi spheres occupy a greater volume than the matching spheres (Figure 11A). Spheres that are exposed to bulk water should be removed by hand.
4.14.8. The perl script “makebox.pl” in “dockenv/scripts” is used to determine the location and dimensions of the region in which the scoring grids will be calculated. This region should enclose the volume that the ligands are likely to occupy (described by “match2.sph”). The resulting rectangular box is written out in the file “grids/box”.
4.14.9. The contact score is a summation of the number of non-hydrogen atom contacts between a database molecule and the receptor (a contact is any intermolecular distance smaller than 4.5 Å), providing an assessment of shape complementarity. The program distmap (66) in “dockenv/bin/Linux” produces the grids for contact scoring. Three files are required for distmap, including the input file “INDIST”, the protonated receptor “rec.crg”, and the volume of the grids “box”. The contact grid is produced in the file “grids/distmap” by running the command “distmap”.
4.14.10. The DOCK’s force field score is the van der Waals interaction energy. The parameters are taken from the AMBER united-atom force field (81). The program chemgrid (66) in “dockenv/bin/Linux” produces the grids for force field scoring. The force field grid is written into the file “grids/chem.vdw” by running the command “chemgrid”. All receptor residues and atoms need to be defined in the parameter files “grids/prot.table.ambcrg.ambH” and “grids/vdw.parms.amb.mindock”, respectively.
4.14.11. The electrostatic potential grid is generated by DelPhi (69). The receptor coordinates in “rec.crg” and the Delphi spheres in “match1.sph” are combined into the file “grids/rec+sph.crg”. The DelPhi map is calculated using a relative dielectric constant of 2 for the volume defined by the receptor atoms and the spheres in the binding site, and a relative dielectric constant of 78 for the external solvent environment. The DelPhi grid is written to the file “grids/rec+sph.phi” by running the command “./delphi.com > delphi.log” in the “grids’ directory. All receptor residues and atoms need to be defined in the parameter file “grids/amb.crg.oxt”.
4.14.12. The solvent occlusion grid is calculated by the program solvmap, for subsequent calculation of the ligand desolvation penalty (82). Three files are required for solvmap, including the input file “INSOLV”, the protonated receptor “rec.crg”, and the volume of the grids “box”. The solvent occlusion grid is written into the file “grids/solvmap” by running the command “solvmap”. The grid file “grids/solvmap” should not contain any blank lines.
Several examples of file “INDOCK” are provided in the directory “dockenv/scripts/calibrate/”. A detailed description of the parameters used in INDOCK can be found in the manual of DOCK 3.5. Here, we describe several parameters that are often modified to achieve an optimal docking performance (Figure 7). The parameter “mode” should be specified as “search”. In the “search” mode, DOCK generates positions and orientations for each molecule in the database (virtual screening). The parameter “receptor_sphere_file” specifies the file that contains the matching spheres for ligand orientation in the binding site. Matching spheres can be manually scaled or relocated to achieve satisfying sampling in the desired region (eg, catalytic residues suggested by experiments). During docking, sets of atoms from database molecules match sets of matching spheres, if all the internal distances match within a tolerance value in Ångstroms specified by the parameter “distance_tolerance” (65). The choice of the tolerance value depends on the reliability of the matching sphere sizes and positions, which in turn is determined by the accuracy of the binding site conformation. We suggest a tolerance value of 1.5 Å when docking to comparative models. The sampling of the ligand positions and orientations is controlled by four parameters, including “ligand_binsize”, “ligand_overlap”, “receptor_binsize”, and “receptor_overlap” (65). “ligand_binsize” and “receptor_binsize” define the width of the bins containing ligand atoms and matching spheres, respectively. “ligand_overlap” and “receptor_overlap” define the overlap between the bins of ligand atoms and matching spheres, respectively. The increase of either the width of bins or the overlap between bins will result in more atoms/spheres in each bin. As a consequence, a greater number of matches will be found. Extensive sampling is achieved by setting the bin size for both ligand and receptor to 0.4 Å, and the overlap to 0.3 Å.
As shown in Figure 8, for each conformation of a database molecule, two lines are written out in the file “OUTDOCK”. The scoring results are written in the second line starting with the letter “E”, followed by the molecule identifier, contact score, electrostatic score, van der Waals score, polar solvation correction, apolar solvation correction, and total energy. The total energy is a sum of contact score, electrostatic score, van der Waals score, polar solvation correction, and apolar solvation correction.
References
- 1.Kuntz ID. Structure-Based Strategies for Drug Design and Discovery. Science. 1992;257:1078–1082. doi: 10.1126/science.257.5073.1078. [DOI] [PubMed] [Google Scholar]
- 2.Klebe G. Recent developments in structure-based drug design. J Mol Med. 2000;78:269–281. doi: 10.1007/s001090000084. [DOI] [PubMed] [Google Scholar]
- 3.Dailey MM, Hait C, Holt PA, Maguire JM, Meier JB, Miller MC, Petraccone L, Trent JO. Structure-based drug design: From nucleic acid to membrane protein targets. Exp Mol Pathol. 2009;86:141–150. doi: 10.1016/j.yexmp.2009.01.011. [DOI] [PMC free article] [PubMed] [Google Scholar]
- 4.Ealick SE, Armstrong SR. Pharmacologically relevant proteins. Curr Opin Struct Biol. 1993;3:861–867. [Google Scholar]
- 5.Gschwend DA, Good AC, Kuntz ID. Molecular docking towards drug discovery. J Mol Recognit. 1996;9:175–186. doi: 10.1002/(sici)1099-1352(199603)9:2<175::aid-jmr260>3.0.co;2-d. [DOI] [PubMed] [Google Scholar]
- 6.Hoffmann D, Kramer B, Washio T, Steinmetzer T, Rarey M, Lengauer T. Two-stage method for protein-ligand docking. J Med Chem. 1999;42:4422–4433. doi: 10.1021/jm991090p. [DOI] [PubMed] [Google Scholar]
- 7.Stahl M, Rarey M. Detailed analysis of scoring functions for virtual screening. J Med Chem. 2001;44:1035–1042. doi: 10.1021/jm0003992. [DOI] [PubMed] [Google Scholar]
- 8.Charifson PS, Corkery JJ, Murcko MA, Walters WP. Consensus scoring: A method for obtaining improved hit rates from docking databases of three-dimensional structures into proteins. J Med Chem. 1999;42:5100–5109. doi: 10.1021/jm990352k. [DOI] [PubMed] [Google Scholar]
- 9.Abagyan R, Totrov M. High-throughput docking for lead generation. Curr Opin Chem Biol. 2001;5:375–382. doi: 10.1016/s1367-5931(00)00217-9. [DOI] [PubMed] [Google Scholar]
- 10.Klebe G. Virtual ligand screening: strategies, perspectives and limitations. Drug Discov Today. 2006;11:580–594. doi: 10.1016/j.drudis.2006.05.012. [DOI] [PMC free article] [PubMed] [Google Scholar]
- 11.Sperandio O, Miteva MA, Delfaud F, Villoutreix BO. Receptor-based computational screening of compound databases: The main docking-scoring engines. Curr Protein Peptide Sci. 2006;7:369–393. doi: 10.2174/138920306778559377. [DOI] [PubMed] [Google Scholar]
- 12.Hermann JC, Marti-Arbona R, Fedorov AA, Fedorov E, Almo SC, Shoichet BK, Raushel FM. Structure-based activity prediction for an enzyme of unknown function. Nature. 2007;448:775–U772. doi: 10.1038/nature05981. [DOI] [PMC free article] [PubMed] [Google Scholar]
- 13.Kolb P, Rosenbaum DM, Irwin JJ, Fung JJ, Kobilka BK, Shoichet BK. Structure-based discovery of beta(2)-adrenergic receptor ligands. P Natl Acad Sci USA. 2009;106:6843–6848. doi: 10.1073/pnas.0812657106. [DOI] [PMC free article] [PubMed] [Google Scholar]
- 14.Song L, Kalyanaraman C, Fedorov AA, Fedorov EV, Glasner ME, Brown S, Imker HJ, Babbitt PC, Almo SC, Jacobson MP, Gerlt JA. Prediction and assignment of function for a divergent N-succinyl amino acid racemase. Nat Chem Biol. 2007;3:486–491. doi: 10.1038/nchembio.2007.11. [DOI] [PubMed] [Google Scholar]
- 15.Kalyanaraman C, Imker HJ, Federov AA, Federov EV, Glasner ME, Babbitt PC, Almo SC, Gerlt JA, Jacobson MP. Discovery of a dipeptide epimerase enzymatic function guided by homology modeling and virtual screening. Structure. 2008;16:1668–1677. doi: 10.1016/j.str.2008.08.015. [DOI] [PMC free article] [PubMed] [Google Scholar]
- 16.Rakus JF, Kalyanaraman C, Fedorov AA, Fedorov EV, Mills-Groninger FP, Toro R, Bonanno J, Bain K, Sauder JM, Burley SK, Almo SC, Jacobson MP, Gerlt JA. Computation-Facilitated Assignment of the Function in the Enolase Superfamily: A Regiochemically Distinct Galactarate Dehydratase from Oceanobacillus iheyensis. Biochemistry-Us. 2009;48:11546–11558. doi: 10.1021/bi901731c. [DOI] [PMC free article] [PubMed] [Google Scholar]
- 17.Fan H, Irwin JJ, Webb BM, Klebe G, Shoichet BK, Sali A. Molecular Docking Screens Using Comparative Models of Proteins. J Chem Inf Model. 2009;49:2512–2527. doi: 10.1021/ci9003706. [DOI] [PMC free article] [PubMed] [Google Scholar]
- 18.Berman HM, Westbrook J, Feng Z, Gilliland G, Bhat TN, Weissig H, Shindyalov IN, Bourne PE. The Protein Data Bank. Nucleic Acids Res. 2000;28:235–242. doi: 10.1093/nar/28.1.235. [DOI] [PMC free article] [PubMed] [Google Scholar]
- 19.Bairoch A, Bougueleret L, Altairac S, Amendolia V, Auchincloss A, Puy GA, Axelsen K, Baratin D, Blatter MC, Boeckmann B, Bollondi L, Boutet E, Quintaje SB, Breuza L, Bridge A, Saux VBL, deCastro E, Ciampina L, Coral D, Coudert E, Cusin I, David F, Delbard G, Dornevil D, Duek-Roggli P, Duvaud S, Estreicher A, Famiglietti L, Farriol-Mathis N, Ferro S, Feuermann M, Gasteiger E, Gateau A, Gehant S, Gerritsen V, Gos A, Gruaz-Gumowski N, Hinz U, Hulo C, Hulo N, Innocenti A, James J, Jain E, Jimenez S, Jungo F, Junker V, Keller G, Lachaize C, Lane-Guermonprez L, Langendijk-Genevaux P, Lara V, Le Mercier P, Lieberherr D, Lima TD, Mangold V, Martin X, Michoud K, Moinat M, Morgat A, Nicolas M, Paesano S, Pedruzzi I, Perret D, Phan I, Pilbout S, Pillet V, Poux S, Pozzato M, Redaschi N, Reynaud S, Rivoire C, Roechert B, Sapsezian C, Schneider M, Sigrist C, Sonesson K, Staehli S, Stutz A, Sundaram S, Tognolli M, Verbregue L, Veuthey AL, Vitorello C, Yip L, Zuletta LF, Apweiler R, Alam-Faruque Y, Barrell D, Bower L, Browne P, Chan WM, Daugherty L, Donate ES, Eberhardt R, Fedotov A, Foulger R, Frigerio G, Garavelli J, Golin R, Horne A, Jacobsen J, Kleen M, Kersey P, Laiho K, Legge D, Magrane M, Martin MJ, Monteiro P, O’Donovan C, Orchard S, O’Rourke J, Patient S, Pruess M, Sitnov A, Whitefield E, Wieser D, Lin Q, Rynbeek M, di Martino G, Donnelly M, van Rensburg P, Wu C, Arighi C, Arminski L, Barker W, Chen YX, Crooks D, Hu ZZ, Hua HK, Huang HZ, Kahsay R, Mazumder R, McGarvey P, Natale D, Nikolskaya AN, Petrova N, Suzek B, Vasudevan S, Vinayaka CR, Yeh LS, Zhang J, Consortium U. The Universal Protein Resource (UniProt) Nucleic Acids Res. 2008;36:D190–D195. doi: 10.1093/nar/gkm895. [DOI] [PMC free article] [PubMed] [Google Scholar]
- 20.Baker D, Sali A. Protein structure prediction and structural genomics. Science. 2001;294:93–96. doi: 10.1126/science.1065659. [DOI] [PubMed] [Google Scholar]
- 21.Baker D. A surprising simplicity to protein folding. Nature. 2000;405:39–42. doi: 10.1038/35011000. [DOI] [PubMed] [Google Scholar]
- 22.Bonneau R, Baker D. Ab initio protein structure prediction: Progress and prospects. Annu Rev Biophys Biomol Struct. 2001;30:173–189. doi: 10.1146/annurev.biophys.30.1.173. [DOI] [PubMed] [Google Scholar]
- 23.Marti-Renom MA, Stuart AC, Fiser A, Sanchez R, Melo F, Sali A. Comparative protein structure modeling of genes and genomes. Annu Rev Biophys Biomol Struct. 2000;29:291–325. doi: 10.1146/annurev.biophys.29.1.291. [DOI] [PubMed] [Google Scholar]
- 24.Sali A. 100,000 protein structures for the biologist. Nat Struct Biol. 1998;5:1029–1032. doi: 10.1038/4136. [DOI] [PubMed] [Google Scholar]
- 25.Chandonia JM, Brenner SE. The impact of structural genomics: Expectations and outcomes. Science. 2006;311:347–351. doi: 10.1126/science.1121018. [DOI] [PubMed] [Google Scholar]
- 26.Liu JF, Montelione GT, Rost B. Novel leverage of structural genomics. Nat Biotechnol. 2007;25:850–853. doi: 10.1038/nbt0807-849. [DOI] [PubMed] [Google Scholar]
- 27.Pieper U, Eswar N, Webb B, Eramian E, Kelly L, Barkan DT, Carter H, Mankoo P, Karchin R, Marti-Renom MA, Davis FP, Sali A, Sanchez R. MODBASE, a database of annotated comparative protein structure models, and ssociated resources. Nucleic Acids Res. 2009;37:D347–354. doi: 10.1093/nar/gkn791. [DOI] [PMC free article] [PubMed] [Google Scholar]
- 28.Jacobson M, Sali A. Comparative protein structure modeling and its applications to drug discovery. Annu Rep Med Chem. 2004;39:259–276. [Google Scholar]
- 29.Bissantz C, Bernard P, Hibert M, Rognan D. Protein-based virtual screening of chemical databases. II Are homology models of G-protein coupled receptors suitable targets? Proteins: Struct Funct Genet. 2003;50:5–25. doi: 10.1002/prot.10237. [DOI] [PubMed] [Google Scholar]
- 30.Cavasotto CN, Orry AJW, Abagyan RA. Structure-based identification of binding sites, native ligands and potential inhibitors for G-protein coupled receptors. Proteins: Struct Funct Genet. 2003;51:423–433. doi: 10.1002/prot.10362. [DOI] [PubMed] [Google Scholar]
- 31.Evers A, Klebe G. Ligand-supported homology modeling of G-protein-coupled receptor sites: Models sufficient for successful virtual screening. Angewandte Chemie-International Edition. 2004;43:248–251. doi: 10.1002/anie.200352776. [DOI] [PubMed] [Google Scholar]
- 32.Evers A, Klebe G. Successful virtual screening for a submicromolar antagonist of the neurokinin-1 receptor based on a ligand-supported homology model. J Med Chem. 2004;47:5381–5392. doi: 10.1021/jm0311487. [DOI] [PubMed] [Google Scholar]
- 33.Evers A, Klabunde T. Structure-based drug discovery using GPCR homology modeling: Successful virtual screening for antagonists of the Alpha1A adrenergic receptor. J Med Chem. 2005;48:1088–1097. doi: 10.1021/jm0491804. [DOI] [PubMed] [Google Scholar]
- 34.Moro S, Deflorian F, Bacilieri M, Spalluto G. Novel strategies for the design of new potent and selective human A(3) receptor antagonists: An update. Curr Med Chem. 2006;13:639–645. doi: 10.2174/092986706776055670. [DOI] [PubMed] [Google Scholar]
- 35.Nowak M, Kolaczkowski M, Pawlowski M, Bojarski AJ. Homology modeling of the serotonin 5-HT1A receptor using automated docking of bioactive compounds with defined geometry. J Med Chem. 2006;49:205–214. doi: 10.1021/jm050826h. [DOI] [PubMed] [Google Scholar]
- 36.Chen JZ, Wang JM, Xie XQ. GPCR structure-based virtual screening approach for CB2 antagonist search. J Chem Inf Model. 2007;47:1626–1637. doi: 10.1021/ci7000814. [DOI] [PubMed] [Google Scholar]
- 37.Zylberg J, Ecke D, Fischer B, Reiser G. Structure and ligand-binding site characteristics of the human P2Y(11) nucleotide receptor deduced from computational modelling and mutational analysis. Biochem J. 2007;405:277–286. doi: 10.1042/BJ20061728. [DOI] [PMC free article] [PubMed] [Google Scholar]
- 38.Radestock S, Weil T, Renner S. Homology model-based virtual screening for GPCR ligands using docking and target-biased scoring. J Chem Inf Model. 2008;48:1104–1117. doi: 10.1021/ci8000265. [DOI] [PubMed] [Google Scholar]
- 39.Singh N, Cheve G, Ferguson DM, McCurdy CR. A combined ligand-based and target-based drug design approach for G-protein coupled receptors: application to salvinorin A, a selective kappa opioid receptor agonist. J Comput -Aided Mol Des. 2006;20:471–493. doi: 10.1007/s10822-006-9067-x. [DOI] [PubMed] [Google Scholar]
- 40.Kiss R, Kiss B, Konczol A, Szalai F, Jelinek I, Laszlo V, Noszal B, Falus A, Keseru GM. Discovery of novel human histamine H4 receptor ligands by large-scale structure-based virtual screening. J Med Chem. 2008;51:3145–3153. doi: 10.1021/jm7014777. [DOI] [PubMed] [Google Scholar]
- 41.de Graaf C, Foata N, Engkvist O, Rognan D. Molecular modeling of the second extracellular loop of G-protein coupled receptors and its implication on structure-based virtual screening. Proteins: Struct Funct Bioinform. 2008;71:599–620. doi: 10.1002/prot.21724. [DOI] [PubMed] [Google Scholar]
- 42.Diller DJ, Li RX. Kinases, homology models, and high throughput docking. J Med Chem. 2003;46:4638–4647. doi: 10.1021/jm020503a. [DOI] [PubMed] [Google Scholar]
- 43.Oshiro C, Bradley EK, Eksterowicz J, Evensen E, Lamb ML, Lanctot JK, Putta S, Stanton R, Grootenhuis PDJ. Performance of 3D-database molecular docking studies into homology models. J Med Chem. 2004;47:764–767. doi: 10.1021/jm0300781. [DOI] [PubMed] [Google Scholar]
- 44.Nguyen TL, Gussio R, Smith JA, Lannigan DA, Hecht SM, Scudiero DA, Shoemaker RH, Zaharevitz DW. Homology model of RSK2 N-terminal kinase domain, structure-based identification of novel RSK2 inhibitors, and preliminary common pharmacophore. Bioorg Med Chem. 2006;14:6097–6105. doi: 10.1016/j.bmc.2006.05.001. [DOI] [PubMed] [Google Scholar]
- 45.Rockey WM, Elcock AH. Structure selection for protein kinase docking and virtual screening: Homology models or crystal structures? Curr Protein Peptide Sci. 2006;7:437–457. doi: 10.2174/138920306778559368. [DOI] [PubMed] [Google Scholar]
- 46.Schapira M, Abagyan R, Totrov M. Nuclear hormone receptor targeted virtual screening. J Med Chem. 2003;46:3045–3059. doi: 10.1021/jm0300173. [DOI] [PubMed] [Google Scholar]
- 47.Marhefka CA, Moore BM, Bishop TC, Kirkovsky L, Mukherjee A, Dalton JT, Miller DD. Homology modeling using multiple molecular dynamics simulations and docking studies of the human androgen receptor ligand binding domain bound to testosterone and nonsteroidal ligands. J Med Chem. 2001;44:1729–1740. doi: 10.1021/jm0005353. [DOI] [PubMed] [Google Scholar]
- 48.Kasuya A, Sawada Y, Tsukamoto Y, Tanaka K, Toya T, Yanagi M. Binding mode of ecdysone agonists to the receptor: comparative modeling and docking studies. J Mol Model. 2003;9:58–65. doi: 10.1007/s00894-002-0113-x. [DOI] [PubMed] [Google Scholar]
- 49.Li RS, Chen XW, Gong BQ, Selzer PM, Li Z, Davidson E, Kurzban G, Miller RE, Nuzum EO, McKerrow JH, Fletterick RJ, Gillmor SA, Craik CS, Kuntz ID, Cohen FE, Kenyon GL. Structure-based design of parasitic protease inhibitors. Bioorg Med Chem. 1996;4:1421–1427. doi: 10.1016/0968-0896(96)00136-8. [DOI] [PubMed] [Google Scholar]
- 50.Selzer PM, Chen XW, Chan VJ, Cheng MS, Kenyon GL, Kuntz ID, Sakanari JA, Cohen FE, McKerrow JH. Leishmania major: Molecular modeling of cysteine proteases and prediction of new nonpeptide inhibitors. Exp Parasitol. 1997;87:212–221. doi: 10.1006/expr.1997.4220. [DOI] [PubMed] [Google Scholar]
- 51.Enyedy IJ, Ling Y, Nacro K, Tomita Y, Wu XH, Cao YY, Guo RB, Li BH, Zhu XF, Huang Y, Long YQ, Roller PP, Yang DJ, Wang SM. Discovery of small-molecule inhibitors of bcl-2 through structure-based computer screening. J Med Chem. 2001;44:4313–4324. doi: 10.1021/jm010016f. [DOI] [PubMed] [Google Scholar]
- 52.de Graaf C, Oostenbrink C, Keizers PHJ, van der Wijst T, Jongejan A, Vemleulen NPE. Catalytic site prediction and virtual screening of cytochrome P450 2D6 substrates by consideration of water and rescoring in automated docking. J Med Chem. 2006;49:2417–2430. doi: 10.1021/jm0508538. [DOI] [PubMed] [Google Scholar]
- 53.Katritch V, Byrd CM, Tseitin V, Dai DC, Raush E, Totrov M, Abagyan R, Jordan R, Hruby DE. Discovery of small molecule inhibitors of ubiquitin-like poxvirus proteinase I7L using homology modeling and covalent docking approaches. J Comput -Aided Mol Des. 2007;21:549–558. doi: 10.1007/s10822-007-9138-7. [DOI] [PMC free article] [PubMed] [Google Scholar]
- 54.Mukherjee P, Desai PV, Srivastava A, Tekwani BL, Avery MA. Probing the structures of leishmanial farnesyl pyrophosphate synthases: Homology modeling and docking studies. J Chem Inf Model. 2008;48:1026–1040. doi: 10.1021/ci700355z. [DOI] [PubMed] [Google Scholar]
- 55.Rotkiewicz P, Sicinska W, Kolinski A, DeLuca HF. Model of three-dimensional structure of vitamin D receptor and its binding mechanism with 1 alpha,25-dihydroxyvitamin D-3. Proteins: Struct Funct Genet. 2001;44:188–199. doi: 10.1002/prot.1084. [DOI] [PubMed] [Google Scholar]
- 56.Que XC, Brinen LS, Perkins P, Herdman S, Hirata K, Torian BE, Rubin H, McKerrow JH, Reed SL. Cysteine proteinases from distinct cellular compartments are recruited to phagocytic vesicles by Entamoeba histolytica. Mol Biochem Parasitol. 2002;119:23–32. doi: 10.1016/s0166-6851(01)00387-5. [DOI] [PubMed] [Google Scholar]
- 57.Parrill AL, Echols U, Nguyen T, Pham TCT, Hoeglund A, Baker DL. Virtual screening approaches for the identification of non-lipid autotaxin inhibitors. Bioorg Med Chem. 2008;16:1784–1795. doi: 10.1016/j.bmc.2007.11.018. [DOI] [PubMed] [Google Scholar]
- 58.Fernandes MX, Kairys V, Gilson MK. Comparing ligand interactions with multiple receptors via serial docking. J Chem Inf Comput Sci. 2004;44:1961–1970. doi: 10.1021/ci049803m. [DOI] [PubMed] [Google Scholar]
- 59.Kairys V, Fernandes MX, Gilson MK. Screening drug-like compounds by docking to homology models: A systematic study. J Chem Inf Model. 2006;46:365–379. doi: 10.1021/ci050238c. [DOI] [PubMed] [Google Scholar]
- 60.McGovern SL, Shoichet BK. Information decay in molecular docking screens against holo, apo, and modeled conformations of enzymes. J Med Chem. 2003;46:2895–2907. doi: 10.1021/jm0300330. [DOI] [PubMed] [Google Scholar]
- 61.Sali A, Blundell TL. Comparative Protein Modeling by Satisfaction of Spatial Restraints. J Mol Biol. 1993;234:779–815. doi: 10.1006/jmbi.1993.1626. [DOI] [PubMed] [Google Scholar]
- 62.Lorber DM, Shoichet BK. Flexible ligand docking using conformational ensembles. Protein Sci. 1998;7:938–950. doi: 10.1002/pro.5560070411. [DOI] [PMC free article] [PubMed] [Google Scholar]
- 63.Lorber DM, Shoichet BK. Hierarchical docking of databases of multiple ligand conformations. Curr Top Med Chem. 2005;5:739–749. doi: 10.2174/1568026054637683. [DOI] [PMC free article] [PubMed] [Google Scholar]
- 64.Novoa EM, de Pouplana LR, Barril X, Orozco M. Ensemble Docking from Homology Models. J Chem Theory Comput. 2010;6:2547–2557. doi: 10.1021/ct100246y. [DOI] [PubMed] [Google Scholar]
- 65.Shoichet BK, Bodian DL, Kuntz ID. Molecular Docking Using Shape Descriptors. J Comput Chem. 1992;13:380–397. [Google Scholar]
- 66.Meng EC, Shoichet BK, Kuntz ID. Automated Docking with Grid-Based Energy Evaluation. J Comput Chem. 1992;13:505–524. [Google Scholar]
- 67.Ferrin TE, Huang CC, Jarvis LE, Langridge R. The Midas Display System. J Mol Graphics. 1988;6:13–27. [Google Scholar]
- 68.SYBYL. 6.7. Tripos Associates; [Google Scholar]
- 69.Nicholls A, Honig B. A Rapid Finite-Difference Algorithm, Utilizing Successive over-Relaxation to Solve the Poisson-Boltzmann Equation. J Comput Chem. 1991;12:435–445. [Google Scholar]
- 70.Huang N, Shoichet BK, Irwin JJ. Benchmarking sets for molecular docking. J Med Chem. 2006;49:6789–6801. doi: 10.1021/jm0608356. [DOI] [PMC free article] [PubMed] [Google Scholar]
- 71.Terasaka T, Kinoshita T, Kuno M, Nakanishi I. A highly potent non-nucleoside adenosine deaminase inhibitor: Efficient drug discovery by intentional lead hybridization. J Am Chem Soc. 2004;126:34–35. doi: 10.1021/ja038606l. [DOI] [PubMed] [Google Scholar]
- 72.Terasaka T, Nakanishi I, Nakamura K, Eikyu Y, Kinoshita T, Nishio N, Sato A, Kuno M, Seki N, Sakane K. Structure-based de novo design of non-nucleoside adenosine deaminase inhibitors (vol 13, pg 1115, 2003) Bioorg Med Chem Lett. 2003;13:4147–4147. doi: 10.1016/s0960-894x(03)00026-x. [DOI] [PubMed] [Google Scholar]
- 73.Sideraki V, Wilson DK, Kurz LC, Quiocho FA, Rudolph FB. Site-directed mutagenesis of histidine 238 in mouse adenosine deaminase: Substitution of histidine 238 does not impede hydroxylate formation. Biochemistry-Us. 1996;35:15019–15028. doi: 10.1021/bi961427e. [DOI] [PubMed] [Google Scholar]
- 74.Vedadi M, Lew J, Artz J, Amani M, Zhao Y, Dong AP, Wasney GA, Gao M, Hills T, Brokx S, Qiu W, Sharma S, Diassiti A, Alam Z, Melone M, Mulichak A, Wernimont A, Bray J, Loppnau P, Plotnikova O, Newberry K, Sundararajan E, Houston S, Walker J, Tempel W, Bochkarev A, Kozieradzki L, Edwards A, Arrowsmith C, Roos D, Kain K, Hui R. Genome-scale protein expression and structural biology of Plasmodium falciparum and related Apicomplexan organisms. Mol Biochem Parasitol. 2007;151:100–110. doi: 10.1016/j.molbiopara.2006.10.011. [DOI] [PubMed] [Google Scholar]
- 75.Shen MY, Sali A. Statistical potential for assessment and prediction of protein structures. Protein Sci. 2006;15:2507–2524. doi: 10.1110/ps.062416606. [DOI] [PMC free article] [PubMed] [Google Scholar]
- 76.Edgar RC. MUSCLE: multiple sequence alignment with high accuracy and high throughput. Nucleic Acids Res. 2004;32:1792–1797. doi: 10.1093/nar/gkh340. [DOI] [PMC free article] [PubMed] [Google Scholar]
- 77.Chenna R, Sugawara H, Koike T, Lopez R, Gibson TJ, Higgins DG, Thompson JD. Multiple sequence alignment with the Clustal series of programs. Nucleic Acids Res. 2003;31:3497–3500. doi: 10.1093/nar/gkg500. [DOI] [PMC free article] [PubMed] [Google Scholar]
- 78.Notredame C, Higgins DG, Heringa J. T-Coffee: A novel method for fast and accurate multiple sequence alignment. J Mol Biol. 2000;302:205–217. doi: 10.1006/jmbi.2000.4042. [DOI] [PubMed] [Google Scholar]
- 79.Fiser A, Do RKG, Sali A. Modeling of loops in protein structures. Protein Sci. 2000;9:1753–1773. doi: 10.1110/ps.9.9.1753. [DOI] [PMC free article] [PubMed] [Google Scholar]
- 80.Kuntz ID, Blaney JM, Oatley SJ, Langridge R, Ferrin TE. A Geometric Approach to Macromolecule-Ligand Interactions. J Mol Biol. 1982;161:269–288. doi: 10.1016/0022-2836(82)90153-x. [DOI] [PubMed] [Google Scholar]
- 81.Weiner SJ, Kollman PA, Case DA, Singh UC, Ghio C, Alagona G, Profeta S, Weiner P. A New Force-Field for Molecular Mechanical Simulation of Nucleic-Acids and Proteins. J Am Chem Soc. 1984;106:765–784. [Google Scholar]
- 82.Mysinger MM, Shoichet BK. Rapid Context-Dependent Ligand Desolvation in Molecular Docking. J Chem Inf Model. 2010;50:1561–1573. doi: 10.1021/ci100214a. [DOI] [PubMed] [Google Scholar]


