Abstract
As the human population increases and production expands, energy demand and anthropogenic carbon emission rates have been growing rapidly, and the need to decrease carbon emission levels has drawn increasing attention. The link between energy production and consumption has required the large-scale transport of energy within energy transmission networks. Within this energy flow, there is a virtual circulation of carbon emissions. To understand this circulation and account for the relationship between energy consumption and carbon emissions, this paper introduces the concept of “carbon emission flow in networks” and establishes a method to calculate carbon emission flow in networks. Using an actual analysis of China's energy pattern, the authors discuss the significance of this new concept, not only as a feasible approach but also as an innovative theoretical perspective.
Carbon emissions, primarily in the form of carbon dioxide (CO2), are a major source of greenhouse gases (GHG). Carbon emissions can be classified into two types depending on their source: (i) natural carbon emissions; and (ii) anthropogenic carbon emissions.
Natural carbon emissions largely originate from respiration and the decomposition of organisms. These sources are a normal part of the carbon cycle in ecosystems. Anthropogenic carbon emissions largely originate from carbon-based fuel combustion, in which solid carbon elements in fuels are converted into gaseous carbon dioxide to provide essential energy for humans. With the demand for energy dramatically increasing since the Industrial Revolution1,2,3, there has been a large-scale release of carbon into the atmosphere, breaking the balance of the natural carbon cycle. Because global climate change has become a serious concern for humans in the 21st century4,5,6,7, carbon emission reductions and low-carbon emission development have become inevitable.
There has been a great deal of research on low-carbon emission development. The evaluation of carbon emissions is fundamental to the field of low-carbon development and has helped generate opinions and suggestions about low-carbon policy8,9, as well as analyses and discussion of specific low-carbon technologies10,11,12. In most studies, carbon emissions are calculated using fossil fuel consumption and the relevant carbon emissions factor. Therefore, carbon emissions can only be considered as the environmental cost of energy production. Although carbon emissions from energy producers using fossil fuel combustion, fossil fuel consumption originates from the demand of energy consumers, who should be regarded as the primary cause of carbon emissions. Carbon emissions from the energy industry should be understood from the perspective of consumption, allowing the relationship between carbon emissions and energy consumption to be examined in more detail. In fact, within the international trade network, the concept of “virtual” carbon emission has been proposed in trade logistics, and an input–output analysis has been conducted to estimate the flows of virtual carbon that are implicit in domestic production technologies and in the patterns of international trade13,14. In these literatures, the “virtual” carbon emission is essentially a kind of embedded carbon emission. which has also been mentioned in related fields such as environmental science15,16,17. When focusing on the relationship between the life-cycle carbon emissions of each commodity in trade flows, it is a good idea to evaluate carbon emissions from the perspective of consumption. The focus of this paper is the relationship between carbon emissions and energy flow. The characteristics of network will be studied as well. In this way, carbon emissions will be treated differently from the way in which they are usually treated: here, carbon emissions will not be considered as a type of GHG but as a type of network flow, which we call a carbon emission flow. In energy networks that have visible structures and facilities, energy is spatially restricted to flow along visible branches or pathways from one node to another. The pathways of carbon flow in networks should be reasonably similar. Therefore, carbon flow in networks can be understood more easily, and the descriptions can be more tangible.
The concept of carbon emission flow is crucial for understanding and analysing anthropogenic carbon emissions. First, in networks, carbon emission flows are tightly integrated with energy flows. The distribution of carbon emission flows can be calculated from the distribution of energy flows. Second, by tracing back the carbon emission flows, we can find the primary origin of carbon emissions and reasonably allocate carbon mitigation obligations. Third, we can identify the efficiency of carbon utilisation for the whole network by checking the carbon emission flows. The results might be helpful for network upgrades and expansion.
In this paper, carbon emission flow in the network is different from the well known life-cycle carbon emissions. The focus of life-cycle analysis is the evaluation of carbon emissions at different life-cycle stages. Life-cycle analysis therefore approaches carbon emissions from the perspective of time. The regional distribution of carbon emissions is not the primary problem when Life-cycle analysis is used. By contrast, the analysis of carbon emission flow in the network approaches carbon emissions from a spatial perspective. Research pertaining to carbon emission flow often observes the flow at a particular point in time or over a particular time period.
To illustrate the application effects of carbon emission flow in the network, this paper will establish a method to calculate the carbon emission flow in networks in “method” section. Using the example of the national power system in China, the application effect of carbon emission flow will be revealed in “results” and “discussion” section. There are three primary reasons for using the Chinese power system as the subject of this case study.
First, with accelerating economic development, China will have a fast-growing demand for energy, with coal being the dominant energy supply. In an age of increasing global climate concerns, China, possibly the largest GHG emitter in the world at present, is facing unprecedented pressure to make a solid international commitment to GHG reduction. In fact, China has already taken a number of measures to develop a low-carbon plan. Currently, China is promulgating national plans to speed up fundamental energy change and to increase the proportion of renewable energy in terms of total energy production and consumption. China's official target is that by 2020, non-fossil fuel energy will constitute 15% of the country's total energy production. Compared with 2005, CO2 emissions in 2020 per GDP unit will have dropped by 40–45%. However, it will be challenging to achieve these low-carbon goals. Owing to its high carbon density, coal will still be a major energy source, taking a leading role in the energy production mix for China for the next 20 to 30 years7,18,19. For possibly the largest emitter of CO2 in the world, the application of carbon emission flow might more clearly reveal the embedded carbon emissions within cross-region electric energy flow, thus help to identify a more effective way of decarbonisation for power sector, making contributions to the accomplishment of national promised targets of China.
Second, the power industry is indispensable to daily life and is both energy-intensive and carbon-intensive, particularly in China. According to the IEA, more than half of the coal consumption in China is used for power generation, and approximately 38% of China's CO2 was emitted by the power industry in 2008. The power industry is the biggest energy industry and is the major contributor of carbon emissions in China. With future development in the economy, increasing energy demands in China will inevitably lead to sharp increases in carbon emissions. With improvements such as urbanisation and greater access to electricity in China, the carbon emissions from the power industry will increase further. To initiate low-carbon emission development in China, the low-carbon development of the power industry is of crucial importance. Electricity is a type of secondary energy; carbon emissions from the power industry primarily originate from power generation, whereas the process of electricity consumption does not emit any CO2. To promulgate the carbon emission flow within the energy flow in artificial networks,the electric power system is the best choice.
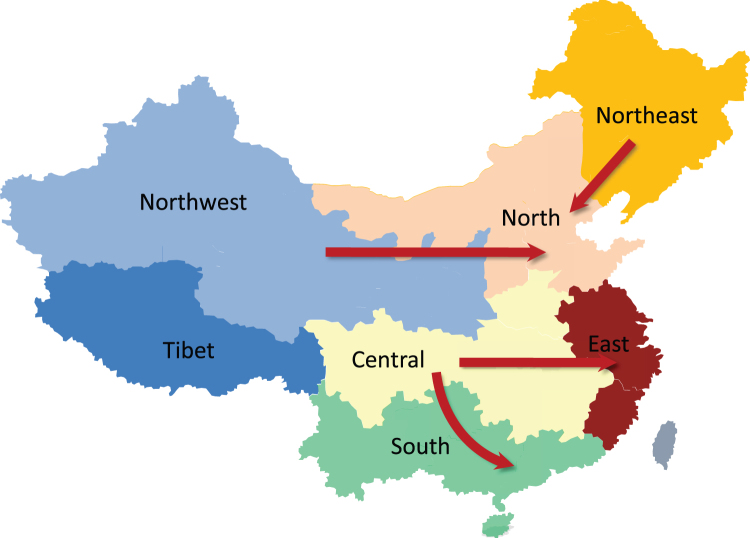
Third, to obtain valuable results for China's low carbon plan, the case study should have special characteristics for China's energy structure and energy supply and demand scenario. Most importantly, the case study should be sufficiently large in scale. According to China's history of energy production, most primary energy sources are concentrated in the central (Three Gorges Project in Hubei province in Central China) and western regions (Shanxi and Shaanxi in Inner Mongolia-China's main coal base), while the majority of large power generation centres are located along the southeast coast as a result of the developed economy there. In this paper, Eastern China consists of the provinces of Zhejiang, Anhui, Jiangsu, Fujian, and Shanghai city. The area of Eastern China is approximately 5% of the total area of China, while the power demand of Eastern China is nearly 30% of China's total power demand. To use power resources effectively and to make sure that the east and west develop steadily, the large-scale transportation of energy in the “West-East Power Transmission Project” is currently underway. Energy flow is shown in Figure 1. Within these national large-scale energy flows, carbon emission flows are also considerable. The analysis results of ACN (amount of carbon consumption) and APN (amount of carbon production) in separate areas in China may be entirely different. For separate areas, the development strategies for low carbon may need adjustment.
Figure 1. China's national power flow pattern.
According to the “West-East Power Transmission Project”, there are three main national power flows from the western regions to the southeast coastal areas, in particular, the Guangdong province and Shanghai city. In addition, owing to energy demand and resource distribution in the northeast region, the northeast power grid provides extra power flow to the North China grid as well.
In addition to the description above, an account of the power system is still necessary. In the power system, transmission lines are represented as branches, and power plants, substations, and consumers are represented as nodes. When a power system is in operation, power plants are generating electricity, and electric currents are present in the power system, which is known as the power flow. This current is the actual energy flow in the power system. Carbon emission flow is concurrent with the power flow. In the power system analysis, power flow starts from the power plants and ends at the consumers. Carbon emission flow should have the same distribution as power flow, although the amount of carbon emission flow may differ from power flow.
Results
To better describe the carbon emission flows, we define two characteristics for each node and link in the networks, i.e., amount and intensity. The flow amount is a type of cumulant within a given time period. The flow amount at the source node (APN) represents the amount of emissions resulting from energy production at the source node, whereas the flow amount at the sink nodes represents the amount of emission flow gathered at the sink nodes. The flow amount at the branch (AB) represents the amount of emissions transmitted through the network.
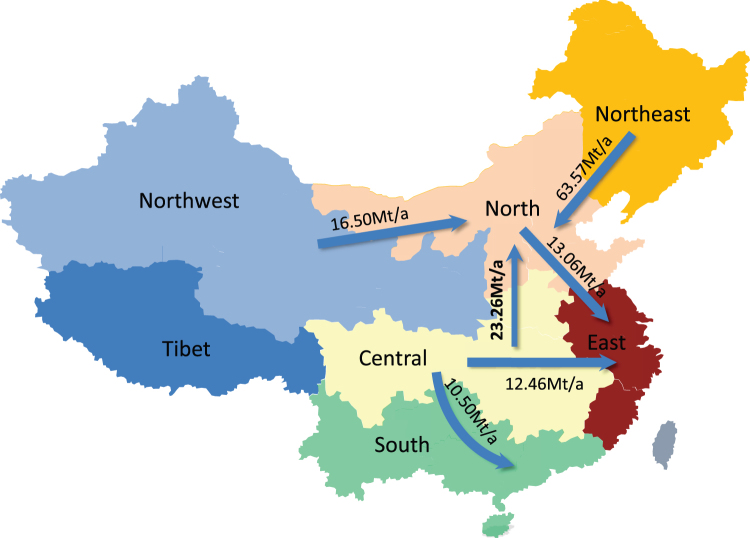
To analyse the carbon emission flow distribution in China, the carbon productivity of the whole country's electric power industry in 2010 and 2020 was evaluated with production simulation software developed by Tsinghua University. The data for generating, consuming, capacity forecasting and power planning were collected from the official database and reports of the National Development and Reform Commission (NDRC) and the National Energy Administration20. Combined with the information from power plants of various regions, 2010 carbon emissions from the power system are calculated for the existing six main electric system areas of China (northwest, north, northeast, central, east, and south). The differences in mix of power capacity as well as generation have already been taken account of, thus, the regional intensities are actually average values. In China, although the task of mitigating carbon emissions will have to be distributed to provincial or lower levels, carbon emission analysis at the regional level can also form the basis for low-carbon policy making. In this approach, the carbon intensity of these regional power systems can be obtained. Each of these regional power systems can be treated as one node in the national power system, and tie-lines between different regional power systems can be treated as links. Each regional power system has its own power generation and capacity, so each node is both a source node and a sink node (details will be discussed in the Method section). Furthermore, with power transmission corridors and power supply agreements, carbon emission flows in the national power system in 2010 are available. The pattern of the whole country's carbon emission flow can be seen in Figure 2. Most of the carbon emission flow enters in the north and the east, which coincides with the power flow diagram in Figure 1.
Figure 2. The carbon emission flow distribution and flow amount (AB) of China in 2010.
According to the transmission corridors and power supply and demand among these area power systems, there are six main carbon flows in the national area, and most of the carbon flow accumulates in the northern and eastern areas. The carbon flow from the northeast to the north contains the largest amount because most of the power flow through this corridor is generated by thermal units.
Carbon emission, in accordance with local fossil fuel generation, is the flow amount at the source node (APN). In fact, regions containing the output ends of the transmission corridors share most of the carbon emissions in the national electric industry. The local emissions in this type of region are greater than the actual carbon consumption; the so-called ‘actual emission’ equals ACN, or vice versa. Carbon emission flow can describe this difference clearly. To show the effect conveyed by carbon emission flow analysis, a comparison can be made. From the results in Table 1, it is clear that the flow amount of the sink node, ACN, from the north and east system areas is greater than its local emissions. In the south area, ACN emission is nearly equal to APN, due to its weak connection with other area power systems. The other three areas' ACNs are lower than their APNs, and the total ACN is equal to the total APN, which are also equal to the whole country's emission.
Table 1. The ACN and APN from the power industries of each area in 2010 and 2020. If the actual emission is more than the local emission, the grid area allows extra emission by taking in electricity for consumption. If the local emission is larger, it means that the grid area allows for emission in other areas owing to power output. The power systems in Tibet and Taiwan are not considered because of their weak connection. In addition, their generation capacity and electricity consumption are small compared with those in other areas. In 2020, both the amount and difference between APN and ACN in each area have increased during this decade. The difference between local and actual emission in the southern area did not change due to a weak connection with other areas' power systems.
| 2010 | 2020 | |||
|---|---|---|---|---|
| APN(Mt) | ACN(Mt) | APN(Mt) | ACN(Mt) | |
| Northwest | 241.40 | 224.90 | 561.05 | 483.66 |
| Central | 451.69 | 431.46 | 774.51 | 638.85 |
| South | 412.89 | 413.90 | 640.90 | 641.90 |
| North | 701.17 | 774.95 | 876.90 | 1341.93 |
| Northeast | 430.51 | 366.94 | 1000.49 | 535.50 |
| East | 759.06 | 784.57 | 1080.34 | 1292.34 |
As the purpose of case study is to test the effectiveness of the proposed concept of carbon emission flow and show the significance to apply the concept on China's power sector, uncertainty analysis is beyond the scope of this paper. However, when we expect to use this concept in empirical analysis to make instructive conclusions, the uncertainties within energy sectors should be considered. The major uncertainties within power sector includes long-term load forecasting errors, different developing levels of generation and transmission technologies, deviations on power capacity expansion, etc.
With the rapid growth of non-fossil fuel generation capacity in each area, low-carbon contributions can be made through energy transportation. This type of contribution can be worked out by another comparison of carbon emission flow at different times.
In this comparison, an additional 2020 scenario has been analysed. With the rapid growth of consumption, the gap of electricity supply in power capacity centres will be much larger than that in 2010. The Ultra-high voltage (UHV) power system will be completed, providing long-range and large-scale electric power transmission capacity, leading to a wider scope in the optimal allocation of energy resources. This improvement may lead to significant increases in the power transmission and carbon emission flow amount; however, the direction of each carbon emission flow may not change. The overall patterns will be the same as those seen in 2010. Compared to the results of 2010, carbon emission flow exhibits a greater difference in 2020. The total carbon emission flow amount is 140 Mt in 2010, comprising approximately 5% of the total emissions. The total flow amount in 2020 is increased by a factor of five to 754 Mt, and the ratio is tripled to 15.3%. For most of the areas, the difference between APN and ACN becomes more significant. In the north area, shown in Table 1, only 9% of its actual emission comes with carbon emission flow in 2010, and the ratio in 2020 will rise to 35%. The total amount of CO2 emission carried by carbon emission flow in the north area is 465 Mt, which is nearly the APN of the entire northwest area. For the northeast power system, almost half of its CO2 emission is a result the power demands of other areas. In 2020, the east area power system will have the largest power demand and APN. After considering carbon emission flow, the north area power system has the largest ACN.
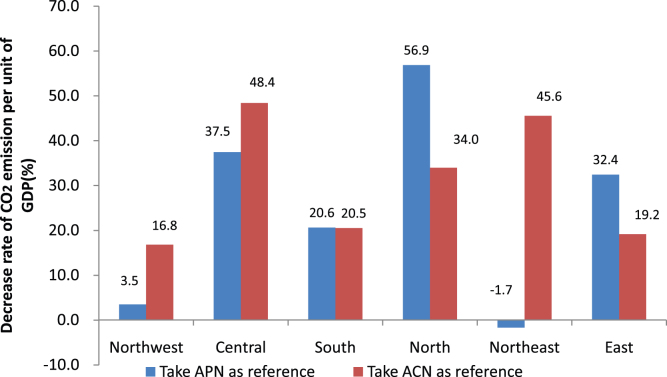
In 2020, a major goal for national low-carbon development is a 45% decrease in carbon emissions per unit GDP. To reach this goal, each area has its own plan for industrial development, as well as a strategy for saving energy and reducing emissions. Conventionally, carbon emission per unit GDP is the total emissions divided by the total GDP. Without considering carbon emission flow, the total emissions can only refer to APN. Because GDP is closely related to electricity consumption rather than production, if APN is used for the regional evaluation, the evaluation will be unfair to power output areas. To obtain more reasonable results, the total GDP of each area should be divided by its ACN.
A third comparison was made to show the difference between the conventional results from APN and the reasonable results of ACN from carbon emission flow, which exhibit remarkable contrast, as shown in Figure 3.
Figure 3. Decreased rate of CO2 emission per unit of GDP in 2020 compared with 2005, considering APN and ACN.
In the central and northeast areas, the goal has already been accomplished when carbon flow is considered. However, results in the northern area are quite different.
Discussion
Carbon emission flow analysis reveals that three areas with qualitative changes that might prevent the 45% goal from being reached. In the northeast area, the reduction rate of carbon emission per unit GDP will be minus if APN is used as a reference point. In fact, this goal has already been accomplished in the sense that the ACN is used as a reference in Figure 3. Using the results above, work on energy conservation needs more attention in the north and eastern areas because the effects of energy conservation and carbon emission reduction can be more significant in the areas with a higher ACN. Areas with a higher APN can be considered energy bases, in such areas, technologies of low-carbon generation need more development. The influence of power transmission is quite considerable. Considering the generality of the definition, this concept could certainly be utilized to analyze the carbon emission flow in a real physically connected power system. Only through an analysis of carbon emission flow can this requirement be revealed and properly accounted for.
In this paper, the existence and effects of network carbon emission flow have been tested in power systems, which have not been carried out previously. According to these results, administrative organisations can be aware of ACN and its intensity, allowing the work of energy-savings and emission reduction to be more target-oriented. The concept of carbon emission flow is not limited to the power system, and if it can be used in all energy industries and networks as a whole, the relationship between energy consumption and carbon emission can be described more clearly. This ability will be useful for the entire country's low-carbon strategy formulation and policy-making.
In international logistics networks, it can be concluded that net flow moved from the developing to the developed countries through imports and exports. In terms of consumption, developed countries are still the world's largest carbon emitters21. With the application of carbon emission flow, the carbon production and consumption in different countries, in addition to the responsibility transferred elsewhere through imports and exports, can be clearly described. The countries with significant imported carbon consumption should improve their lifestyle, whereas countries with significant exported emissions should make improvements to the carbon intensity of their production process.
The most important function of analysing carbon emission flow is that it strongly reveals that carbon emissions are shared by power consumption and power generation, rather than being solely produced by power generation. This analysis is similar to a carbon-label on various consumer goods, showing the levels of CO2 emissions that result from the processes of production and transportation22. If there is a future carbon tax, these labels could be useful tokens for varying amounts of taxation. Accordingly, consumers will sensibly choose ‘products’ with the lowest carbon consumption and change their lifestyle. In turn, this labelling could be an incentive for producers to reduce carbon emissions. With the aid of the cap and trade mechanism, new efforts can be expected for technological innovation to further reduce CO2 emission at lower costs6. Finally, with the concept of carbon emission flow, which integrates carbon production and consumption, new ideas and research methods in the field of low-carbon development can be assessed further.
Methods
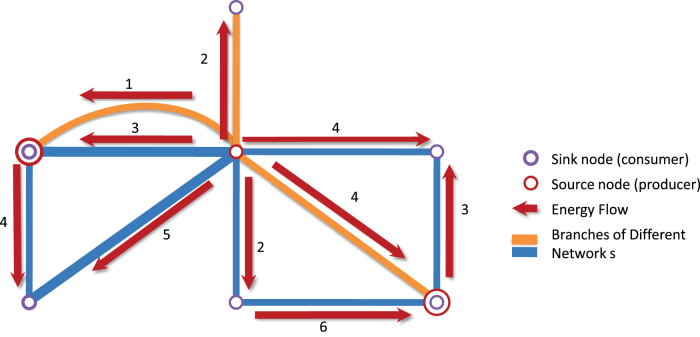
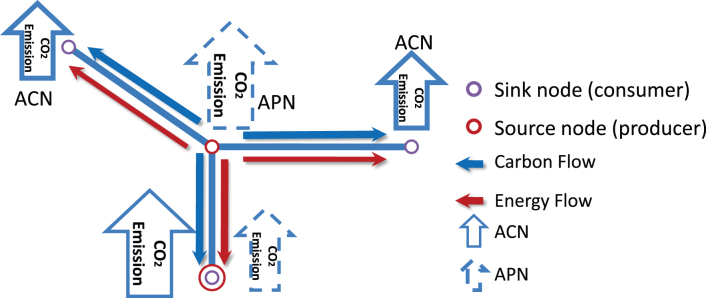
When studying the energy-related activities of production, transportation, and consumption from an abstract point of view, we observe that all of these activities exist in the framework of artificial networks. Examples include the road network, the railway network, the pipeline network, and the electricity network23,24. All of these networks could be described as topologies of nodes and their links; the energy related activities could be described as energy flows in the networks. As shown in Figure 4, the energy flows within the networks would be injected from the source nodes and then flow along the links to the sink nodes. The injection at source nodes represents energy production, whereas the ejection at sink nodes represents energy consumption. Although the energy flow starts from the source nodes, the essential stimulus is the need for energy consumption at the sink nodes.
Figure 4. Schematic diagram of energy flow in artificial networks.
For example, nodes in this figure can be treated as cities, and the lines of different colours represent branches of different networks, such as electricity transmission lines and gas pipelines. Red arrows denote the direction of energy flow between different cities; the figure represents the flow of energy.
Essentially, anthropogenic carbon emission is incurred by energy-related human activities, and there are close relationships between these two issues. Hence, when we look within energy flows, we can observe underlying carbon emission flows in the networks, which strictly correspond to the energy flows. Carbon emissions are generated from the source nodes, which are driven by the energy demand at sink nodes. When the sink nodes consume energy, this consumption also involves carbon emissions. Therefore, this relationship could be described by carbon emission flows along the links within the energy flows. The relationship between energy emissions and carbon emissions is described in Figure 5.
Figure 5. Schematic diagram for carbon emission flow in a power grid.
Using the angle of carbon emission flow, carbon emission is no longer emitted from the source node. The emissions travel along transmission paths with energy flow to consumers, as if CO2 is emitted by consumers through the network. When consumers use energy, they accumulate carbon emission flow as well. The accumulation of carbon emission flow can be calculated using a proper method and is regarded as carbon cost.
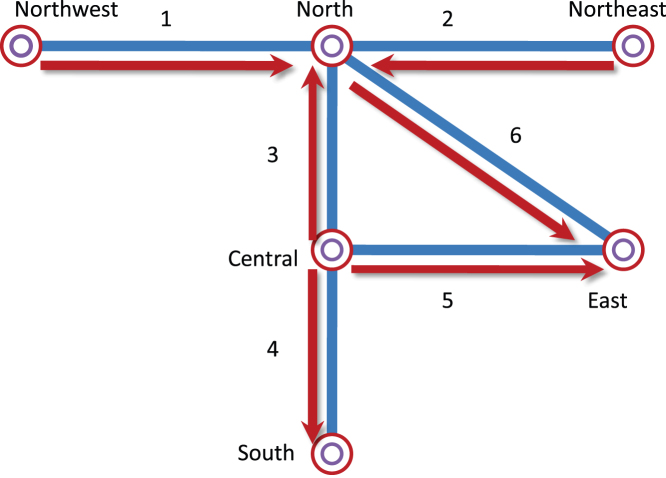
In an actual energy network, a node can be both a sink node and source node. The nodal carbon emission per unit energy consumption (NI) is defined as the ratio of the total energy consumption and total carbon emission flow accumulation at this point. In each branch of the network, the flow rate of carbon emission and energy flow is proportional. This ratio, which is called the branch carbon emission flow density of the energy flow, is equal to the nodal carbon intensity of the energy from the origin node. If the energy flow distribution of a network and the carbon intensity of all of the energy producers in the network are known, the NI of the source node is generally easy to calculate, and the corresponding carbon emission flow of each energy flow from this source node to other nodes can be found. The NI of more nodes can be calculated until the NI of all nodes is known. Using these results, the carbon emission flow distribution can be obtained. The power network in China has been divided into six areas. Each power system area can be treated as a node of this network, as both a source and a consumer. The topology and direction of energy flow of power systems in China are shown in Figure 6.
Figure 6. Power network structure and corresponding energy flow diagram in China.
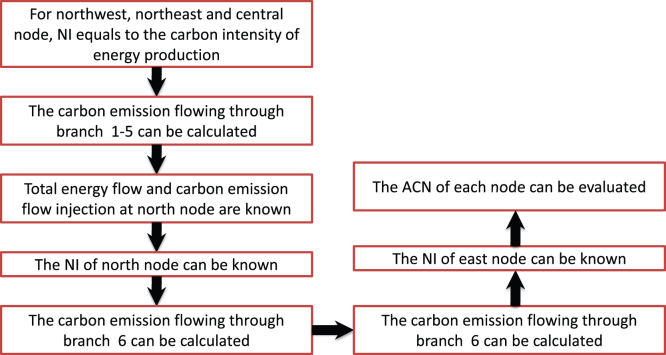
The method of calculating the carbon emission flow distribution according to an energy flow diagram in the Chinese power system can be described using the following chart in Figure 7.
Figure 7. According to the electrical energy generation in each area, the NI of the northwest, northeast, and central nodes can be obtained first.
If the corresponding amount of carbon emission flow can be found, then the NI of the north and south nodes can be obtained. Finally, the NI of the east node can be calculated according to the calculated NI of the north and central power systems. On this basis, the ACN of each area can be evaluated.
Author Contributions
Prof. KCQ conceived the original ideas presented in this paper. ZTR and CQX wrote the main manuscript text and figures. XQY and JZ completed the data sorting and calculations. Prof. XQ provided certain theoretical guidance. All authors reviewed the manuscript.
Acknowledgments
This research was supported in part by the National High-Tech Research and Development Program (863 Scheme) (2011AA05A101), National Natural Science Foundation of China (No 51077077,51107059)and Specialized Research Fund for the Doctoral Program of Higher Education(20100002110007). We also thank Professor Feng Zongxin (Department of Foreign Languages, Tsinghua University) for his valuable suggestions on the writing style of this article.
References
- IPCC. Intergovernmental Panel for Climate Change Fourth Assessment Report. (Cambridge Univ. Press, Cambridge, U.K., 2005). [Google Scholar]
- Weaver A. J. Toward the Second Commitment Period of the Kyoto Protocol, Science 332. 795–796 (2011). [DOI] [PubMed]
- Secretary of State for Trade and Industry. Our Energy Future-Creating a Low Carbon Economy (Energy White Paper, London, U.K., Feb. 2003). [Google Scholar]
- Committee on Climate Change. Building a Low-Carbon Economy-The UK's Contribution to Tackling Climate Change (The Stationary Office, London, U.K., Dec. 2008). [Google Scholar]
- Stern N. The Economics of Climate Change: The Stern Review (Cambridge Univ. Press, Cambridge, U.K., 2007). [Google Scholar]
- Chameides W. &. Oppenheimer M. Carbon Trading Over Taxes. Science 315, 1670 (2007). [DOI] [PubMed] [Google Scholar]
- International Energy Agency, World Energy Outlook 2007/2008 (OECD/IEA, Paris, 2007/2008).
- Kramer G. J. & Haigh M. No quick switch to low-carbon energy. Nature 462. 568–569 (2009). [DOI] [PubMed] [Google Scholar]
- Tollefson J. How green is my future?. Nature 473. 134–125 (2011). [DOI] [PubMed] [Google Scholar]
- Tollefson J. Low-cost carbon-capture project sparks interest. Nature 469. 276–277 (2011). [DOI] [PubMed] [Google Scholar]
- Tollefson J. Japan faces power struggle. Nature 472. 143–144 (2011). [DOI] [PubMed] [Google Scholar]
- Fargione J., Hill J., Tilman D., Polasky S. & Hawthorne P. Land Clearing and the Biofuel Carbon Debt. Science 319, 1235–1237 (2008). [DOI] [PubMed] [Google Scholar]
- Atkinson G., Hamilton K., Ruta G. & Mensbrugghe D. Trade in ‘virtual carbon’: Empirical results and implications for policy. Global Environmental Change 21, 563–574 (2011). [Google Scholar]
- Gavrilova O., Jonas M., Erb K. & Haberl H. International trade and Austria's livestock system: Direct and hidden carbon emission flows associated with production and consumption of products. Ecological Economics 69, 920–929 (2010). [Google Scholar]
- Dexia Group. Pricing Carbon in Hydrocarbon Portfolios (2009). [Google Scholar]
- Song J. S. & Lee K. M. Development of a low-carbon product design system based on embedded GHG emissions. Resources, Conservation and Recycling 54, 547–556 (2010). [Google Scholar]
- Stahls M., Saikku L. & Mattila T. Impacts of international trade on carbon flows of forest industry in Finland. Journal of Cleaner Production 19, 1842–1848 (2011). [Google Scholar]
- International Energy Agency, World Energy Outlook 2007: China and India Insights. (IEA, Paris, France: OECD 2007).
- Chen Q. X., Kang C. Q., Xia Q. & Zhong J. Power generation expansion planning model towards low-carbon economy and its application in China. .IEEE Trans. Power Syst. 25, 1117–1125 (2010). [Google Scholar]
- Development Planning Department of National Energy Administration. .National Energy Strategy for scientific development to 2030 (2009). [Google Scholar]
- Anonymous. Carbon flows: the emissions omitted.: the usual figures ignore the role of trade in the world's carbon economy. Economist 399, 62 (2011). [Google Scholar]
- Anonymous. Carbon footprints: following the footprints. Economist 399, 14 (2011). [Google Scholar]
- Ford L. R. & Fulkerson D. R. Flows in Networks (Princeton, N.J.: Princeton University Press, 1962) [Google Scholar]
- Ahuja R. K. Magnant T. L. Orlin J. B. Network Flows: theory, algorithms, and applications (Englewood Cliffs, N.J.: Prentice Hall, c1993). [Google Scholar]


