Abstract
Fine/ultrafine particles can easily reach the pulmonary acinus, where gas is exchanged, but they need to mix with alveolar residual air to land on the septal surface. Classical fluid mechanics theory excludes flow-induced mixing mechanisms because of the low Reynolds number nature of the acinar flow. For more than a decade, we have been challenging this classical view, proposing the idea that chaotic mixing is a potent mechanism in determining the transport of inhaled particles in the pulmonary acinus. We have demonstrated this in numerical simulations, experimental studies in both physical models and in animals, and mathematical modeling. However, the mathematical theory that describes chaotic mixing in small airways and alveoli is highly complex; it not readily accessible by non-mathematicians. The purpose of this paper is to make the basic mechanisms that operate in acinar chaotic mixing more accessible, by translating the key mathematical ideas into physics-oriented language. The key to understanding chaotic mixing is to identify two types of frequency in the system, each of which is induced by a different mechanism. The way in which their interplay creates chaos is explained with instructive illustrations but without any equations. We also explain why self-similarity occurs in the alveolar system and was indeed observed as a fractal pattern deep in rat lungs (Proc. Natl. Acad. Sci. USA. 99:10173–10178, 2002).
Keywords: recirculation, Poincaré section, tangle, stretch and fold, self-similarity
1. INTRODUCTION
When a large number of aerosol particles enter the lungs in each breath, it is mostly the fine and ultrafine particles that reach the gas exchange region of the lungs. What fraction of the inhaled particles (e.g., particulate pollutants or therapeutic drug particles) actually deposits on the alveolar surface depends on how the particle-laden tidal air mixes with the alveolar residual gas, so mixing can have enormous physiological and pathophysiological consequences.
Even today, the most widely-used models of aerosol mixing (e.g., ICRP, 1994) cannot explain the transport of inhaled fine particles in the pulmonary acinus in a way that accords with experimental observations such as (Heyder et al., 1988). The most fundamental error in these classical models is that the possibility of flow-induced mixing is excluded a priori; for instance, Davies (1972) states, “Mixing between tidal and reserve air takes place in the dead space, above the respiratory bronchioles. In the alveolated regions there is no mixing…..” Such models are based on a result from fluid mechanics: quasi-steady zero Reynolds number flow (Stokes flow) is kinematically reversible when the motion of the fluid’s boundaries is kinematically reversible (Taylor, 1960). Because acinar airflow has a very low Reynolds number (Pedley, Schroter, & Sudlow, 1977) and the basic mode of the acinar wall motion is kinematically reversible (Gil & Weibel, 1972; Ardila, Horie & Hildebrandt, 1974; Gil et al., 1979; Miki et al., 1993; Weibel, 1986), this assumption appears to be reasonable at first sight. However, the classical view of acinar fluid mechanics does not consider the details of local structure of alveolar flow. Moreover, it is well-established that chaotic transport (which is essentially irreversible) can occur in a wide range of flows at arbitrarily low Reynolds number (see Ottino, 1989 for examples).
It is reasonable to ask whether diffusion will enable particles to cross alveoli rapidly; where this happens (as it does for gases such as O2 and CO2), the details of the flow are largely irrelevant. The diffusivity in air of submicron particles, say from 0.5 µm down to 10 nm in diameter, is from around 10−7 to 10−4 cm2/sec respectively. Therefore, the Péclet number, which expresses the importance of airflow-mediated transport relative to diffusive transport, is much larger than unity in the acinus during normal breathing. This indicates that particle mixing and deposition in the acinus is largely determined by the acinar airflow pattern. Weak diffusion may allow a particle to sample different parts of the pattern before it is deposited or ejected from the acinus (Laine-Pearson & Hydon, 2008), but the impact of this upon transport and deposition cannot be determined until the underlying flow is known. In essence, the flow provides a template for the transport of submicron particles, to which diffusion can be added as a weak perturbation. Throughout this paper, we restrict attention to particles that are carried passively with the flow, ignoring the effects of diffusion and particle inertia. We will also treat the flow as incompressible; this is an excellent approximation, because the maximum acinar flow speed is very much less than the speed of sound in air.
Over a decade ago, the first author and his group started to investigate more closely the fluid mechanics in the pulmonary acinus. We began by examining the effects of cyclic wall motion on acinar flow irreversibility (Tsuda, Henry, & Butler, 1995). We solved numerically low Reynolds number flow in an axisymmetric alveolated duct model and found that, provided the expanding and contracting alveoli are deep enough for recirculation to occur, the flow exhibits the following hallmarks of chaos. We observed a stagnation saddle point within the region in which the flow recirculates. The trajectories of particles that pass close to such a saddle point are complex; they are highly entangled and twisted, in a way that rapidly stretches and folds any sheet of particles, in much the same way that pastry dough is stretched and folded repeatedly to create flaky pastry. Consequently, the trajectories of nearby particles eventually diverge rapidly; this 'chaotic mixing' mechanism is highly efficient.
In a subsequent study (Henry, Butler, & Tsuda, 2002), we simulated the behavior of a tracer bolus (i.e., a cloud of fluid particles) in an axisymmetric acinar model with multiple alveoli and showed that a bolus evolved into fractal-like patterns after a few cycles. In parallel with these axisymmetric studies, we also solved Stokes flow in a fully three-dimensional alveolus model with cyclically expanding/contracting walls (Haber et al., 2000), confirming basic features of alveolar flow with a characteristic vortex and an associated stagnation saddle point in the alveolar flow field.
On the experimental side, both physical model and animal model experiments have been performed (Tsuda, Otani, & Butler, 1999; Tippe & Tsuda, 2000; Tsuda et al., 2002; Karl, Henry, & Tsuda, 2004). For instance, using a large-scale axisymmetric alveolated duct model with moving walls, we confirmed a key prediction of our numerical analyses; namely, the presence of recirculation in an expanding (and contracting) alveolated geometry (Tippe & Tsuda, 2000). Developing a new visualization technique for physiological flows, we also demonstrated how inhaled tidal air and residual alveolar gas interact kinematically in animal lungs (Tsuda et al., 2002); we also found substantial alveolar flow irreversibility with stretched and folded fractal patterns, which lead to a marked increase in mixing. These experimental findings support our prediction that chaotic alveolar flow governs flow kinematics in the pulmonary acinus, and hence it determines the transport and deposition of inhaled fine particles.
However, there remains a substantial gap in the current understanding of acinar chaotic mixing by most biologists. We believe that this is mainly because of a lack of an accessible explanation of the highly mathematical concept of mixing by Hamiltonian chaos. Currently available explanations are either too mathematical, taking a highly specialized approach, or too superficial to impart any meaningful knowledge of basic mechanisms. The objective of this work is to achieve the middle ground, bridging biology and mathematics. We will describe the minimal essential components of this theory to extract the basic physics of acinar chaotic mixing, using instructive illustrations, but no equations. The ultimate goal of this work is to lead general readers of this journal (general biologists) to a basic understanding of chaotic mixing and thus to explain why this phenomenon occurs in the pulmonary acinus.
To keep our explanation of Hamiltonian chaos as simple as possible, we will assume that each particle's motion in the recirculating alveolar flow is restricted to a two-dimensional plane that is parallel to the ductal flow which drives the recirculation. Even though this is not so, it provides a foundation from which we can begin to understand chaotic mixing in the fully three-dimensional flow, as we discuss towards the end of the paper.
2. OVERVIEW OF ALVEOLAR FLOW
Our claim that chaotic mixing can occur in the acinus uses the fact that there are two kinds of frequency in the system, which are induced by two different mechanisms – it is their interplay that can create chaos.
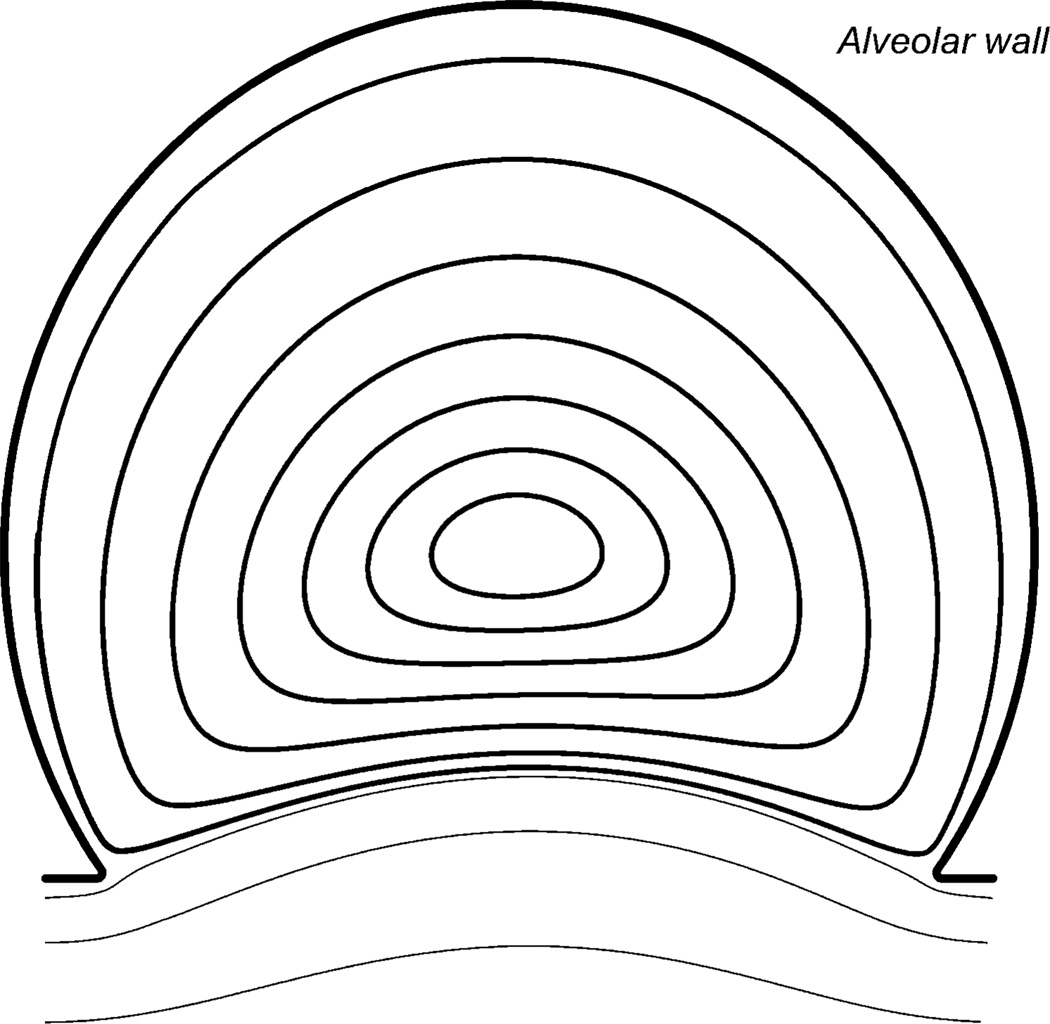
One type of frequency (f1) is associated with recirculation in the alveoli. If recirculation were the only type of fluid motion, particles that are carried passively with the flow would move around the alveolar cavity on closed trajectories called recirculation orbits, as shown schematically (in cross-section) in Fig. 1. The recirculation frequency f1 for such a trajectory is the number of cycles around it that a particle completes per unit time; this frequency depends on which orbit is chosen. For instance, the recirculation frequency will be relatively small on orbits that lie very close to the alveolar wall, where the flow is slow; the frequency is greater closer to the center of the alveoli, where the flow is faster and the orbit length is shorter. It is important to note that the recirculation frequencies are intrinsic to the lung, depending on geometric factors such as the alveolar cavity shape and the size of the alveolar opening.
Fig. 1.
Schematic of the recirculating alveolar flow pattern calculated in an asymmetric alveolar duct model, which is driven by flow past the alveolar entrance [modified from Tsuda et al., 1995].
Flow past the opening is produced by breathing, which is externally determined by diaphragm and rib cage motion (controlled by the central nervous system). Furthermore, breathing causes the alveoli to expand and contract somewhat at the breathing frequency, f2.
The motion of a particle depends on the ratio f1/f2; roughly speaking, this ratio dictates whether or not a particle will follow a chaotic path, as is explained in detail later. For now, it suffices to state that at certain ratios, when the frequencies f1 and f2 are said to be resonant, the interaction between the frequencies produces a net drift. This drift results in Hamiltonian chaos, except where it produces no qualitative change to the particle trajectories. The key to understanding chaotic mixing in the alveolus is to realize that when the Reynolds number1 (Re) is zero and the alveolar walls are stationary, passive particles in the alveoli simply recirculate. In this case, resonance does not produce a qualitative change in particle trajectories: each particle moves back and forth on a single (closed) path forever. However, wall motion (Tsuda, Henry, & Butler, 1995; Henry, Butler, & Tsuda, 2002; Laine-Pearson & Hydon 2006), airflow inertia (Tsuda, Henry, & Butler, 1995; Henry, Butler, & Tsuda, 2002; Henry, Laine-Pearson, & Tsuda, 2009) and a small amount of geometric hysteresis (Haber et al., 2000; Haber & Tsuda, 2006) all perturb the particle motion in a way that depends on the breathing frequency f2 but not on f1. Each of these perturbations produces qualitative changes in those trajectories where f1 and f2 are resonant; surprisingly, these changes are not strongly dependent on the cause of the perturbation. They are described by the mathematical theory of ‘perturbed Hamiltonian dynamical systems.’ Therefore we use the terms ‘unperturbed system’ and ‘base model’ for Stokes flow with alveolar recirculation and cyclically oscillating ductal flow alone. When wall motion and/or the airflow inertia is included, we describe the system as perturbed.
3. UNPERTURBED SYSTEM (BASE MODEL)
3.1 Trajectories lie on a torus
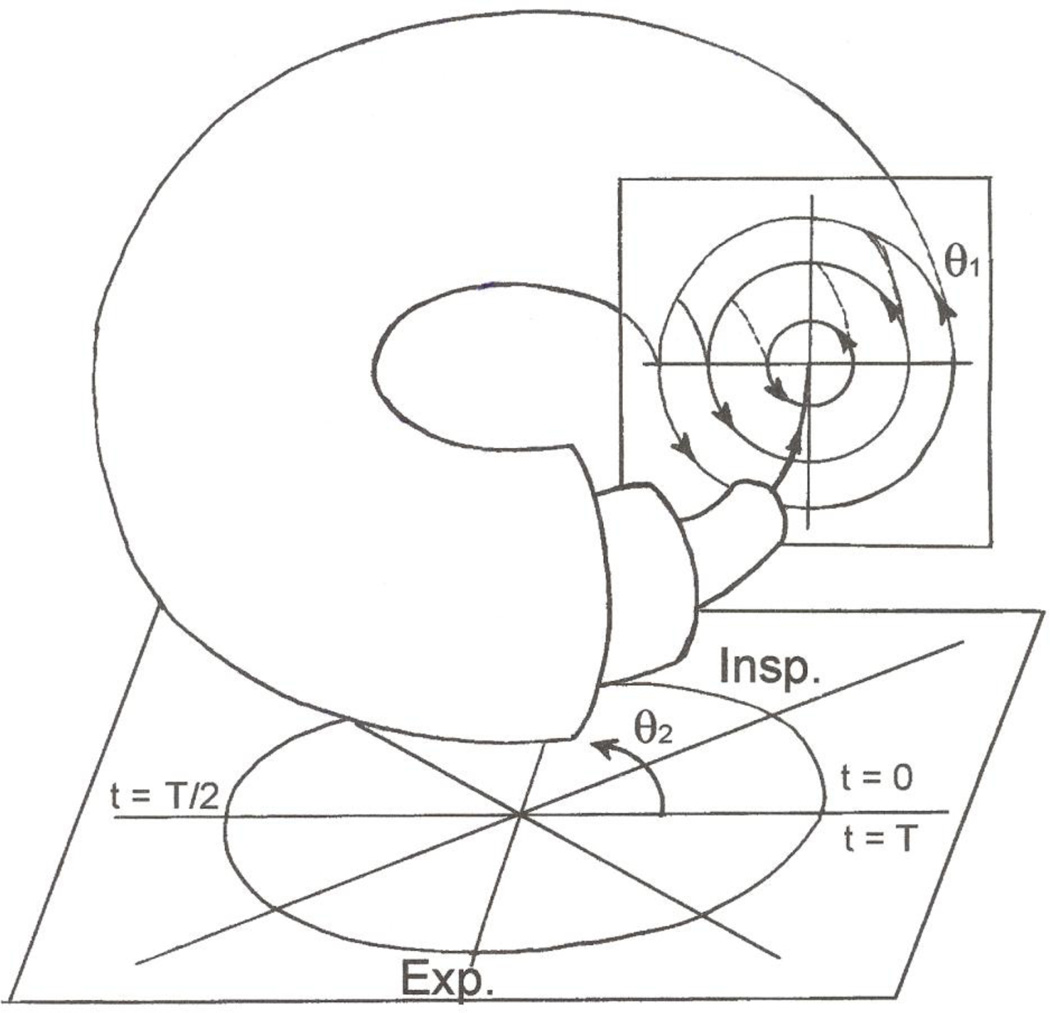
The interplay between the two kinds of frequencies (f1, f2) determines the motion of particles during a breathing cycle; this can be visualized schematically2 using nested tori (Fig. 2), with coordinates (I1, θ1, θ2). Here θ2 represents the phase in the breathing cycle: inspiration (marked Insp.) takes place between 0 and T/2; this is followed by expiration (marked Exp.) to time T, when the cycle begins again. For each value of θ2, the cross-section gives an instantaneous snapshot of the particles that lie on each orbit, which is a circle of radius I1. As time progresses, each particle moves around its orbit; its angle to the horizontal is θ1(t). So for each fixed I1, a train of particles moves around the circle. By introducing the phase as an extra variable, we are able to visualize each particle’s motion as a trajectory on the torus with the appropriate I1 (Fig. 3, left). The passage of time is marked by an increase in phase, and by the change of the angle θ1(t) (see Fig. 3, right). So the trajectory on the torus looks like a thread that winds around the torus, passing through the hole in the middle once every time the orbit is completed.
Fig. 2.
Nested tori; the minor circles (I1, θ1) represent different alveolar recirculation orbits and θ2 is the phase in the breathing cycle, whose period is T.
Fig. 3.
The torus surface; Left: an example of a particle path on a torus; Right: the minor and major circles that are used to construct a torus surface.
This idea, and each of the results that follow, holds whenever an orbit can be deformed continuously into a circle; such an orbit may look like very a squashed circle indeed! So, for the remainder of the paper, we use the term 'circle' to describe any simple closed curve in the plane. The 'angle' θ1(t) now has nothing to do with the horizontal; it is merely a coordinate that identifies where a given particle is located on the 'circle.' Similarly, a 'torus' is obtained by supplementing a 'circle' with the phase variable θ2.
The alveolar cavity is packed with a family of orbits with different frequencies (Fig.1). The recirculation frequency f1 increases smoothly as the center of an alveolus is approached; consequently, between any two orbits with recirculation frequencies f1a and f1b, there lies an orbit with any specified intermediate frequency.
3.2 Rational or irrational frequency ratio
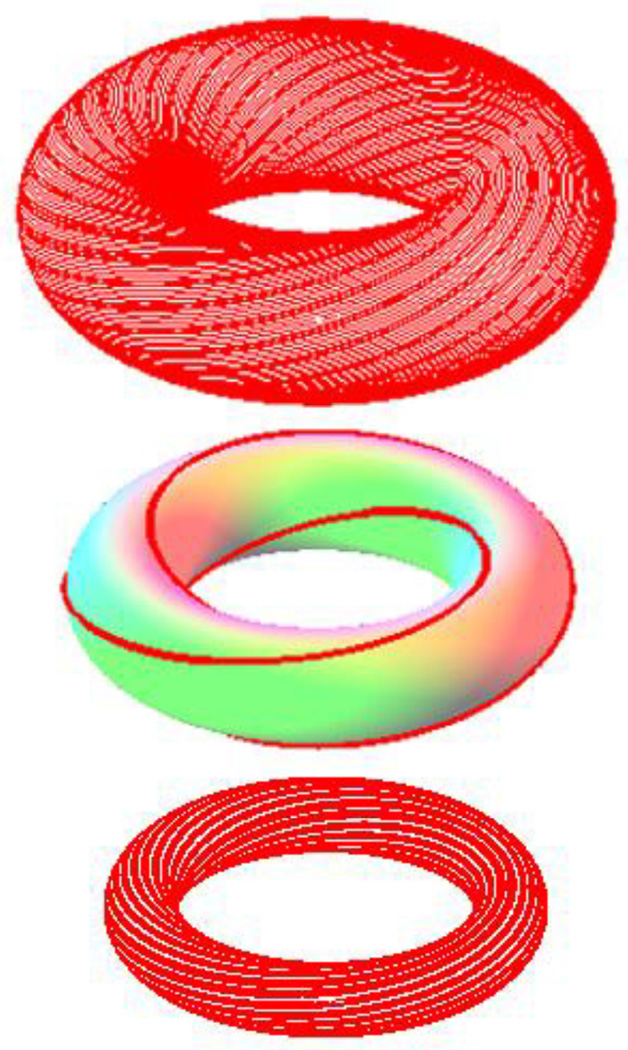
There are two qualitatively different types of unperturbed particle motion, depending on which recirculation orbit a particle is traveling on. We will include the phase for the rest of this subsection, so that we can think about which torus the particle moves on. Then the thread analogy is helpful: either the thread eventually joins up with itself forming a finite loop around the torus, or it continues winding around the torus forever (see Fig. 4). The distinction can be made by whether the ratio of the two frequencies (f1/f2) is a rational number or an irrational number3.
Fig. 4.
Rational orbit with p = 2 and q = 3 (Middle, radius is IB) and two irrational orbits (Top and Bottom, radii are IA and IC respectively); IA>IB>IC.
A 'rational torus' is one for which the ratio of frequencies (f1/f2) is rational, so that the frequencies are resonant. For such a torus, one can always choose time units such that f1 = p and f2 = q, where p and q are integers. The particle comes back to its original position after p revolutions with respect to the angular coordinate θ1 and after q revolutions with respect to the phase coordinate θ2. The trajectory is closed (that is, the thread joins up), because it repeats its motion and phase after p rotations along the alveolar recirculation orbit and after q breathing cycles (Fig. 4, Middle).
On the other hand, for 'irrational tori,' for which the ratio of frequencies (f1/f2) cannot be expressed as the ratio of two integers, the particle never comes back to its original position. The trajectory cannot ever close (Fig. 4, Top and Bottom).
The recirculation frequency f1 varies continuously from one torus to the neighboring tori, whereas the breathing frequency f2 is fixed. Therefore the ratio f1/f2 varies continuously and so any set of nested tori will contain both rational and irrational tori. The distinction between rational and irrational tori is important, because rational (resonant) tori break into chaos under perturbations while ‘sufficiently irrational’ tori remain as tori (although they may deform).
3.3 Poincaré section
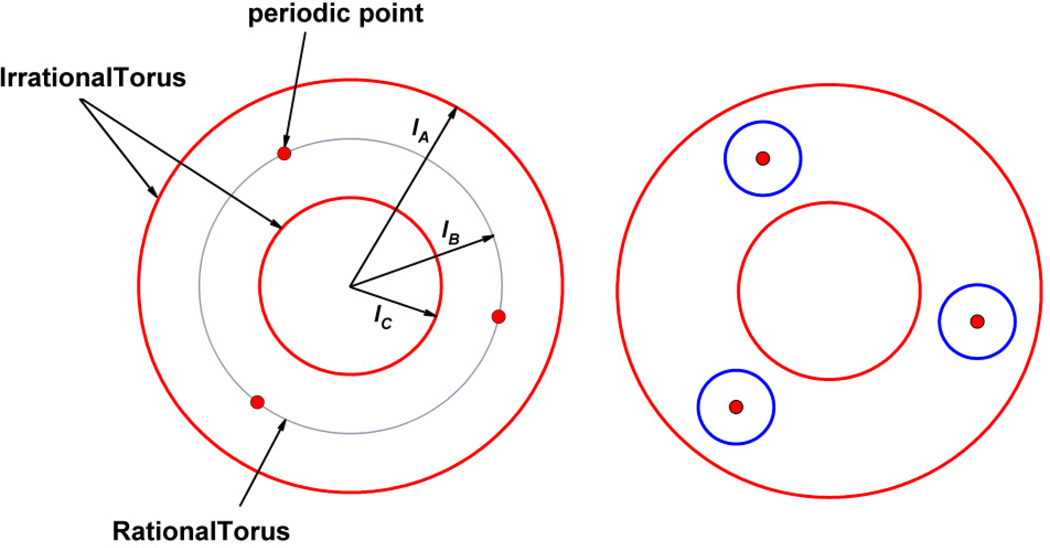
Because it is difficult to trace the 3-dimensional particle orbit on the curved surface of a torus, we introduce a powerful method – the idea of the Poincaré section. This is a plot of the points where one (or several) particle’s trajectory on the torus intersects the surface θ2 = 0; see Fig 5 (Left). In other words, it is a trace of the positions in the alveolar cross-section of one or more particles, recorded at the beginning of each inspiration (though any other fixed phase would do as well).
Fig. 5.
Two Poincaré sections at θ2= 0; Left: a cross-section of three unperturbed tori (the periodic points – shown as dots – on the rational torus – shown as thin-line circle – denote where a particle’s trajectory has passed in this plane); Right: after applying the perturbation the rational torus (thin-line circle in left-hand figure) is replaced by a new structure – a very simple schematic of this structure is illustrated by a cross-section of three small circles.
Rational torus – periodic points
A particle on a rational torus returns to its original position after p revolutions of θ1 and q revolutions of θ2; the particle then traces the same trajectory on the torus repeatedly. In the Poincaré section, this trajectory appears as a set of q ‘periodic points,’ which is determined by the particle’s initial position.
Irrational torus – quasiperiodic orbit
A particle on an irrational torus will never come back to its original position at the original phase and therefore can never repeat the same orbit. In this case, the trajectory on the torus is called quasiperiodic. In the Poincaré section, this corresponds to an infinite set of non-periodic points; for any particular starting point. The set appears to fill a circle after many revolutions of θ1 and θ2 have been completed.
4. PERTURBED SYSTEM
Now, let us perturb the system. As described above, the perturbations include alveolar wall motion, airflow inertia (Reynolds number), and geometric hysteresis in the respiratory physiology. Surprisingly, the Poincaré section undergoes a dramatic qualitative change even when the perturbation is infinitesimal.
4.1 Irrational tori
Irrational tori can be split into two categories, which determine the fate of these tori when their system is perturbed infinitesimally. The distinction is between irrational numbers that can be well-approximated by rational numbers whose denominator is small (which are ‘insufficiently irrational’) and those that cannot, which are classed as ‘sufficiently irrational’. This terminology comes from number theory (Tabor, 1989).
Sufficiently irrational tori
Irrational tori for which f1/f2 is sufficiently irrational survive infinitesimal perturbation and remain essentially intact4; although they may deform, trajectories on them continue to resemble closed curves in the Poincaré section.
Insufficiently irrational orbits
Tori for which f1/f2 is insufficiently irrational react to the perturbation similarly to the nearest rational torus whose denominator is small (see below). This is unsurprising, because these tori are very near neighbors. What is more surprising is that the smaller the denominator is for a rational torus, the greater is its region of influence. It ‘swallows’ the neighboring insufficiently irrational tori (and the neighboring rational tori whose denominator is large), creating instead a highly complex structure, which we describe next.
4.2 Rational orbits
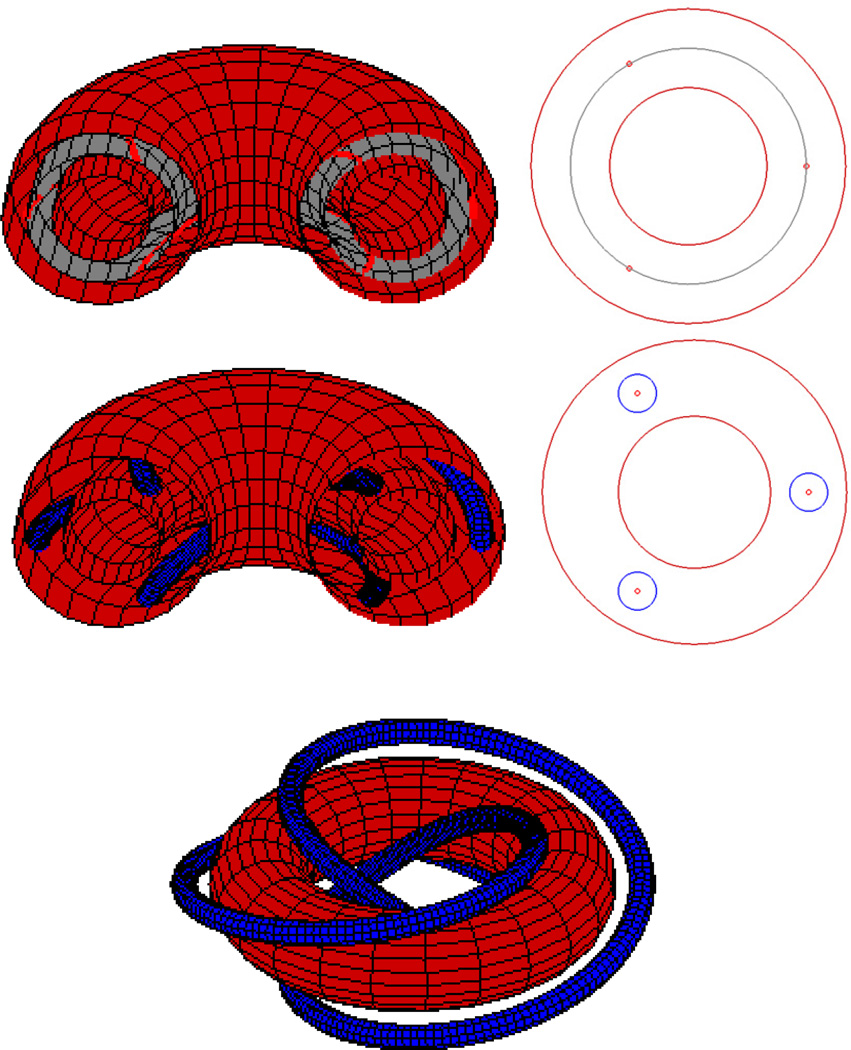
Rational tori cannot persist when a perturbation is applied. These tori, and the surrounding insufficiently irrational tori, break and are replaced by a complex pattern of chaos intermingled with regularity. The regularity occurs because an orbit of a particle drifts a little bit from the original rational torus due to an applied perturbation, but the particle still intersects the Poincaré section near the periodic points, forming a circle around the periodic points on the Poincaré section; an example is given in Fig. 5 (Right).
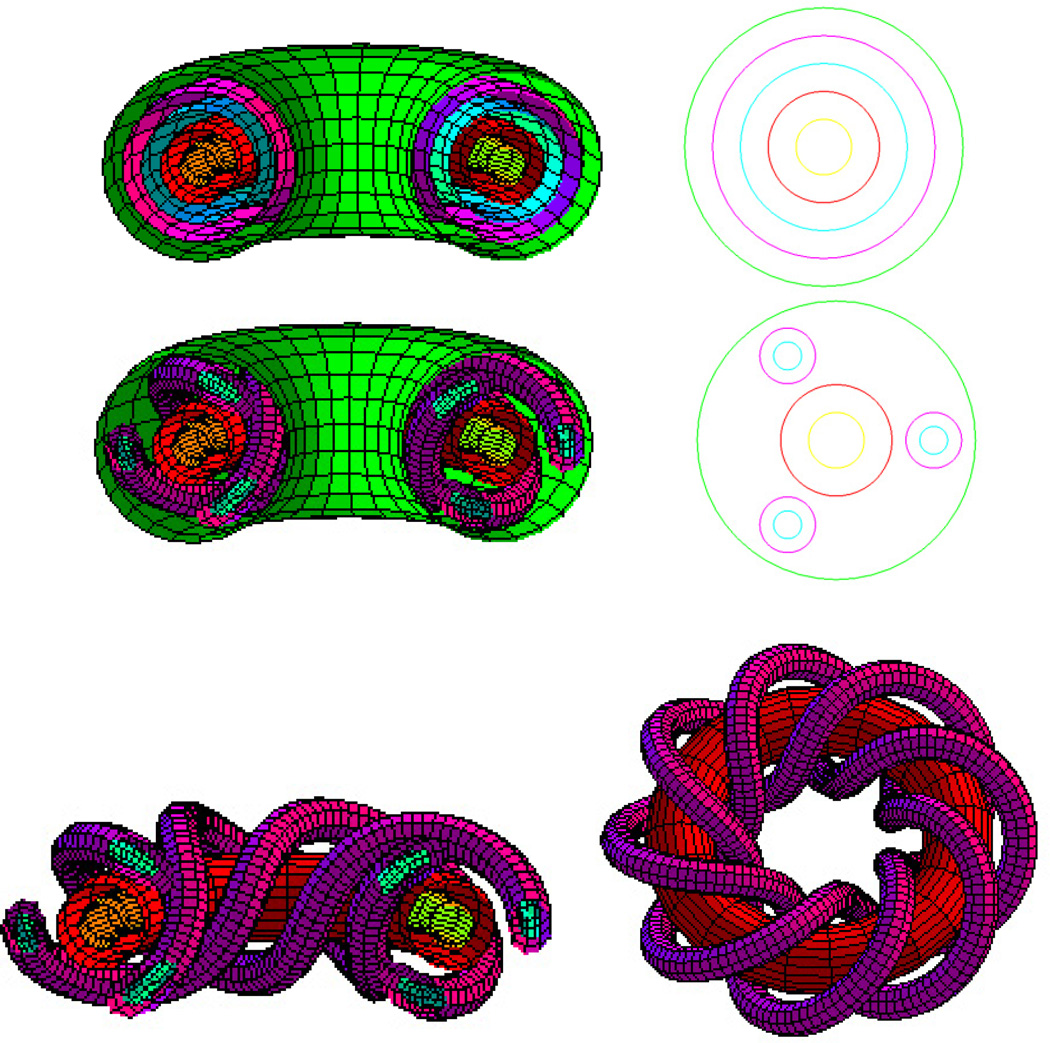
Before continuing with this explanation, let us see how the perturbation, which produces circles on the Poincaré section Fig. 5 (Right), affects the 3-dimensional torus structure. Fig. 6 gives an example for three tori. When the system is perturbed, the two sufficiently irrational tori are persistent but the rational torus has been replaced by a tube-like object that winds around the inner torus but is encased by the outer torus. Fig. 7 shows the same effect for five tori.
Fig. 6.
Top: the three tori of Fig. 5 before perturbation [we denote the red (outer and inner) ones as irrational and the gray (middle thin) one as rational) with cross-section; Middle: the three tori after perturbation (the gray torus has been replaced by a blue tube-like object that winds around the inner red torus but is encased by the outer red torus) with cross-section; Bottom: stripping away the outer torus shows the tube-like object.
Fig. 7.
Top: five tori before perturbation (we denote the green, red and yellow tori as irrational and the purple and blue tori as rational) with cross-section; Middle: the five tori after perturbation (the purple and blue tubes replace the tori) with cross-section; Bottom Left: stripping away the outer torus shows the tube-like objects; Bottom Right: full view of the purple tube wound around the red torus.
4.3 Direction of particle motion on the closed curves
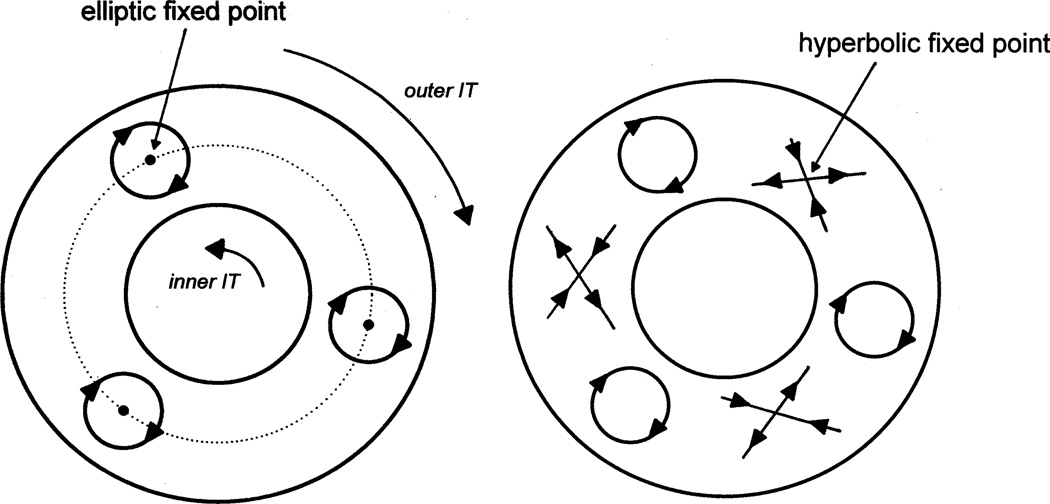
Newly developed tube-like structures (a decadence of rational tori) are bounded by deformed sufficiently irrational tori. Now, let us consider the behavior (frequency and direction) of rotation of those inner/outer irrational tori and the original rational torus appearing in Fig. 5. Recall that the alveolar recirculation frequency increases toward the center of an alveolus. Therefore particles on the inner irrational torus rotate the fastest; those on the rational torus rotate more slowly, and those on the outer irrational torus rotate the slowest. Suppose for definiteness that all particles are rotating counter-clockwise. If we look at the frequency differences from the rational torus, particles on the inner irrational torus appear to rotate counterclockwise, while those on the outer irrational torus rotate clockwise (see Fig. 8, Left). Considering the opposing directions of the inner/outer irrational tori, as a result, particles on each of the closed curves that surround a periodic point will rotate clockwise. It is important to bear in mind that the apparent direction of motion on the Poincaré section is merely a pale reflection of the complex behaviour of trajectories in 3-dimensional space. Nevertheless, it provides a snapshot that enables us to deduce the existence of chaos, as we now explain.
Fig. 8.
Left: the direction of closed curves – solid outer and inner circles are from irrational tori (IT) and the dotted circle comes from a rational torus; Right: in between the circles that surround elliptic fixed points, other points must exist to balance the direction of movement (of particles) – the points lying at the center of the crosses are hyperbolic fixed points.
4.4 The existence of unstable points
The points around which particles appear to rotate on closed curves (in the Poincaré section) are called ‘elliptic fixed points’ (Fig. 8, Left). These points are Lyapunov stable; roughly speaking, this means that any trajectory that starts near such a point remains near to it for all time5. Now, let us consider the flow of the arrows, i.e., the local direction of particle movement, in Fig. 8. By tracing the direction of the arrows for the closed curves around the stable points, it follows that another set of points that are in between the elliptic points must exist. This is because all of the particles on closed curves in a single perturbed orbit rotate in the same direction (‘clockwise’ - in this example). Consequently, as the flow is continuous, there is a meeting-point between the flows that rotate about each elliptic fixed point6 (Fig. 8, Right). Each meeting-point is called a ‘hyperbolic fixed point’; in Hamiltonian dynamical systems, such points are unstable, because each one has a direction in which the flow is directed away from it. As we shall see, hyperbolic points are the origins of Hamiltonian chaos.
4.5 Hyperbolic points, lobes and heteroclinic tangles
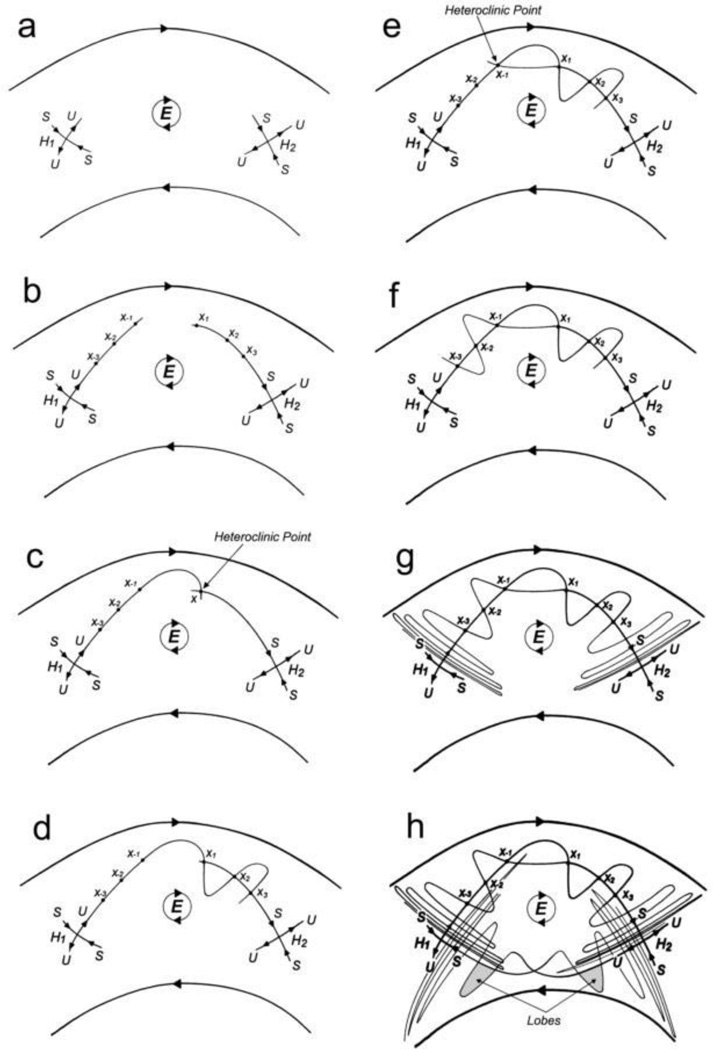
We now focus on the phenomena that occur close to a hyperbolic point, H. For the sake of our discussion, consider two hyperbolic points (H1 and H2) in close proximity and the elliptic point (E) that lies between them (Fig. 9a). First, notice the direction of flow near each H; the flow goes into and comes out of H. The curves that point toward H1 and H2 are called ‘stable curves (S)’, and the curves that point away are called ‘unstable curves (U)’. The stable and unstable curves are orbits, so if a particle lies on such a curve at any instant, it remains on the curve forever.
Fig. 9.
This is the interaction of stable and unstable curves.
The question arises: how do these stable (S) and unstable (U) curves intersect each other? We follow the nice explanation given by Nicolis & Prigogine (1989); complementary explanations can be found elsewhere (Tabor, 1989; Ottino, 1989; Lichtenberg & Lieberman, 1992). One possibility would be that S and U join smoothly, forming an arc between H1 and H2 7. However, this is a rather special8 case and only occurs strictly for integrable9 systems. Because our perturbed system is a near-integrable (and thus nonintegrable) system, this highly special case should be disregarded.
The typical behavior of most types of near-integrable systems was discovered by Poincaré and studied later in some detail by Birkhoff and Smale: the stable (S) and unstable (U) curves cross at a point (X) called a ‘heteroclinic point’. Furthermore, they intersect not just once, but infinitely many times, as we now explain. We use the notation Xn to mark all intersection points in the Poincaré section (Figs. 9b–9g); the subscript n denotes the order along S and U in which they occur. After each successive breathing cycle, any particle that lies on the stable curve S in mapped to another point on S .that is closer to H2. Therefore there is a sequence of points X1, X2, X3, …, Xn that lies on the stable curve (S) and converges to H2 as n approaches infinity. Similarly, by looking backwards in time (like playing a movie backwards), one generates a sequence of points X−1, X−2, X−3, ….X−n, that lies on the unstable curve (U) and converges to H1 as n approaches infinity. Fig. 9b illustrates this. [Note: do not assume that a particle at X1 is mapped to X2, which is mapped to X3, etc. As we explain in our discussion of lobes (see below) it turns out (typically) that each intersection point is mapped to the next point but one, so that X1 is mapped to X3, etc.]
So far, we have looked only at the evolution of particles that lie on S and U separately. To see why there must be infinitely intersections between these curves, suppose that there is one intersection X (Fig. 9c); we shall regard this as the point X1. As the heteroclinic point X1 belongs to U and S simultaneously, a particle on it moves after one breathing cycle to another point that belongs to both U and S; the process is repeated with each successive breathing cycle. The same is true for all other heteroclinic points. Therefore the unstable curve (U) must repeatedly intersect the stable curve (S) at X2, X3, …, as shown in Fig. 9d.
Similarly, one can retrace back in time to see that the stable curve (S) intersects the unstable curve (U) at the points X−1, X−2, and so on (Figs. 9e, 9f). Furthermore, Xn must converge to the hyperbolic points H2 (respectively H1) as n approaches positive (respectively negative) infinity, suggesting that there must be infinite numbers of heteroclinic points near to the hyperbolic points H1 and H2 (Fig. 9g).
A second set of heteroclinic points is generated by the other U and S curves emanating from H1 and H2 that lie beneath E. Fig. 9h10 shows both sets of curves and heteroclinic points. There now appears an overlap of curves near the two hyperbolic points. This ‘tangle’ of curves will be explained in more detail below. In 1899 Poincare attempted to draw a similar figure and remarked that: “One is impressed by the complexity of this figure that I will not even try to draw” (Poincare, 1899).
The crossing of unstable and stable curves creates areas called lobes, as shown in Fig. 9h; the area of each alternate lobe is conserved11. Roughly speaking, lobe area is conserved because the flow is incompressible. Each lobe is bounded by the curves U and S; if one takes phase into account, these curves form the boundary of a rope-like region that winds around the torus. No particle can cross the boundary, because once a particle is on a stable or unstable curve (in any Poincaré section, for any phase) it remains there forever. The particles that are in a given lobe remain in every lobe that is formed by later intersections of the initial lobe’s ‘rope’ with the Poincaré section. As the fluid is incompressible, each of these lobes has the same area.
Typically, the above sequence of lobes constitutes the alternate lobes, so there are usually two such sequences intertwined. The reason for this is that the direction of flow close to the stable and unstable curves is preserved. For instance, if the flow is clockwise close to S (and therefore anticlockwise close to U) in one lobe, these directions are reversed in both of the adjacent lobes. The directions in successive lobes alternate, whereas in each ‘rope,’ the particle flow is in a single direction close to S (or U). Thus each lobe is mapped to the next lobe but one. We have already seen that lobe area is preserved at every successive intersection of the ‘rope’ with the Poincaré section, so we must conclude that area is preserved in every alternate lobe. (A helpful aid is to think of any pair of adjacent lobes as a single unit; this is mapped to each successive pair, preserving the lobe areas and the directions of flow of the original pair at each stage.) The argument above also explains why a particle at X1 is mapped to X3 rather than X2.
The preservation of lobe areas has an important consequence: because the distance between the X points becomes shorter and shorter as the heteroclinic points approach H1 and H2, the lobes have to be thinner and thinner, as well as more and more stretched to maintain equal areas. The overlapping of lobes seen in Fig. 9h becomes more and more complicated as the lobes are stretched further and further. Specifically, any part of a lobe that intersects another lobe (with the same directions) does so not just once, but for ever. This is a very complex tangle! Chaotic motion occurs in a tangle12 because the lobes are repeatedly stretched, squashed and folded, rapidly separating the trajectories of particles that began as neighbors. This mechanism is reminiscent of the action of a salt water taffy pulling machine. It is commonly accepted that the existence of heteroclinic points is diagnostic of chaos (Ottino, 1989).
4.6 Self-similarity
To explain the concept of ‘self-similarity’ we return to the tube-like objects of Fig. 6 and Fig. 7. Recall that after perturbation the rational and insufficiently irrational tori do not persist. Instead, the periodic points of rational tori are the seeds for elliptic points and hyperbolic points. Around the elliptic points, we have seen that small circles can form in Poincaré sections and that these circles relate to 3D tube-like objects that are bounded by surviving sufficiently irrational tori.
The small circles are reminiscent of the concentric circles seen for the Poincaré sections of unperturbed tori. This is not a coincidence. To understand why this occurs, we must recall a few details.
Note 1: For a sufficiently small perturbation, most of the tori will survive (these are the sufficiently irrational tori) 13.
Note 2: On perturbation, the rational (and insufficiently irrational) tori will be replaced by a set of alternating elliptic and hyperbolic fixed points14.
On adding an infinitesimal perturbation to a set of concentric circles, Note 1 guarantees that most will survive. Those that do not survive are replaced according to Note 2, which acknowledges that elliptic points will form. As these points are stable points, circles can form in a neighborhood of each elliptic point.
Now, while the system is being perturbed, these newly created elliptic points and their circles are also subject to the perturbation. Circles that are sufficiently irrational are guaranteed to persist according to Note 1; these circles relate to the tube-like objects shown in Fig. 6 and Fig. 7. Those that would have been rational or insufficiently irrational will be taken care of by Note 2 – they are replaced by a set of alternating elliptic and hyperbolic points. Around these elliptic points, a set of circles can form and so on.
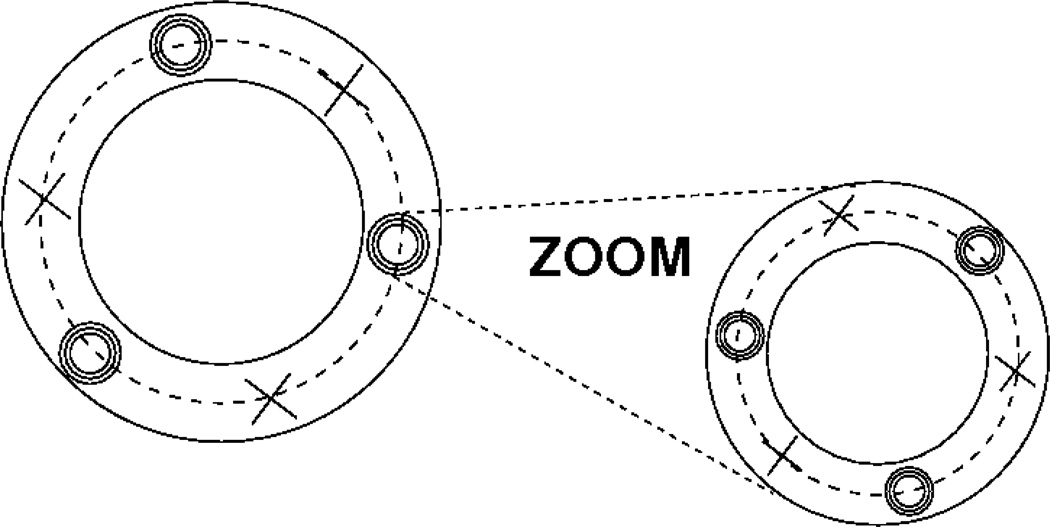
In principle, the process of applying Note 1 and Note 2 simultaneously can be done infinitely many times (i.e. on all scales/magnifications). This means that we could zoom into an island (this is a name commonly used for the region around an elliptic point) and see that it is partly made up of chains of smaller islands. We could then zoom into one of these smaller islands to find, again, that these are partly made up of even smaller chains of islands (Fig. 11). This phenomenon appears on all scales and so we describe such a behavior as ‘self-similar’. (For the 3D picture, imagine that the tube-like objects will be wound by finer tubes, and these tubes will be wound by even finer tubes, and so on and so forth. One could try constructing such a structure by winding a rope around a rubber ring and then winding a piece of string around the rope, and then winding a thread around the string. Even this demonstration would only hint at the level of complexity occurring.)
Fig. 11.
the crosses denote hyperbolic points whereas the groups of small concentric circles are each centered on an elliptic point (it is customary to describe each small circle group as an ‘island’). This illustration shows the self-similarity of the perturbed system: zooming into an island shows that it is made up of regular curves, islands (appearing in a neighbourhood of elliptic points) and intermingled with chaos (originating from around the hyperbolic points) but on a smaller scale. The zooming in can be repeated for the islands on this smaller scale too. In principle, this zooming into islands can be done on all scales.
Therefore, when the system is perturbed, an intricate re-organization occurs. Chaos is seen on all scales, because each time elliptic points are generated, so too are hyperbolic points. But this is a well-organized chaos – it is trapped by regularity15.
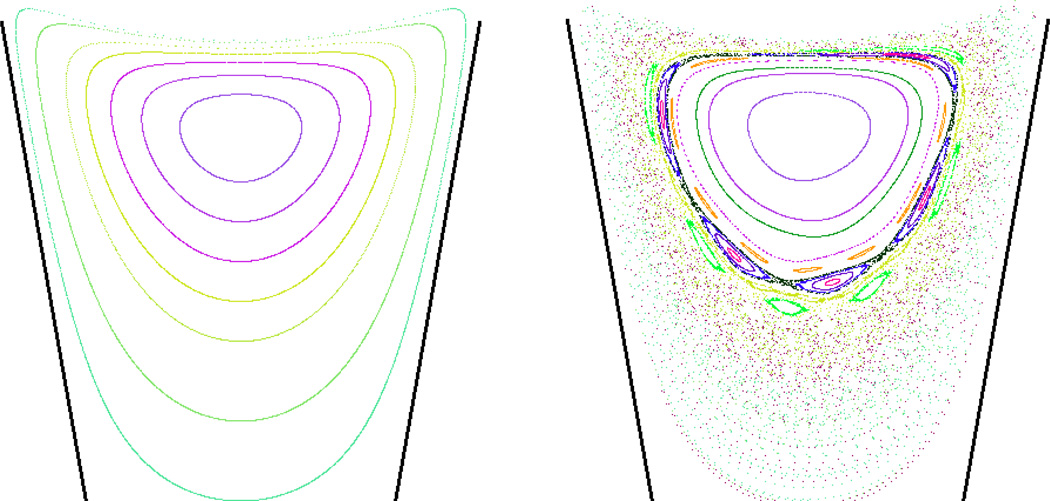
We finish this subsection with an example of organized chaos that occurs in a simple model that combines recirculation in a two-dimensional cavity with oscillating wall motion. Fig. 12 shows Stokes flow in the cavity; each color represents a different particle trajectory. The left-hand figure shows the paths that particles follow when the walls are stationary. The right-hand figure is a Poincaré section that illustrates how particle paths change when the walls oscillate very slightly. On comparison of the left and right figures, some of the original closed curves persist after perturbation but have deformed, while others have broken and are replaced by chaos. Additional trajectories have been added to the right-hand figure for further detail – they show the features that are universal in perturbed Hamiltonian systems, namely chains of islands surrounded by seas of chaos.
Fig. 12.
Poincaré sections of particle transport; each color represents a different trajectory. Left: Stokes flow in a cavity – no perturbation present and seven particle paths shown. Right: The addition of a perturbation by wall motion creates islands in a sea of chaos; eight more particle paths have been added to the original seven for further detail. Similar figures can be seen in Laine-Pearson & Hydon (2006).
4.7 What happens when particle motion is not two-dimensional
As we stated in the Introduction, a major simplifying assumption in the above explanation is that in the recirculating flow, each particle's motion is restricted to a two-dimensional plane. In reality, however, the flow in cavities such as alveoli is three-dimensional. The cross-plane motion is slow relative to the recirculation, and therefore it is reasonable to regard this as an extra perturbation to the case we have already considered. Just as we created a Poincaré section for the two-dimensional motion in a single plane, we can do the same for the whole alveolus, taking a snapshot of particle positions once per breathing cycle. Because the fluid is incompressible, this process creates a volume-preserving map, called a Liouvillian map, which takes each point in the alveolus to its position one breath later.
In three spatial dimensions, the circles that we described in the base model are in fact cross sections of cylinders (with the usual allowance for these to be continuously deformed). Consequently, within the region where recirculation occurs, the base model without cross-plane flow is an example of an integrable two-action, one-angle Liouvillian map. The effects of perturbations on such maps have only recently begun to be understood; see Cartwright et al. (1996) for an accessible account. Briefly, the perturbations due to cross-plane flow, wall motion, etc., cause a particle to stay on a torus in the alveolar space for a while, until it encounters a region of chaos (produced by resonance), when it is able to move to another torus. So a typical particle will alternately exhibit regular and chaotic motion. This type of chaotic mixing is much more effective than when each particle is confined to a plane; it allows particles to move efficiently across the whole alveolus.
5. CONCLUSIONS
The essential structure of the pulmonary acinus is a collection of air pockets where airflow patterns form. When an alveolus is sufficiently deep and a flow passing by its opening is sufficiently strong, recirculation can occur. The theoretical basis for the existence of alveolar chaotic mixing is essentially the complex interplay between this alveolar recirculation and cyclic breathing as we have explained above. From this, therefore, a couple of fundamental conclusions can be readily drawn. (1) There are several hundred million alveoli in human lung (e.g., Weibel, 1963; Ochs et al., 2004) and, according to our recent calculations (Tsuda, Henry, & Butler, 1995, 2008; Henry & Tsuda, 2010), most of the alveoli have recirculating flow. This means that as we breathe, hundreds of millions of alveoli in our lung act as a mixing generator. While each individual unit may be small, the cumulative effect of this enormously large number of mixers is likely to be significant. (2) We have shown, through our past studies (summarized in Tsuda, Henry, & Butler, 2011), that alveolar recirculation is intrinsic to the system. Some lung diseases affect this; for example, enlarged emphysematous alveoli have different alveolar recirculating flow patterns to healthy alveoli (Tsuda, Henry, & Butler, 2011). (3) In the first few years of life, the alveolar shape may have an even more significant role in determining particle transport. As the lungs develop, not only does the number of alveoli increase, but also the shape of each alveolus changes dramatically. Newborn babies have shallow saccular alveoli, in which recirculation does not occur. By the age of two, many of the alveoli are sufficiently deep for recirculation to occur. Consequently there are dramatic changes in alveolar flow and particle mixing as the lungs develop, particularly over the first two years of life.
Fig. 10.
These are the possible scenarios for integrable Hamiltonian systems – curves with arrows pointing towards H are stable, those pointing out are unstable; Left: heteroclinic orbit (or heteroclinic connection); Middle: homoclinic orbit (or homoclinic connection); Right: the curves lead off to infinity.
Highlights.
Chaotic mixing is a potent mechanism in determining the transport of inhaled particles in the pulmonary acinus.
The key to understanding chaotic mixing is to identify two types of frequency in the system, each of which is induced by a different mechanism; their interplay creates chaos.
The paper explains why chaotic mixing of particles needs to occur in the pulmonary acinus, with instructive illustrations but without any equations.
The paper also explains why self-similarity occurs in the alveolar system.
ACKNOWLEDGEMENT
This work was supported by National Heart, Lung, and Blood Institute Grants HL054885, HL070542 and HL074022. We thank the referees for their helpful advice.
Footnotes
Publisher's Disclaimer: This is a PDF file of an unedited manuscript that has been accepted for publication. As a service to our customers we are providing this early version of the manuscript. The manuscript will undergo copyediting, typesetting, and review of the resulting proof before it is published in its final citable form. Please note that during the production process errors may be discovered which could affect the content, and all legal disclaimers that apply to the journal pertain.
Re = UL/ν, where U and L are (respectively) a characteristic velocity and length scale for the flow and ν is the kinematic viscosity of the alveolar gas. Typically, Re < 1 in alveoli; consequently, the convective inertia of the gas produces only a small perturbation to Stokes (zero Re) flow.
It does not matter that inspiration and expiration are not necessarily of the same duration. What is important is that the closed trajectories exist and that breathing is (roughly) periodic in time.
A rational number is a number that can be expressed as a fraction p/q where p and q are integers and q is positive. An irrational number is a number that cannot be expressed as a fraction p/q for any integer p, q. Irrational numbers have decimal expansions that neither terminate nor become periodic.
These persistent tori are guaranteed by KAM (Kolmogorov-Arnol’d-Moser) Theory (Tabor, 1989; Lichtenberg & Lieberman, 1992) and its extensions, provided that the perturbation is sufficiently small. Typically, for alveoli, the perturbation is small enough (Laine-Pearson & Hydon, 2006; Henry, Laine-Pearson, & Tsuda, 2009).
For a strict definition of this type of stability, see page 101 of Ottino (1989).
These points, and the elliptic points, are guaranteed by the Poincaré-Birkhoff Fixed-Point Theorem (Tabor, 1989; Lichtenberg & Lieberman, 1992).
This is called a ‘heteroclinic orbit’ or ‘heteroclinic connection’; see Fig. 10.
Another possibility would be that the S and U from the same point connects back to itself (it creates a loop). This is called a ‘homoclinic orbit’ or ‘homoclinic connection’. However, again, this is a rather special case, and only occurs in integrable systems, thus should be disregarded. The third possibility could be that the S and U do not connect to anything – they extend to infinity. This last possibility also has to be disregarded for periodic systems such as ours. See Fig. 10 for illustrations.
Loosely speaking, the term ‘integrable’ implies that a Hamiltonian system is solvable in principle; however, it does not guarantee that the calculations will be manageable! Classical integrable systems exhibit regular motion, whereas nonintegrable systems have chaotic motion. Therefore integrability is an intrinsic property and not just a matter of whether a system can be explicitly integrated in exact form.
We are fully aware of the fact that a real aerosol particle is subject to stochastic bombardment by neighboring gas molecules (e.g. Brownian motion), which gives rise to diffusion. The closer two particles’ trajectories come to each other, the more rapidly will diffusion blur their independent existence. Therefore, a structure like Fig 9h is not likely to be seen in the real alveoli. However, with Fig. 9h, we are showing the underlying flow phenomena which one needs to consider when dealing with diffusive particles. The weaker the diffusion is, the longer is the time during which the underlying flow structure will be visible.
See page 140 of Ottino (1989) for more details. Our explanation is simplified for clarity; a more complete analysis of transport mechanisms involving lobes can be found in Horner et al. (2002) and Wiggins (1992)
It is called a ‘Smale horseshoe’.
This is due to KAM Theory (Tabor, 1989; Lichtenberg & Lieberman, 1992).
This is due to the Poincaré-Birkhoff Fixed-Point Theorem (Tabor, 1989).
This is typically described as ‘Hamiltonian chaos’.
REFERENCES
- 1.Ardila R, Horie T, Hildebrandt J. Macroscopic isotropy of lung expansion. Respir. Physiol. 1974;20:105–115. doi: 10.1016/0034-5687(74)90100-5. [DOI] [PubMed] [Google Scholar]
- 2.Cartwright JHE, Feingold M, Piro O. Chaotic advection in three-dimensional unsteady incompressible laminar flow. J. Fluid Mech. 1996;316:259–284. [Google Scholar]
- 3.Davies CN. Breathing of half-micron aerosols. II Interpretation of experimental results. J. Applied Physiology. 1972;32(5):601–611. doi: 10.1152/jappl.1972.32.5.601. [DOI] [PubMed] [Google Scholar]
- 4.Gil J, Weibel ER. Morphological study of pressure-volume hysteresis in rat lungs fixed by vascular perfusion. Respiratory Physiol. 1972;15:190–213. doi: 10.1016/0034-5687(72)90098-9. [DOI] [PubMed] [Google Scholar]
- 5.Gil J, Bachofen H, Gehr P, Weibel ER. Alveolar volume-surface area relation in air and saline-filled lungs fixed by vascular perfusion. J. Appl. Physiol. 1979;45:990–1001. doi: 10.1152/jappl.1979.47.5.990. [DOI] [PubMed] [Google Scholar]
- 6.Haber S, Butler JP, Brenner H, Emanuel I, Tsuda A. Flow field in self-similar expansion on a pulmonary alveolus during rhythmical breathing. J. Fluid Mech. 2000;405:243–268. [Google Scholar]
- 7.Haber S, Tsuda A. Cyclic model for particle motion in the pulmonary acinus. J. Fluid Mech. 2006;567:157–184. [Google Scholar]
- 8.Henry FS, Butler JP, Tsuda A. Kinematically irreversible flow and aerosol transport in the pulmonary acinus: a departure from classical dispersive transport. J. Appl. Physiol. 2002;92:835–845. doi: 10.1152/japplphysiol.00385.2001. [DOI] [PubMed] [Google Scholar]
- 9.Henry FS, Laine-Pearson FE, Tsuda A. Hamiltonian chaos in a model alveolus. J. Biomech. Eng. 2009;131:011006(1)–011006(7). doi: 10.1115/1.2953559. [DOI] [PubMed] [Google Scholar]
- 10.Henry FS, Tsuda A. Flow and particle tracks in model acini. J. Biomech. Eng. 2010;132(10):101001(1)–101001(11). doi: 10.1115/1.4002371. [DOI] [PMC free article] [PubMed] [Google Scholar]
- 11.Heyder J, Blanchard JD, Feldman HA, Brain JD. Convective mixing in human respiratory tract: estimates with aerosol boli. J. Appl. Physiol. 1988;64:1273–1278. doi: 10.1152/jappl.1988.64.3.1273. [DOI] [PubMed] [Google Scholar]
- 12.Horner M, Metcalfe G, Wiggins S, Ottino JM. Transport enhancement mechanisms in open cavities. J. Fluid Mech. 2002;452:199–229. [Google Scholar]
- 13.ICRP. ICRP Publication 66, Annals of the ICRP. New York: Pergamon; 1994. Human respiratory tract model for radiological protection: a report of a task group of the International Commission on Radiological Protection. [PubMed] [Google Scholar]
- 14.Karl A, Henry FS, Tsuda A. Low Reynolds number viscous flow in an alveolated duct. J. Biomech. Eng. 2004;126:420–429. doi: 10.1115/1.1784476. [DOI] [PubMed] [Google Scholar]
- 15.Laine-Pearson FE, Hydon PE. Particle transport in a moving corner. J. Fluid Mech. 2006;559:379–390. [Google Scholar]
- 16.Laine-Pearson FE, Hydon PE. The carousel effect in alveolar models. ASME J. Biomech. Engng. 2008;130:021016. doi: 10.1115/1.2903429. [DOI] [PubMed] [Google Scholar]
- 17.Lichtenberg AJ, Lieberman MA. Regular and Chaotic Dynamics. 2nd edition. Springer-Verlag; 1992. [Google Scholar]
- 18.Miki H, Butler JP, Rogers RA, Lehr J. Geometric hysteresis in pulmonary surface to volume ratio during tidal breathing. J. Appl, Physiol. 1993;75:1630–1636. doi: 10.1152/jappl.1993.75.4.1630. [DOI] [PubMed] [Google Scholar]
- 19.Nicolis G, Prigogine I. Exploring Complexity. W.H. Freeman & Co.; 1989. [Google Scholar]
- 20.Ochs M, Nyengaard JR, Jung A, Knudsen L, Voigt M, Wahlers T, Richter J, Gundersen HJG. The number of alveoli in the human lung. Am, J. Respir. Crit. Care Med. 2004;169:120–124. doi: 10.1164/rccm.200308-1107OC. [DOI] [PubMed] [Google Scholar]
- 21.Ottino JM. The Kinematics of Mixing: Stretching, Chaos, and Transport. Cambridge University Press; 1989. [Google Scholar]
- 22.Pedley TJ, Schroter RC, Sudlow MF. Gas flow and mixing in the airways. chapt. 3. In: West JB, editor. Lung Biology in Health and Disease. Bioengineering Aspects of the lung. vol.3. New York: Dekker; 1977. pp. 163–265. [Google Scholar]
- 23.Poincaré H. Les méthodes nouvelles de la mécanique célest. Tome III. Gauthier-Villars; 1899. p. 389. [Google Scholar]
- 24.Tabor M. Chaos and Integrability in Nonlinear Dynamics. Wiley; 1989. [Google Scholar]
- 25.Taylor GI. Low Reynolds Number Flow (16mm film) Newton, MA: Educational Services Inc.; 1960. [Google Scholar]
- 26.Tippe A, Tsuda A. Recirculating flow in an expanding alveolar model: experimental evidence of flow-induced mixing of aerosols in the pulmonary acinus. J. Aerosol Sci. 2000;31:979–986. [Google Scholar]
- 27.Tsuda A, Henry FS, Butler JP. Chaotic mixing of alveolated duct flow in rhythmically expanding pulmonary acinus. J. Appl. Physiol. 1995;79:1055–1063. doi: 10.1152/jappl.1995.79.3.1055. [DOI] [PubMed] [Google Scholar]
- 28.Tsuda A, Otani Y, Butler JP. Acinar flow irreversibility caused by boundary perturbation of reversible alveolar wall motion. J. Appl. Physiol. 1999;86:977–984. doi: 10.1152/jappl.1999.86.3.977. [DOI] [PubMed] [Google Scholar]
- 29.Tsuda A, Rogers RA, Hydon PE, Butler JP. Chaotic mixing deep in the lung. Proc. Natl. Acad. Sci. 2002;99:10173–10178. doi: 10.1073/pnas.102318299. [DOI] [PMC free article] [PubMed] [Google Scholar]
- 30.Tsuda A, Henry FS, Butler JP. Gas and Aerosol Mixing in the Acinus. Respir. Physiol. Neurobiol. 2008;163(1–3):139–149. doi: 10.1016/j.resp.2008.02.010. [DOI] [PMC free article] [PubMed] [Google Scholar]
- 31.Tsuda A, Henry FS, Butler JP. Particle transport and deposition. In: Fredberg J, Sieck G, Gerthoffer W, editors. Comprehensive Physiology, Respiratory Physiology Section. Amer. Physiol. Soc.; 2011. (in review) [Google Scholar]
- 32.Weibel ER. Morphometry of the Human Lung. Heidelberg, New York: Springer-Verlag/Academic Press; 1963. [Google Scholar]
- 33.Weibel ER. Functional morphology of lung parenchyma. Sect. 3, vol III, Chap. 8. In: Fishman AP, editor. Handbook of Physiology, The Respiratory System. Bethesda, MD: Am. Physiol. Soc.; 1986. pp. 89–111. [Google Scholar]
- 34.Wiggins S. Chaotic Transport in Dynamical Systems. New York: Springer-Verlag; 1992. [Google Scholar]


