

Abstract
EGFR activation is both a key molecular driver of disease progression and the target of a broad class of molecular agents designed to treat advanced cancer. Nevertheless, resistance develops through several mechanisms, including activation of AKT signaling. Though much is known about the specific molecular lesions conferring resistance to anti-EGFR–based therapies, additional molecular characterization of the downstream mediators of EGFR signaling may lead to the development of new classes of targeted molecular therapies to treat resistant disease. We identified a transcriptional network involving the tumor suppressors Krüppel-like factor 6 (KLF6) and forkhead box O1 (FOXO1) that negatively regulates activated EGFR signaling in both cell culture and in vivo models. Furthermore, the use of the FDA-approved drug trifluoperazine hydrochloride (TFP), which has been shown to inhibit FOXO1 nuclear export, restored sensitivity to AKT-driven erlotinib resistance through modulation of the KLF6/FOXO1 signaling cascade in both cell culture and xenograft models of lung adenocarcinoma. Combined, these findings define a novel transcriptional network regulating oncogenic EGFR signaling and identify a class of FDA-approved drugs as capable of restoring chemosensitivity to anti-EGFR–based therapy for the treatment of metastatic lung adenocarcinoma.
Introduction
The complete molecular and functional characterization of key oncogenic signaling pathways in human cancer has allowed for a greater understanding of mechanisms involved in signal transduction and has laid the framework for the development of targeted molecular therapies designed to the specific alterations driving cancer development and progression. Numerous studies have indicated a causal role for EGFR signaling in the development and progression of lung cancer (1, 2). In addition, targeted molecular therapies directed against EGFR signaling have become a mainstay for the treatment of metastatic lung adenocarcinomas (3) that exhibit increased EGFR expression, receptor amplification, and activating mutations. The molecular characterization of key downstream activators of EGFR signaling has allowed for a better understanding and prediction of potential mechanisms of resistance to these newer targeted molecular agents. Indeed, the clinical utility of anti-EGFR–based strategies is ultimately limited by primary or acquired drug resistance (1, 2).
Primary and acquired resistance to anti-EGFR–based therapies can develop through several distinct molecular mechanisms, including a gatekeeper mutation of the T790 residue (T790M) in EGFR (1, 2), activating mutations downstream of EGFR (K-Ras, ref. 4; or PI3K, ref. 5), MET amplification (6) or loss of the tumor suppressor gene PTEN (7). Recent evidence suggests that additional mechanisms including epithelial-mesenchymal transition (EMT) and histological conversion from an adenocarcinoma to small cell cancer–like phenotype may also contribute TKI resistance (8). Less is known, however, about the negative downstream effectors of oncogenic EGFR signaling. Thus, a more complete molecular characterization and mechanistic understanding of downstream transcriptional regulators of oncogenic EGFR signaling will provide a greater understanding of the downstream mediators of treatment resistance and provide the experimental basis for the development of a new class of rationally designed drugs.
Two transcription factors of interest, forkhead box O1 (FOXO1) and Krüppel-like factor 6 (KLF6), have been shown to play central roles in the regulation of diverse cellular processes, including development, differentiation, proliferation, and apoptosis. KLF6 is a tumor suppressor gene that is frequently inactivated by loss of heterozygosity (LOH), dysregulated alternative splicing, somatic mutation, and decreased expression in human cancer (9). In the field of lung cancer, several microarray studies have identified KLF6 (usually referred to in these reports as COPEB) as significantly dysregulated in tumors relative to normal tissue and/or as a contributor to gene signatures that predict patient survival (10–12). In addition, KLF6 expression was found to be significantly decreased in patient-derived lung adenocarcinoma samples compared with matched normal lung tissue in several recent studies by quantitative real-time PCR (qRT-PCR) (13). Consistent with its function as a tumor suppressor gene, overexpression of KLF6 resulted in spontaneous apoptosis and decreased colony formation in lung adenocarcinoma cell lines (11, 13). In addition, KLF6 expression has been identified to be highly correlated with EGFR signaling and a target of PI3K-mediated signaling (14, 15). FOXO1 is a transcriptional regulator of the G1/S checkpoint and of apoptosis (16). It has been identified as being functionally inactivated in cancer by AKT-mediated phosphorylation in a variety of human malignancies and is a direct transcriptional activator of KLF6 gene expression through binding to the KLF6 promoter (14, 17). Combined, these data led us to explore and further define the potential role of the FOXO1/KLF6 transcriptional network in the regulation of EGFR signaling in lung adenocarcinoma.
Results
Activated EGFR correlates with downregulation of KLF6 expression in lung adenocarcinoma.
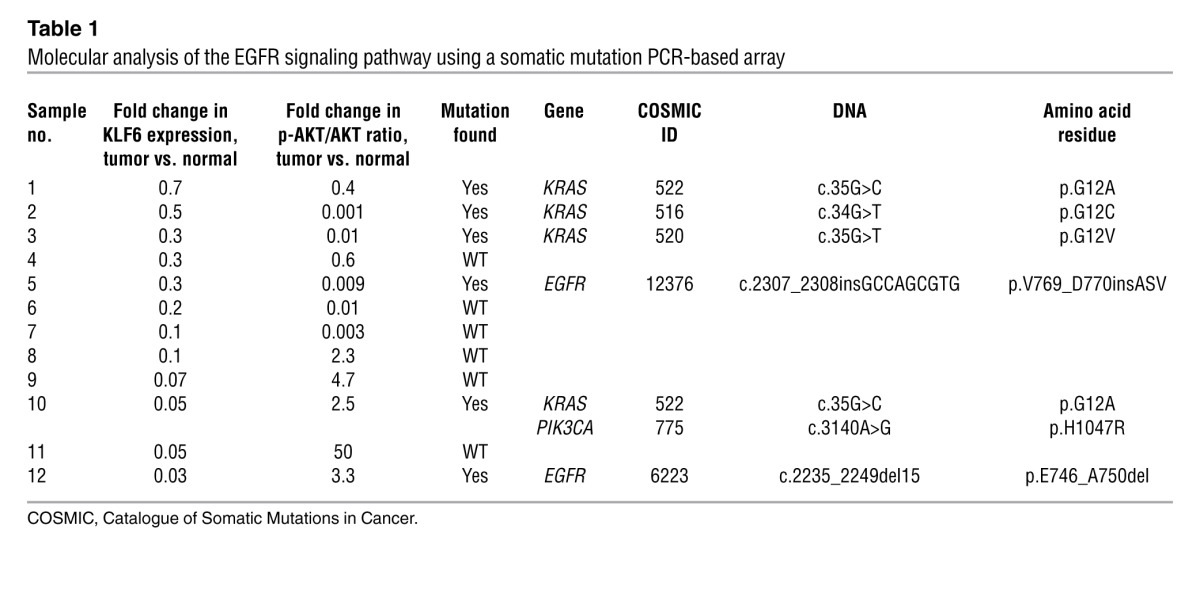
Various reports have demonstrated frequent downregulation of the tumor suppressor KLF6 in primary human lung cancers (10, 11, 13, 18). To further confirm and extend these findings, we used a cohort of microdissected normal and tumor patient-derived lung adenocarcinoma samples (Mount Sinai Tumor Biorepository) and performed qRT-PCR using validated real-time PCR primers specific to KLF6 (19) and Western blotting with a KLF6 polyclonal antibody to quantitate KLF6 expression in 12 matched tumor/normal tissue pairs. KLF6 mRNA and protein expression were decreased in all patient tumor samples analyzed by an average of more than 50% compared with surrounding normal lung tissue (Figure 1, A and B). Based on a recent study that reported a correlation between EGFR signaling and KLF6 expression (15, 20), and given that activated EGFR signaling is a critical mediator of lung cancer development (21), we sought to investigate the relationship between activated EGFR signaling and KLF6 expression. These matched tumor/normal tissue pairs were analyzed for the presence of genetic alterations in the EGFR signaling pathway using the qBiomarker somatic mutation PCR array (QIAGEN). This array profiles the somatic mutation status for EGFR and a number of downstream signaling mediators, including KRAS, PIK3CA, AKT1, and PTEN. Activating EGFR and PIK3CA mutations were associated with increased AKT signaling as demonstrated by an increase in the p-AKT to AKT ratio. Patient tumor samples with activated AKT, through either PIK3CA or EGFR mutations, expressed low levels of KLF6 (Table 1). Given this association, we sought to specifically determine whether EGFR activation regulates KLF6 expression using a murine model of EGFR-activated lung adenocarcinoma (22).
Figure 1. Activated EGFR signaling regulates KLF6 transcription in lung adenocarcinoma.

(A) Patient-derived lung adenocarcinoma tumor samples with matched normal tissue adjacent to the retrieved tumor were evaluated for KLF6 mRNA expression by qRT-PCR using validated WT KLF6-specific primers and normalized to 3 independent housekeeping genes (GAPDH, actin, and 18S transcripts). Data are presented as fold change in KLF6 mRNA expression compared with the matched normal tissue for each sample pair. (B) Homogenized protein lysates from both tumor and normal samples were probed with a polyclonal KLF6 antibody and quantitated via densitometry. (C) Confirmation of human-derived transgenic EGFRL858R tetracycline-inducible expression in mouse lung tissue samples compared with WT littermates on a doxycycline-supplemented diet. Expression of human cDNA EGFRL858R expression was assessed using qRT-PCR with hEGFR-specific primers (n = 4). (D) Western blot of EGFRL858R tumor and WT littermate protein lysates confirming EGFR expression using a monoclonal EGFRL858R antibody. KLF6 protein expression normalized to tubulin is also shown. (E) qRT-PCR for KLF6 mRNA expression in L858R mouse lung tissue samples compared with WT littermates using mouse-specific KLF6 primers. (F) qRT-PCR for KLF6 mRNA expression in L858R mouse tumor samples after treatment with erlotinib compared with vehicle-treated control mice. Whiskers represent the range of expression, and the horizontal lines show the median. (G) Western blot for KLF6 and cleaved caspase-3 normalized to mouse tubulin for L858R mice tumor samples after treatment with erlotinib compared with vehicle. *P < 0.05, **P < 0.01, ***P < 0.001.
Table 1.
Molecular analysis of the EGFR signaling pathway using a somatic mutation PCR-based array
This murine model is driven by the EGFRL858R allele, a commonly mutated residue in human lung cancers that is characterized by constitutive downstream signaling (22). In a tetracycline-inducible system for conditional EGFR overexpression, these animals develop highly penetrant (~100%) and aggressive lung adenocarcinoma within 4–8 weeks on a doxycycline-supplemented diet (22). We used qRT-PCR and Western blotting with a mutation-specific EGFRL858R monoclonal antibody (23) to confirm increased expression of EGFR in the mouse-derived tumors as compared with normal lung tissue obtained from WT age- and sex-matched littermates on a doxycycline-supplemented diet (Figure 1, C and D). Consistent with our observations in human lung adenocarcinoma patient samples, EGFR activation in this murine model of the disease was associated with a greater than 50% decrease in expression of KLF6 mRNA and protein (Figure 1, D and E). These data further strengthened the association between EGFR activation and transcriptional downregulation of the KLF6 tumor suppressor in lung adenocarcinoma and prompted further investigation delineation of the mechanism of KLF6 regulation by activated EGFR signaling.
KLF6 is transcriptionally upregulated by inhibition of EGFR signaling by anti-EGFR therapeutics.
Given our data supporting the hypothesis that EGFR activation results in KLF6 downregulation, we sought to inhibit this pathway and assess effects on KLF6 expression. The EGFRL858R murine model demonstrates spontaneous tumor regression (22) when treated with erlotinib, an FDA-approved small molecule inhibitor of EGFR signaling. We analyzed L858R mouse tumor samples obtained from mice treated with erlotinib and found increased expression of KLF6 mRNA and protein following EGFR inhibition (Figure 1, F and G, and Supplemental Figure 1; supplemental material available online with this article; doi: 10.1172/JCI62058DS1). In vivo upregulation of KLF6 in these tumors correlated with increased levels of apoptosis as demonstrated by Western blotting for caspase-3 cleavage (Figure 1G).
To further validate and extend these findings to relevant cell culture models of lung cancer, we used a panel of human lung adenocarcinoma cell lines to determine the effects of EGFR inhibition on KLF6 gene transcription. We examined 4 human lung adenocarcinoma cell lines: 2 harboring EGFR activating mutations in which EGFR signaling can be effectively inhibited by TKI addition and 2 cell lines in which EGFR signaling cannot be inhibited secondary to activation of the AKT or Ras signaling pathways (Table 2).
Table 2.
Human lung adenocarcinoma cell lines with corresponding molecular lesions

Consistent with the effect seen in the EGFR-driven L858R model in vivo, the HCC827 and H3255 cell lines, which harbor activating EGFR mutations (7) (specifically a deletion in exon 19 and L858R, respectively), showed significant increases in KLF6 mRNA and protein expression and induction of spontaneous apoptosis upon inhibition of EGFR signaling with erlotinib addition (Figure 2, A–C, and Supplemental Figure 2, A and B). We additionally measured KLF6 promoter activation in the treatment sensitive HCC827 cell line using a hybrid 2.2-kb KLF6 promoter–luciferase construct (24). Treatment of HCC827 with erlotinib induced a 5-fold increase in KLF6 promoter activity (Supplemental Figure 3), indicating that EGFR inhibition induces KLF6 gene transcription. In contrast, the H1650 and A549 cell lines, which are erlotinib resistant secondary to constitutive activation of downstream signaling mediators of EGFR signaling (4), did not demonstrate KLF6 upregulation upon erlotinib addition (Figure 2, A–C, and Supplemental Figure 2, C and D). Treatment of A549 cells with an increased dose (1 μM) of erlotinib to sufficiently inhibit the EGFR signaling pathway resulted in inhibition of AKT signaling and a subsequent increase in KLF6 expression (Supplemental Figure 4, A and B).
Figure 2. Activated EGFR signaling regulates KLF6 transcription in lung adenocarcinoma–derived cell lines.

(A) Dose-response curve representing the percentage of cells in the sub-G1 fraction as determined by flow cytometry analysis of propidium iodide staining for cellular DNA content. Each cell line was treated with erlotinib for 24 hours. For H3255, *P < 0.05, **P < 0.01, ***P < 0.001 compared with 0 nM; for HCC827, #P < 0.05, ##P < 0.01, ###P < 0.001 compared with 0 nM. (B) qRT-PCR for KLF6 mRNA expression normalized to GAPDH in 3 cell lines after treatment with 50 nM erlotinib. †P < 0.05, ‡P < 0.01. (C) Western blot for KLF6 and cleaved PARP protein expression in cell lines after treatment with 50 nM erlotinib.
Combined, these data demonstrate that KLF6 is negatively regulated by activated EGFR signaling both in cell culture and in vivo, and that upregulation of KLF6 occurs upon inhibition of EGFR signaling, suggesting that one or both of the critical downstream pathways regulating EGFR signaling is involved in the regulation of KLF6 expression.
EGFR-driven AKT activation regulates KLF6 transcription.
EGFR activates two major downstream pathways, the Ras/Raf/MAPK and the PI3K/AKT signaling cascades (25). As the Ras/Raf/MAPK pathway is a critical regulator of proliferation downstream of EGFR (4), we sought to determine whether Ras signaling affected KLF6 expression in an in vivo model. The KrasLA2 murine model of K-Ras activation (26) carries oncogenic alleles of K-Ras that become activated after a spontaneous recombination event in a “hit-and-run” transgenic design. The activation of K-Ras, which occurs at a higher rate in lung epithelial tissue, leads to development of lung tumors that are phenotypically and histologically similar to human non–small cell lung cancer (NSCLC). To ensure that changes in KLF6 expression were not a secondary result of tumor formation, we microdissected nodules out of each sample and utilized the noncancerous adjacent tissue for the analysis of K-Ras activation in comparison to age-matched/sex-matched WT littermates. Western blotting using ERK- and p-ERK–specific antibodies confirmed activated K-Ras signaling in the K-RasLA2 mouse lung tissue compared with WT littermates (Figure 3, A and B). KLF6 expression was then analyzed using qRT-PCR and Western blotting; however, no significant changes were found in either KLF6 mRNA or protein expression in the context of activation of K-Ras (Figure 3, A and C). These data suggested that the Ras/Raf/MAPK component of the EGFR signaling pathway was most likely not responsible for the KLF6 downregulation observed in the context of activated EGFR signaling.
Figure 3. Activated RAS signaling does not affect KLF6 expression.

(A) Western blot of lung tissue lysates extracted and microdissected from transgenic KrasLA2 mice to exclude obvious tumor nodules versus lung tissue lysates of WT littermates. Tumor nodules were excluded to ensure that any changes in KLF6 were not secondary to tumor formation. Western blot shows p-ERK, ERK, and KLF6 protein expression normalized to mouse tubulin. (B) p-ERK to ERK ratios determined by quantitating protein expression from A. (C) qRT-PCR of KLF6 expression in lung tissue lysates of KrasLA2 mice versus WT littermates performed as previously described. For B and C, whiskers represent the range of expression, while the horizontal line shows the median. (D) Western blot for p-ERK, ERK, KLF6, and GAPDH in the HCC827 cell line treated with 1 μM of the MEK inhibitor AZD6244. (E) qRT-PCR for KLF6 in the HCC827 cell line treated with 1 μM AZD6244, normalized to GAPDH. ***P < 0.001.
To further confirm these negative results, we used the MEK inhibitor AZD6244 to inhibit downstream signaling of Ras in cell culture. AZD6244 is an uncompetitive allosteric ATP inhibitor of MEK that is currently in phase II clinical trials for a number of cancers, including NSCLC (27, 28). Treatment of the EGFR-activated HCC827 cells with AZD6244 resulted in a decrease in phosphorylated ERK as shown by Western blotting (Figure 3D), thereby confirming effective inhibition of the Ras signaling pathway. KLF6 expression was unchanged between treated and untreated cells at both the mRNA and protein levels, and there was no significant induction of apoptosis (Figure 3, D and E, and data not shown). These data further demonstrated that the Ras signaling cascade was not responsible for regulating KLF6 expression.
Based upon these findings, we focused on the PI3K/AKT signaling pathway, the other critical downstream mediator of activated EGFR signaling. We utilized the Pten/Mmac1+/– heterozygous mouse model (29), which is characterized by constitutively activated AKT signaling due to Pten haploinsufficiency. Analysis by Western blotting confirmed decreased PTEN expression and increased phosphorylation of AKT in lung tissue from heterozygous Pten+/– mice compared with age- and sex-matched WT littermates (Figure 4, A and B). This activated AKT signaling was associated with decreased Klf6 mRNA and protein expression as assessed by qRT-PCR and Western blotting in heterozygous Pten+/– mice compared with age-/sex-matched WT littermates (Figure 4, A and C).
Figure 4. Activated AKT signaling negatively regulates KLF6 expression.

(A) Western blotting of lung tissue lysates from Pten+/– and WT age-matched littermates for PTEN, p-AKT, AKT, p-FOXO1, FOXO1, and KLF6 normalized to tubulin. (B) Box-and-whisker plots of p-AKT/AKT and p-FOXO1/FOXO1 protein ratios in A. (C) qRT-PCR of KLF6 mRNA expression in Pten-heterozygous animals as compared with WT littermates. (D) Western blot for p-AKT, AKT, KLF6, and GAPDH in the HCC827 cell line treated with 1 μM of the allosteric AKT inhibitor MK-2206 for 24 hours. (E) qRT-PCR for KLF6 mRNA expression normalized to GAPDH in the HCC827 cell line treated with 1 μM MK-2206 for 24 hours. (F) Promoter activity shown as fold change compared with baseline as determined by luciferase expression in the A549 cell line 48 hours after co-transfection of the KLF6 promoter construct with either pBABE control or constitutively active AKTmyr expression vector. (G) qRT-PCR for KLF6 mRNA expression normalized to GAPDH in A549 cells 48 hours after transfection with either pBABE control or constitutively active AKTmyr. (H) Western blot for p-AKT, AKT, and KLF6 normalized to GAPDH in A549 cells 48 hours after transfection with either pBABE control or constitutively active AKTmyr. *P < 0.05, **P < 0.01.
To further extend and validate these findings, we utilized MK-2206, which is a highly selective non-ATP-competitive allosteric AKT inhibitor (30), to further elucidate the relationship between activated AKT signaling and downregulation of KLF6 expression. Western blotting showed a decrease in AKT activation as assessed by phosphorylation of serine 473 (31) in the HCC827 cell line when treated with MK-2206 (Figure 4D). Effective inhibition of AKT signaling resulted in an upregulation of KLF6 protein and mRNA (Figure 4, D and E). Inhibition of AKT resulted in no significant increase in apoptosis (data not shown) suggesting that AKT inhibition alone is not sufficient to induce apoptosis, consistent with several recent studies (30, 32) that have demonstrated that inhibition of both arms of the EGFR signaling pathway (RAS and AKT) is required for the induction of apoptosis.
We next overexpressed a constitutively active form of AKT in the A549 lung adenocarcinoma cell line (33) and measured KLF6 promoter activation and mRNA and protein levels. This cell line is highly transfectable and expresses lower levels of activated AKT signaling at baseline (data not shown), making it an ideal model system to study the effects of AKT overexpression on KLF6 expression. Increased AKT signaling resulted in a marked reduction in KLF6 promoter activation and endogenous KLF6 mRNA and protein expression (Figure 4, F–H), further confirming that KLF6 expression is negatively regulated by EGFR-driven activation of the PI3K/AKT signaling pathway in human lung adenocarcinoma.
To extend these findings to human lung cancer, we analyzed an additional cohort of patient-derived lung adenocarcinoma samples to determine whether activated AKT signaling negatively regulates KLF6 gene transcription in human disease. We determined the mutation status of the 26 patient-derived lung adenocarcinoma samples using the previously described somatic mutation PCR array and characterized samples either as AKT activated (harboring EGFR, PI3K, or PTEN mutation), K-Ras driven, or harboring neither K-Ras nor AKT pathway aberrations (WT tumors). We found that only in the AKT-activated tumors was there a negative correlation between KLF6 expression and p-AKT (Supplemental Figure 5). These data further demonstrate that KLF6 expression is negatively regulated by the AKT signaling pathway in human lung adenocarcinoma.
FOXO1 is a transcriptional regulator of KLF6 in lung adenocarcinoma.
The PI3K/AKT signaling pathway mediates tumor progression via downstream regulation of BCL-2 family proteins, NF-κB, and FOXO transcription factors. The FOXO transcription factors have been identified as putative tumor suppressor genes and have been shown to induce apoptosis in lung cancer cell lines (34–36). AKT-mediated phosphorylation of FOXO factors results in CRM-1–dependent nuclear export, proteasomal degradation, and diminished transcriptional activity (17, 37). Recently, transcriptome analysis of liver ECs in a FOXO-deficient Mx-Cre+ mouse identified KLF6 as one of the top two most significantly downregulated genes with the highest number of conserved FOXO-binding elements (36). Moreover, a ChIP-based study identified KLF6 as a direct transcriptional target of FOXO1 (14).
Based on these reports and given the evidence presented here that KLF6 is transcriptionally regulated by activated AKT signaling, we hypothesized that AKT-mediated inactivation of FOXO1 is a critical negative regulator of KLF6 expression. In order to test this hypothesis, we overexpressed FOXO1 to examine a direct relationship between AKT, FOXO1, and KLF6. Again, due to its high transfection efficiency and low levels of baseline AKT activation, the A549 cell line was used for these studies. Overexpression of FOXO1 in A549 cells resulted in increased KLF6 promoter activation as well as mRNA and protein expression (Figure 5, A–D). Additionally in the Pten-heterozygous mice, which demonstrated activated AKT signaling in the lung, the level of phosphorylated FOXO1 at the AKT phosphorylation site serine 256 (38) was increased, and this correlated with decreased KLF6 expression (Figure 4, A–C). Based on this evidence, we hypothesized that inhibition of EGFR-driven AKT activation could prevent FOXO1 phosphorylation and result in reactivation of this transcriptional network. Consistent with this hypothesis, addition of erlotinib to the treatment-sensitive HCC827 cell line decreased FOXO1 phosphorylation at serine 256 and led to FOXO1 accumulation in the nucleus. The increase in nuclear FOXO1 resulted in increased transcriptional activation of KLF6 and subsequent induction of apoptosis (Figure 5, E and F, and Supplemental Figure 1). Furthermore, analysis of the patient-derived tumor samples analyzed previously (Figure 1, A and B) displayed a positive correlation between FOXO1 and KLF6 expression, extending our cell culture and in vivo findings to patient-derived lung adenocarcinoma samples (Supplemental Figure 6).
Figure 5. Activated EGFR signaling regulates KLF6 expression via the transcription factor FOXO1.

qRT-PCR for (A) FOXO1 and (C) KLF6 mRNA expression in A549 cells transiently transfected with pCINEO-FOXO1 construct and analyzed after 48 hours. Data are shown as fold change in mRNA expression compared with control empty vector–transfected cells and normalized to GAPDH. (B) KLF6 promoter activity measured by a dual-reporter assay in the presence of FOXO1 overexpression in A549 cells. Data are shown as fold change compared with empty vector–transfected cells. (D) Western blot for KLF6, FOXO1, and GAPDH protein expression after transfection with pCI-neo-FOXO1 construct and pCI-neo empty control vector in A549 cells. (E) EGFR/FOXO1/KLF6 signaling pathway represented by protein Western blot for p-EGFR, EGFR, p-AKT, AKT, p-FOXO1, FOXO1, KLF6, PARP, and GAPDH in HCC827 cells 24 hours after treatment with erlotinib. (F) Western blot for FOXO1, KLF6, histone H3, and GAPDH in HCC827 cells treated with 50 nM erlotinib for 24 hours and subjected to nuclear/cytoplasmic fractionation. Values represent relative protein expression, normalized to histone H3. (G and H) qRT-PCR for FOXO1 and KLF6 mRNA expression normalized to GAPDH in HCC827 cells after transfection with sequence-specific siRNAs to FOXO1 or small, interfering non-targeting control (siNTC) and subsequent treatment with erlotinib. (I) Western blot for FOXO1, KLF6, and the apoptotic marker caspase-3, normalized to GAPDH in HCC827 cells after transfection with sequence-specific siRNAs to FOXO1 or control siNTC and subsequent treatment with erlotinib. *P < 0.05, **P < 0.01, ***P < 0.001.
Based upon these findings, we hypothesized that the FOXO1-driven upregulation of KLF6 was required for erlotinib-mediated apoptosis in EGFR-driven lung adenocarcinoma cell lines. Silencing of FOXO1 using RNAi blunted erlotinib-induced KLF6 upregulation and prevented apoptosis as indicated by Western blotting for cleaved caspase-3 (Figure 5, G–I).
Collectively, these data identify a novel transcriptional network that negatively regulates oncogenic EGFR signaling and modulates the apoptotic response to anti-EGFR–based therapies in EGFR-driven cell lines and murine models of lung cancer.
Upregulation of the KLF6 tumor suppressor is required for erlotinib response both in cell culture and in vivo.
Based on the findings that inhibition of activated EGFR signaling results in increased KLF6 expression, we next sought to determine the role of increased KLF6 expression in the regulation of apoptosis. To determine the dynamics of KLF6 upregulation in response to erlotinib, we conducted a time course experiment in the EGFR-activated and erlotinib-sensitive cell line HCC827. qRT-PCR of KLF6 mRNA and Western blot analysis for protein expression at 4 time points demonstrated that KLF6 expression was significantly upregulated at 12 and 24 hours after addition of erlotinib (Figure 6, A and B). These findings correlated with the apoptotic response in cells, which was determined using cell cycle analysis via flow cytometry (Figure 6C). These results suggested that the kinetics of KLF6 upregulation in response to EGFR inhibition were consistent with a potential role for this gene in the induction of apoptosis.
Figure 6. Targeted reduction of KLF6 in the erlotinib-sensitive HCC827 cell line confers drug resistance in culture and in vivo.

(A) qRT-PCR for KLF6 mRNA expression in HCC827 cells treated with 50 nM erlotinib normalized to GAPDH over 24 hours. (B) Western blot for KLF6 and cleaved PARP expression in HCC827 cells treated with erlotinib over for 24 hours. (C) Cell cycle analysis using flow cytometry of the sub-G1 fraction after propidium iodide staining. (D) qRT-PCR for KLF6 mRNA expression in the control cell line shLuc-HCC827 and stable knockdown cell line shKLF6-HCC827 after treatment with 50 nM erlotinib. (E) Western blot for expression of KLF6, cleaved PARP, p-AKT, p-ERK. (F) Cell cycle analysis using flow cytometry of the sub-G1 cell cycle fraction after propidium iodide staining. (G) Clonogenic assay of shLuc-HCC827 and shKLF6-HCC827 cells treated with 0 or 50 nM erlotinib for 7 days; quantification of colonies is presented. (H–J) Growth curves of subcutaneous xenograft tumors generated from 1 × 10⁷ shLuc-HCC827 or shKLF6-HCC827 cells injected into the right posterior flank of nude mice following an initial growth period of 14 days. Group tumor volume (n = 4) averaged 150 mm3 prior to treatment. Tumor measurements were made 48 hours after each injection. (H) Fold change of tumor volume over the duration of treatment described above represented as a box-and-whisker plot. (I) Mean tumor volume of shLuc-HCC827 xenograft tumors treated with DMSO (vehicle control) or erlotinib (25 mg/kg). (J) Mean tumor volume of shKLF6-HCC827 xenograft tumors treated with DMSO or erlotinib (25 mg/kg). *P < 0.05, **P < 0.01, ***P < 0.001.
Given the marked upregulation of KLF6 expression upon inhibition of EGFR signaling in the HCC827 cell line, we used sequence-specific siRNAs to KLF6 to blunt its upregulation and determine the potential biological effect of KLF6 upregulation on cellular apoptosis. Transfection of sequence-specific siRNAs to KLF6 (39) in HCC827 cells resulted in a greater than 50% downregulation of KLF6 expression at baseline and a greater than 80% downregulation of KLF6 mRNA and protein in the presence of erlotinib relative to a scrambled siRNA control (Supplemental Figure 7, A and B). Targeted reduction of KLF6 blunted the levels of erlotinib-driven apoptosis in the EGFR-activated cell line HCC827. This result was confirmed by cell cycle analysis using flow cytometry (Supplemental Figure 7C), Annexin V staining, and additional markers of apoptosis, including cleaved PARP and caspase-3 expression by Western blotting (Supplemental Figure 7C, Supplemental Figure 8, A and B, and data not shown). To confirm these findings, we used an additional treatment-sensitive cell line, H3255, in which transfection of sequence-specific KLF6 siRNAs resulted in downregulation of KLF6 expression at both the mRNA and protein level and subsequent inhibition of erlotinib-mediated apoptosis (Supplemental Figure 9, A–C). Combined, these data suggest that KLF6 upregulation is necessary for the induction of apoptosis by anti-EGFR–based therapy in metastatic lung cancer cell lines.
To further extend these findings and determine whether the upregulation of KLF6 was necessary for anti-EGFR–based therapy response in vivo, we used shRNA interference to stably knock down KLF6. Stable knockdown of KLF6 expression (Figure 6, D and E) in the HCC827 cell line decreased erlotinib-driven apoptosis, as demonstrated by decreased PARP cleavage and a decreased sub-G1 fraction in cell cycle analysis (Figure 6, E and F). This result was further validated using a clonogenic assay in which addition of erlotinib resulted in decreased colony formation in the control shLuc line but not in shKLF6 cells (Figure 6G). Additional characterization of the colony size and number revealed that shLuc-treated cells decreased in both colony number and size, whereas shKLF6-treated cells decreased in size but not colony number (Supplemental Figure 10, A–C). This suggested that erlotinib was still causing growth arrest through suppression of ERK signaling in the shKLF6-treated cells. Characterization of the stable cell lines for downstream targets of EGFR pathway inhibition demonstrated that erlotinib still inhibited AKT and Ras signaling, suggesting that KLF6 inhibition did not affect drug binding or upstream pathway inhibition in response to anti-EGFR–based therapy, but did affect erlotinib-driven apoptosis through decreased activation of the FOXO1/KLF6 transcriptional network (Figure 6E).
Based upon these data, we decided to further explore the dependence of anti-EGFR–based therapy response on KLF6 upregulation in an in vivo model of lung cancer by injecting the shLuc and shKLF6 stable cell lines subcutaneously into nude mice (n = 18). After the tumors reached an average volume of 150 mm3, we divided them into 4 treatment groups: shLuc treated with vehicle control (DMSO) (n = 4), shLuc treated with erlotinib (n = 5), shKLF6 treated with vehicle control (n = 4), and shKLF6 treated with erlotinib (n = 5). We measured tumor growth in the nude mice 48 hours after each drug injection. Immunohistochemical studies showed that shKLF6-derived tumors maintained a decrease in KLF6 expression compared with shLuc-derived tumors (Supplemental Figure 11). While erlotinib treatment did not significantly decrease the tumor volume in the shKLF6-derived tumors, the shLuc-derived tumors responded to the anti-EGFR therapy, showing significantly smaller tumor volumes than in the DMSO-treated control group at the conclusion of the study (Figure 6, H–J). Combined, these data confirm that transcriptional activation of the KLF6 tumor suppressor gene is necessary for an anti-EGFR–based therapy response in both cell culture and mouse models of lung adenocarcinoma. Based upon these findings, we therefore hypothesized that acquired resistance to anti-EGFR–based therapies could be overcome by restoring downstream function of the FOXO1/KLF6 transcriptional network in erlotinib-resistant lung cancer driven by activation of the PI3K/AKT signaling pathway.
Inhibition of FOXO1 nuclear export increases KLF6 expression.
Inactivation of the FOXO1 transcription factor in cancer predominantly occurs through alterations in its subcellular localization (Supplemental Figure 12 and ref. 40). We therefore sought a pharmacologically and clinically viable approach to activate FOXO1 by retaining nuclear localization and overcoming the mislocalization seen in lung adenocarcinoma cell lines and patient samples (35). Trifluoperazine hydrochloride (TFP), an FDA-approved antipsychotic and antiemetic, was identified in a chemical genetic screen to be an effective nuclear export inhibitor of the FOXO1 transcription factor (41). Although TFP has traditionally been utilized as a dopamine receptor antagonist, it has also been shown to increase FOXO1 nuclear localization via calmodulin inhibition upstream of AKT and downstream of PI3K (41). We thus chose to inhibit nuclear export of FOXO1 using TFP to determine whether activation of the FOXO1/KLF6 transcriptional network could restore sensitivity to the erlotinib-resistant cell line H1650, in which resistance is driven by activated PI3K/AKT signaling (Supplemental Figure 13) due to PTEN depletion (42). We chose TFP for several reasons: (a) it is already FDA approved and has been used in patients for more than 20 years with a well-defined toxicity and safety profile; (b) if TFP were effective in modulating treatment response in erlotinib-resistant lung cancer, the path to clinical translation would be most evident and accessible given that both drugs are FDA approved; and (c) at the molecular level, TFP potentially regulates the FOXO/KLF6 transcriptional network, which might allow for fewer potential mechanisms for the development of resistance to this drug combination. To examine the effect of TFP on nuclear localization of FOXO1 and subsequent KLF6 transactivation, we treated H1650 cells with increasing doses of TFP. Subcellular fractionation confirmed that addition of TFP did in fact increase nuclear FOXO1 expression (Figure 7A and Supplemental Figure 14). Nuclear accumulation of FOXO1 resulted in concurrent upregulation of KLF6 mRNA and protein after treatment with 20 μM TFP (Figure 7, A and B). There was, however, no significant increase in apoptosis (data not shown). This suggests that restoration of FOXO1/KLF6 transcriptional network was not sufficient to induce apoptosis; however, the combination of TFP with anti-EGFR–based therapy may result in treatment response.
Figure 7. Inhibition of FOXO1 nuclear export results in KLF6 upregulation and increased induction of apoptosis in combination with erlotinib.

(A) Western blot for FOXO1, BRCA1, and GAPDH after nuclear cytoplasmic fractionation of H1650 cells treated with 20 μM TFP. BRCA1: nuclear fraction control, GAPDH: cytoplasmic fraction control. (B) qRT-PCR and Western blotting for KLF6 mRNA and protein expression levels in H1650 cells after treatment with TFP. (C) Isobologram analysis of combination treatment with erlotinib and TFP in H1650 cells performed using normalized equivalents of single agents. The IC50 values for each drug are plotted on the x and y axes, respectively. The line connecting the points is the theoretical line of additivity. The experimental values of the fixed dose ratios of TFP/erlotinib combinations (diamonds) were significantly below the respective additive points. *P < 0.05.
Combination of TFP with erlotinib increases apoptosis and decreases tumorigenicity.
Given that TFP has the potential to relocalize FOXO1, we sought to explore the therapeutic potential of combining TFP with erlotinib in both cell culture and in vivo models of lung adenocarcinoma. Isobologram analysis revealed that the combination of erlotinib and TFP had a marked synergistic effect on cell death (Figure 7C and Supplemental Figure 15) in a PI3K/AKT-driven model of treatment resistance due to PTEN depletion (42).
To extend these findings to an in vivo model of the disease, we injected the erlotinib-resistant cell line H1650 subcutaneously into nude mice (n = 54). We measured tumor growth weekly until average tumor volume for all mice was approximately 200 mm3, at which point the mice received vehicle control (DMSO) (n = 13), erlotinib (n = 14), TFP (n = 14), or erlotinib in combination with TFP (n = 13). Tumor growth in H1650-injected nude mice was measured 48 hours after each drug injection. Although the tumor volume increased with vehicle control and erlotinib (Figure 8A), it decreased after treatment with TFP alone. Furthermore, combination of TFP and erlotinib led to the greatest regression in tumor volume (Figure 8A). Similar results were seen after the mice were sacrificed and the tumors were collected for determination of mass (data not shown). Consistent with our cell culture data, analysis of TFP/erlotinib-treated tumors showed an increase in FOXO1 nuclear localization (Supplemental Figure 16) and an increase in expression of KLF6 mRNA and protein compared with both control mice and those treated with erlotinib alone (Figure 8, B and C, and Supplemental Figure 17).
Figure 8. TFP and erlotinib administered in combination decrease tumorigenicity in a xenograft model of lung adenocarcinoma.

(A) Growth curves of xenograft tumors generated by injection of 5 × 10⁶ H1650 lung adenocarcinoma cells into the right posterior flank of nude mice. Following an initial growth period of 21 days, group tumor volume (n = 14) averaged 200 mm3 prior to treatment. Tumor measurements were made 48 hours after each injection. Data indicate growth curves with DMSO (vehicle control), erlotinib (25 mg/kg), TFP (10 mg/kg), and a combination of TFP and erlotinib. Asterisks represent significance compared with DMSO. (B) qRT-PCR for KLF6 mRNA expression from previously described tumors homogenized after the H1650-injected nude mice were sacrificed 24 hours after final treatment. (C) Western blot analysis of KLF6 expression in homogenized tumor samples (described above). Lysate homogenates from treated and untreated tumors were run and probed in parallel (n = 5) and results normalized to GAPDH. (D) Representative images (original magnification, ×10) of xenograft tumor histology paraffin sections subjected to TUNEL for detection of apoptosis. (E) Cells positive for TUNEL were quantified with NIS-Elements and normalized to nuclear counterstaining by propidium iodide. Quantification is shown for each treatment group. (F) Paraffin histology sections subjected to immunohistochemistry for PCNA. Representative images are shown (original magnification, ×40). (G) Positive nuclear staining, colocalizing with nuclear counterstain hematoxylin, quantified with ImageJ software. Data are shown in box-and-whisker plots for each treatment group. *P < 0.05, **P < 0.01, ***P < 0.001.
We next sought to determine the molecular and cellular mechanisms involved in the modulation of erlotinib and TFP response in vivo. Analysis of the tumor xenografts treated with TFP and the TFP/erlotinib combination demonstrated an increase in apoptosis as assessed by TUNEL (Figure 8, D and E). Evaluation of the proliferative index of each of the treated tumors for proliferating cell nuclear antigen (PCNA) expression showed a decrease in cell number with treatment with either erlotinib alone or erlotinib in combination with TFP (Figure 8, F and G). Combined, these data highlight the importance of the Ras/Raf/MAPK signaling pathway, which was inhibited effectively by erlotinib, in the regulation of cellular proliferation; and of the AKT/PI3K signaling axis, which was inhibited effectively by TFP, in the regulation of cellular survival and proliferation in vivo. The rational combination of drugs that inhibit both of these signaling pathways in vivo through modulation of downstream signaling networks can result in marked tumor regression in otherwise treatment-resistant lung adenocarcinoma.
In order to determine the specificity of this drug combination in inducing apoptosis through modulation of the FOXO1/KLF6 transcriptional network, we used shRNA interference to stably knock down FOXO1 (Figure 9, A and B). Inhibition of FOXO1 resulted in decreased apoptosis in the combination erlotinib- and TFP-treated cells as demonstrated by a decreased sub-G1 fraction in cell cycle analysis and decreased PARP cleavage (Figure 9, C and D, and Supplemental Figure 18, A and B). The upregulation of downstream targets of FOXO1, such as KLF6, was blunted with the addition of erlotinib and TFP in shFOXO1-treated cells (Figure 9E and Supplemental Figure 18, A and B). These data suggest that the modulation of FOXO1 and KLF6 is in some part necessary for the apoptosis induced by the rational combination of drugs that inhibit the major EGFR downstream signaling pathways.
Figure 9. Targeted reduction of FOXO1 in the H1650 cell line confers drug resistance to TFP and erlotinib treatment.

(A) qRT-PCR for FOXO1 mRNA expression in the control cell line shNTC-H1650 and stable knockdown cell lines shGAPDH-H1650, shFOXO1(1)-H1650, and shFOXO1(2)-H1650. (B) Western blot for FOXO1 expression in shNTC-H1650, shGAPDH-H1650, shFOXO1(1)-H1650, and shFOXO1(2)-H1650 cells. (C) Cell cycle analysis using flow cytometry of the sub-G1 fraction after propidium iodide staining in shNTC-H1650, shFOXO1(1)-H1650, and shFOXO1(2)-H1650 cells after treatment with TFP and erlotinib. (D) Western blot for cleaved PARP in shNTC-H1650, shFOXO1(1)-H1650, and shFOXO1(2)-H1650 cells after treatment with TFP and erlotinib as well as with MK-2206 and erlotinib. (E) qRT-PCR for KLF6 mRNA expression in shNTC-H1650, shFOXO1(1)-H1650, and shFOXO1(2)-H1650 cells after treatment with TFP and erlotinib. *P < 0.05, **P < 0.01.
Furthermore, given that TFP increases nuclear FOXO1 through calmodulin inhibition upstream of AKT, we sought to explore whether inhibition of AKT signaling via an AKT inhibitor, MK-2206, would similarly increase FOXO1 nuclear localization. Treatment with MK-2206 resulted in increased nuclear FOXO1 expression and a subsequent increase in KLF6 mRNA and protein expression in H1650 as well as in a non-EGFR-activated cell line, A549 (Figure 10, A–C, and Supplemental Figure 19, A–C). The combination of MK-2206 and erlotinib resulted in inhibition of downstream AKT and Ras signaling and an increase in apoptosis (Figure 10, D and E). This increase in apoptosis was blunted with the inhibition of FOXO1 as seen through decreased PARP cleavage and sub-G1 fraction in cell cycle analysis (Figure 9D, Figure 10F, and data not shown). These data further strengthen and confirm the hypothesis that modulation of the FOXO1/KLF6 transcriptional network is required for EGFR pathway inhibition–driven apoptosis.
Figure 10. Targeted reduction of FOXO1 in the H1650 cell line confers drug resistance to MK-2206 and erlotinib treatment.

(A) Western blotting for p-AKT, AKT, p-ERK, and ERK in H1650 cells after treatment with increasing doses of MK-2206. (B) Western blotting for FOXO1, BRCA1, and GAPDH after nuclear cytoplasmic fractionation of the H1650 cell line treated with 5 μM MK-2206. BRCA1: nuclear fraction control; GAPDH: cytoplasmic fraction control. (C) qRT-PCR and Western blotting for KLF6 mRNA and protein expression levels in H1650 cells after treatment with MK-2206. (D) Western blotting for p-AKT, AKT, p-ERK, and ERK in H1650 cells after treatment with erlotinib, MK-2206, or a combination of erlotinib and MK-2206. (E) Cell cycle analysis using flow cytometry of the sub-G1 cell cycle fraction after propidium iodide staining after treatment of H1650 cells with erlotinib, MK-2206, or a combination of erlotinib and MK-2206. (F) Western blot for cleaved PARP in shNTC-H1650 and shFOXO1-H1650 cells after MK-2206 and erlotinib treatment. *P < 0.05, ***P < 0.001.
In conclusion, these data highlight a key role for the FOXO1 and KLF6 tumor suppressor genes as downstream negative regulators of EGFR-driven cell survival. Modulation of this transcriptional network with two FDA-approved drugs can in fact restore sensitivity to cell lines resistant to anti-EGFR therapy in vitro and in vivo (Figure 11). Therefore, our studies identify a novel combination of FDA-approved drugs that are effective in vivo for the treatment of AKT-driven anti-EGFR–resistant lung adenocarcinoma. Given the high rate of resistance that inevitably develops to all anti-EGFR–based therapy, and that resistance driven through activated AKT signaling is responsible for more than 20% of all TKI-resistant disease, we believe these findings have immediate clinical relevance for a substantial percentage of patients with metastatic lung adenocarcinoma.
Figure 11. The EGFR/AKT/FOXO1/KLF6 signaling axis and associated inhibitors utilized to determine functional relationships among the signaling components of the cascade.

GRB2, growth factor receptor–bound protein 2; SOS, Son of Sevenless.
Discussion
The American Cancer Society estimates that there were 157,300 deaths from lung cancer in the United States for 2010 (43). Lung adenocarcinoma is the most common histology (~50%) among NSCLCs, which as a group constitute the majority of all lung malignancies (~80%). Dysregulated EGFR signaling has been implicated as having a central role in the pathogenesis of a significant percentage of lung adenocarcinomas. Accordingly, much effort has been focused on the development of anti-EGFR–based therapies for the treatment of metastatic lung adenocarcinoma. Erlotinib has been found to be efficacious in patients with activating EGFR mutations such as the exon 19 deletion and L858R. Additionally, recent studies have suggested that EGFR mutation–positive patients with metastatic lung adenocarcinoma receiving first-line treatment with erlotinib had significantly longer progression-free survival and fewer side effects compared with patients treated with traditional cyctotoxic chemotherapy. This illustrates the paradigm that the use of genetics- and genomics-based approaches to stratify patients to appropriate first-line targeted therapies can have direct clinical application and impact. Despite these advances, treatment resistance invariably develops to these targeted molecular agents through a variety of different mechanisms and pathways. Commonly, constitutive activation of downstream mediators of a specific oncogenic signaling pathway will result in the development of treatment resistance. This suggests that the identification and targeting of the most downstream/terminal regulators of signaling may ultimately prove to be the most therapeutically viable approaches for cancer treatment.
In this article, we identify a nuclear transcriptional network involving the KLF6 and FOXO1 tumor suppressor genes that negatively regulate activated oncogenic EGFR signaling and response to anti-EGFR–based therapies in both in vitro and in vivo models of the disease. Furthermore, we show that this pathway can be modulated through the rational combination of two FDA-approved drugs — trifluoperazine hydrochloride, a FOXO1 nuclear export inhibitor, and erlotinib, a small molecule inhibitor of EGFR signaling — in TKI-resistant lung adenocarcinoma cell lines. These data further highlight the central importance of defining key signaling networks in cancer and the potential use of this information to identify clinically relevant modulators of treatment response. Furthermore, this combinatorial approach to drug development and administration reinforces an important paradigm: that rational drug design based on a thorough understanding of the specific molecular alterations that drive disease progression and treatment resistance may lead to more effective and less toxic drugs for the treatment of cancer.
Methods
Cell culture, mice tumor samples, and patient sample cohort.
The HCC827, A549, and H1650 cell lines were purchased from ATCC. The H3255 cell line was a gift from Katerina Politi and Harold Varmus, Memorial Sloan-Kettering Cancer Center, New York, New York, USA. All cell lines were cultured according to the manufacturer’s instructions. EGFRL858R-derived tumor samples (22) were provided by Katerina Politi and Harold Varmus. Pten/Mmac1+/– heterozygous mice and K-RasLA2 mice were obtained from the NCI Mouse Repository. At time of surgery, tumor samples were obtained by the surgeon and immediately snap frozen in liquid nitrogen to avoid protease and/or phosphatase activity. Each specimen was then processed for banking by bisecting the specimen, placing one piece in a freezing tube, and immersing in liquid nitrogen; the other half was a “mirror image” of the frozen specimen and was placed in formalin and used to make a paraffin tissue block. One H&E slide from the paraffin block was analyzed and assessed for the percentage of the specimen that was tumor. The time from release from operating room to the time of freezing was recorded for every sample analyzed; this interval was 30 minutes or less to prevent RNA and protein degradation.
Chemicals.
Erlotinib was obtained from OSI Pharmaceuticals Inc./Astellas; AKT inhibitor MK-2206 from Selleck; MEK inhibitor AZD6244 from Selleck; and TFP from Sigma-Aldrich. All chemicals were dissolved in DMSO at either 10 mM stock solution (erlotinib, MK-2206, and AZD6244) or 80 mM stock solution (TFP). Further dilutions to the required concentration were made in RPMI 1640 medium (Fisher Scientific).
Antibodies.
Rabbit antibodies specific for p-EGFR (no. 2234), EGFR (no. 4405), L858R (no. 3197), p-AKT (no. 4058), AKT (no. 9272), p-ERK (no. 9272), ERK (no. 4695), cleaved caspase-3 (no. 9/661), p-FOXO1 (no. 2486), and FOXO1 (no. 2880) were obtained from Cell Signaling Technology. Rabbit polyclonal KLF6 antibody (sc-7158), goat polyclonal actin antibody (sc-1616), and mouse monoclonal GAPDH antibody (sc-32233) were purchased from Santa Cruz Biotechnology Inc. Rabbit polyclonal PARP antibody (G7341) was obtained from Promega.
Somatic mutation PCR array.
DNA was isolated using DNeasy (QIAGEN) as per the supplier’s protocol. We carried out genomic mutation analysis of the cohort using the SABiosciences qBiomarker Somatic Mutation PCR array (QIAGEN) for the EGFR pathway. Common mutation analysis was performed for the following genes: AKT, BRAF, EGFR, KRAS, HRAS, NRAS, MEK1, PIK3CA, and PTEN. All mutations were confirmed by direct sequencing of the tumor DNA sample by an independent PCR reaction and confirmed to be somatic by sequencing of the matched normal sample for each patient.
qRT-PCR.
RNA was isolated from cell lines and tumor samples using the RNeasy Mini Kit (QIAGEN) as per the manufacturer’s instructions. For each PCR reaction, 1 μg RNA was reverse transcribed using iScript cDNA synthesis kit (Bio-Rad). Each cDNA sample was subjected to sequence-specific partial amplification with specific primers and the SYBR green PCR Master Mix (Applied Biosystems) on an ABI PRISM 7900HT plate-reader instrument. Expression levels of KLF6 mRNA were determined with validated KLF6-specific primer sequences as previously described (19). The following primers were also used: FOXO1 forward, 5′-AAGGATAAGGGTGACAGCAACAG-3′ and reverse, 5′-TTGCTGTGTAGGGACAGATTATGAC-3′; EGFR forward, 5′-TCCTCTGGAGGCTGAGAAAA-3′ and reverse, 5′-GGGCTCTGGAGGAAAAGAAA-3′. All values were normalized to GAPDH levels, 18S, and actin internal controls.
Normalization to housekeeping genes.
All qRT-PCR experiments were normalized to 3 separate housekeeping genes, GAPDH, β-actin, and 18S. This was to confirm that results were not due to variability within housekeeping gene expression. All experiments were performed in triplicate and independently validated with 3 biological replicates. The data presented in the figures represent analysis based on normalization to GAPDH unless otherwise stated. Similar results were obtained with normalization to β-actin and 18S expression. All Western blots were normalized to GAPDH, β-actin, and tubulin. Again, this was to confirm that results were not due to variability in housekeeping protein expression. The data presented in the figures represent densitometry analysis via ImageJ ( http://rsb.info.nih.gov/ij/) normalized to GAPDH in cell line analysis and tubulin in analysis of tissues from mice. Again, similar results were obtained when protein expression was normalized to β-actin and tubulin. All experiments were independently validated with 3 biological replicates.
Plasmids and siRNAs.
AKTmyr and FOXO1 plasmids (Addgene) were transfected into cells by Lipofectamine 2000 incubation for 20 minutes per the manufacturer’s protocol. We transfected validated KLF6-specific siRNA (Dharmacon: ON-TARGETplus GCAGGAAAGUUUACACCAA) using HiPerFect (QIAGEN) into cell lines seeded at 60%–70% confluence. For transient FOXO1 inhibition, we used FOXO1A ON-TARGETplus SMARTpool from Dharmacon. For stable KLF6 inhibition, we designed pSUPER.retro.puro vectors (Oligoengine) encoding shRNA targeting KLF6 (CAAAAGCUCCCACUUGAAA). A pSUPER vector encoding Luciferase shRNA was used as a control. For stable FOXO1 inhibition, we used SMARTvector 2.0 lentiviral shRNA particles from Dharmacon. Knockdown and overexpression were assessed by Western blotting and qRT-PCR.
KLF6 promoter assay.
HCC827 cells were cotransfected with 1 μg pGL3-KLF6 promoter luciferase construct and pRL-TK plasmid (24) (as a control for transfection efficiency). Six hours after transfection, cells were treated with increasing doses of erlotinib. Twenty-four hours after treatment, we prepared cell lysates using the Dual-Luciferase Reporter Assay system (Promega). We analyzed luciferase activity in 20 μl lysate using a Modulus II Microplate Multimode Reader.
Nuclear cytoplasmic fractionation.
HCC827 and H1650 cells were seeded and grown to 60%–70% confluence and treated with erlotinib and TFP/MK-2206, respectively. Cell lysates were extracted using NE-PER Nuclear and Cytoplasmic Extraction Reagents (Thermo Scientific) according to the manufacturer’s protocol.
Clonogenic assay.
HCC827 shLuc and shKLF6 cells were plated at a low density in 6-well plates. After 24 hours, cells were treated with 50 nM erlotinib and incubated for 7 days. Cells were fixed and then stained with 1% crystal violet staining solution. Quantitation was completed using the cell counter function of ImageJ.
TUNEL assay and immunohistochemistry.
The ApopTag Fluorescein In Situ Apoptosis Detection kit (Millipore) was used according to the manufacturer’s protocol to perform TUNEL assays. Vectashield Mounting Medium with Propidium Iodide (Vector Laboratories) was used for counterstaining. Quantitation of images obtained from TUNEL was performed using NIS-Elements for Basic Sciences (NIKON). H&E staining was performed using standard procedures. Paraffin-embedded tumors were stained with anti-PCNA (FL-261, Santa Cruz Biotechnology Inc.), anti-FOXO1 (2880, Cell Signaling Technology), anti–p-AKT (4060, Cell Signaling Technology), and anti-KLF6 (sc-7158, Santa Cruz Biotechnology Inc.) antibodies. Briefly, sections were deparaffinized with xylene and rehydrated through graded alcohol washes, followed by antigen retrieval in a pressure cooker (Dako) in sodium citrate buffer (10 mM, pH 6.0). Slides were blocked in normal goat serum (S-1000, Vector) incubated in primary antibody at 4°C overnight. Biotinylated anti-rabbit IgG (E0432, Dako) was used as secondary antibody. Staining was visualized using DAB, and slides were counterstained with hematoxylin, dehydrated, and mounted. Immunohistochemistry was performed with the Dako Catalyzed Signal Amplification kit (K1500, Dako) for p-AKT, FOXO1, and KLF6 antibodies. Bright-field and fluorescent images were captured using a Stereoscope or Axioplan 2 IE microscope (Zeiss). Quantitation was completed using the cell counter function of ImageJ.
Immunocytochemistry.
Cell lines were plated on glass coverslips at a density of 150,000 cells in complete RPMI medium. Cells were then fixed in 4% paraformaldehyde at 24 hours after plating and were incubated with FOXO1 (1:100) primary antibody (9454, Cell Signaling Technology) for 1 hour. After incubation with a secondary goat anti-rabbit IgG (1:1,000), (H+L) FITC conjugate (AP307F, Millipore), coverslips were mounted with Vectashield DAPI counterstain (H1200) and visualized under a fluorescence microscope.
Analysis of apoptosis.
After the cells were either treated with a drug or transfected with siRNA, they were stained with propidium iodide to ascertain the DNA content and determine cell cycle distribution within the cell population as previously described (44). Sub-G1 peaks were analyzed on DNA histograms; hypodiploid DNA represented dead cells. This fraction included apoptotic as well as necrotic cells. Annexin V staining was performed using Annexin V conjugate (Invitrogen, Alexa Fluor 488) and Annexin binding buffer (V13246, Invitrogen) according to the manufacturer’s protocol. Apoptosis was further validated by caspase-3 and PARP cleavage through Western blotting.
Tumorigenicity assay.
We designed pSUPER.retro.puro vectors (Oligoengine) encoding shRNA targeting KLF6. A pSUPER vector encoding luciferase shRNA was used as a control. Stable cell lines of HCC827 were generated by retroviral transfection of the pSUPER-shLuciferase (shLuc) and pSUPER-shKLF6 (shKLF6) and selected with 2 μg/ml puromycin as described previously (44). Polyclonal pools of the shRNA-infected cell lines were collected, and KLF6 knockdown was determined by qRT-PCR and Western blotting. Stable cell lines (10 × 107) were injected in the right flank of the 6- to 8-week-old female BALB/c nu/nu mice. Tumor volume was assessed weekly as previously described (44) until volumes reached an average of 100 mm3. The following treatments were administered via intraperitoneal injection: vehicle (DMSO) and erlotinib (25 mg/kg). A total of 4 treatments were given, with a 48-hour rest period.
H1650 cells (5 × 10⁶) were similarly injected into the right flank of 6- to 8-week-old female BALB/c nu/nu mice. Tumor volume was assessed weekly as previously described (44), until volumes reached an average of 200 mm3. The following treatments were administered via intraperitoneal injection: vehicle control (DMSO), erlotinib (25 mg/kg), TFP (10 mg/kg), and combination erlotinib (25 mg/kg) and TFP (10 mg/kg). A total of 4 treatments were given, with a 48-hour rest period.
Statistical analyses and densitometric analysis.
Enhanced chemiluminescent images of immunoblots were analyzed by scanning densitometry and quantified with NIH ImageJ software using the average of 3 independent measurements. All values were normalized to actin, tubulin, or GAPDH expression and expressed as fold change relative to control. Patient cohort analysis was performed using GraphPad Prism. All statistical analyses were conducted using the SPSS software statistical package, version 17.0. Statistical significance was assumed for a 2-tailed P value less than 0.05 using Students’ t test or ANOVA with the Tukey post-hoc test (presented as means; error bars indicate SD). Except where otherwise noted, box boundaries of all box-and-whisker plots represent the range of values obtained in the experiment and whiskers represent mean ± SD.
Study approval.
All animal studies were approved by the Mount Sinai School of Medicine IACUC. Human tissue samples were obtained from the Mount Sinai BioBank under IRB approval.
Supplementary Material
Acknowledgments
We would like to thank the Howard Hughes Medical Institute (HHMI) for providing funding for the work. Goutham Narla is a recipient of the HHMI Physician-Scientist Early Career Award, is supported by the Tisch Cancer Institute through the Young Scientist Cancer Research Fund and by the Young Scientist Foundation, and is a Harrington scholar through the Harrington Discovery Institute at University Hospitals/Case Western Reserve University. We would also like to thank Stuart Packer, Andrew Castaldi, Shen Yao, Alice Levine, Alexander Kirshenbaum, Stephanie Sagar, Nikhilesh Sangodkar, Christine Lee, Heriberto Fernandez, Cristina Geada, Fei Huang, Kasey Grewe, Agnes Stachnik, Peter Cardoz, Vikram Gidwani, Floyd and Barkha Cardoz, and Blake Smith for technical assistance with the manuscript.
Footnotes
Conflict of interest: The Mount Sinai School of Medicine on behalf of the authors Goutham Narla and Michael Ohlmeyer have filed for a patent covering method-of-use claims for the combination use of tricyclic neuroleptics and anti-EGFR–based therapies for the treatment of human cancer.
Citation for this article: J Clin Invest. 2012;122(7):2637–2651. doi:10.1172/JCI62058.
References
- 1.Kobayashi S, et al. EGFR mutation and resistance of non-small-cell lung cancer to gefitinib. N Engl J Med. 2005;352(8):786–792. doi: 10.1056/NEJMoa044238. [DOI] [PubMed] [Google Scholar]
- 2. Pao W, et al. Acquired resistance of lung adenocarcinomas to gefitinib or erlotinib is associated with a second mutation in the EGFR kinase domain. PLoS Med. 2005. 2 3 e73 . 10.1371/journal.pmed.0020073 [DOI] [PMC free article] [PubMed] [Google Scholar]
- 3.Shepherd FA, et al. Erlotinib in previously treated non-small-cell lung cancer. N Engl J Med. 2005;353(2):123–132. doi: 10.1056/NEJMoa050753. [DOI] [PubMed] [Google Scholar]
- 4. Pao W, et al. KRAS mutations and primary resistance of lung adenocarcinomas to gefitinib or erlotinib. PLoS Med. 2005. 2 1 e17 . 10.1371/journal.pmed.0020017 [DOI] [PMC free article] [PubMed] [Google Scholar]
- 5.Endoh H, Yatabe Y, Kosaka T, Kuwano H, Mitsudomi T. PTEN and PIK3CA expression is associated with prolonged survival after gefitinib treatment in EGFR-mutated lung cancer patients. J Thorac Oncol. 2006;1(7):629–634. doi: 10.1097/01243894-200609000-00006. [DOI] [PubMed] [Google Scholar]
- 6.Engelman JA, et al. MET amplification leads to gefitinib resistance in lung cancer by activating ERBB3 signaling. Science. 2007;316(5827):1039–1043. doi: 10.1126/science.1141478. [DOI] [PubMed] [Google Scholar]
- 7.Sos ML, et al. PTEN loss contributes to erlotinib resistance in EGFR-mutant lung cancer by activation of Akt and EGFR. Cancer Res. 2009;69(8):3256–3261. doi: 10.1158/0008-5472.CAN-08-4055. [DOI] [PMC free article] [PubMed] [Google Scholar]
- 8.Sequist LV, et al. Genotypic and histological evolution of lung cancers acquiring resistance to EGFR inhibitors. Sci Transl Med. 2011;3(75):75ra26. doi: 10.1126/scitranslmed.3002003. [DOI] [PMC free article] [PubMed] [Google Scholar]
- 9.DiFeo A, Martignetti JA, Narla G. The role of KLF6 and its splice variants in cancer therapy. Drug Resist Updat. 2009;12(1–2):1–7. doi: 10.1016/j.drup.2008.11.001. [DOI] [PubMed] [Google Scholar]
- 10.Beer DG, et al. Gene-expression profiles predict survival of patients with lung adenocarcinoma. Nat Med. 2002;8(8):816–824. doi: 10.1038/nm733. [DOI] [PubMed] [Google Scholar]
- 11.Kettunen E, et al. Differentially expressed genes in nonsmall cell lung cancer: expression profiling of cancer-related genes in squamous cell lung cancer. Cancer Genet Cytogenet. 2004;149(2):98–106. doi: 10.1016/S0165-4608(03)00300-5. [DOI] [PubMed] [Google Scholar]
- 12.Abbott B, et al. Search for large extra dimensions in dielectron and diphoton production. Phys Rev Lett. 2001;86(7):1156–1161. doi: 10.1103/PhysRevLett.86.1156. [DOI] [PubMed] [Google Scholar]
- 13.Ito G, et al. Krüppel-like factor 6 is frequently down-regulated and induces apoptosis in non-small cell lung cancer cells. Cancer Res. 2004;64(11):3838–3843. doi: 10.1158/0008-5472.CAN-04-0185. [DOI] [PubMed] [Google Scholar]
- 14.Terragni J, Graham JR, Adams KW, Schaffer ME, Tullai JW, Cooper GM. Phosphatidylinositol 3-kinase signaling in proliferating cells maintains an anti-apoptotic transcriptional program mediated by inhibition of FOXO and non-canonical activation of NFkappaB transcription factors. BMC Cell Biol. 2008;9:6. doi: 10.1186/1471-2121-9-6. [DOI] [PMC free article] [PubMed] [Google Scholar]
- 15.Shimamura T, Imoto S, Yamaguchi R, Nagasaki M, Miyano S. Inferring dynamic gene networks under varying conditions for transcriptomic network comparison. Bioinformatics. 2010;26(8):1064–1072. doi: 10.1093/bioinformatics/btq080. [DOI] [PubMed] [Google Scholar]
- 16.Lam EW, Francis RE, Petkovic M. FOXO transcription factors: key regulators of cell fate. Biochem Soc Trans. 2006;34(pt 5):722–726. doi: 10.1042/BST0340722. [DOI] [PubMed] [Google Scholar]
- 17.Aoki M, Jiang H, Vogt PK. Proteasomal degradation of the FoxO1 transcriptional regulator in cells transformed by the P3k and Akt oncoproteins. Proc Natl Acad Sci U S A. 2004;101(37):13613–13617. doi: 10.1073/pnas.0405454101. [DOI] [PMC free article] [PubMed] [Google Scholar]
- 18.Bhattacharjee A, et al. Classification of human lung carcinomas by mRNA expression profiling reveals distinct adenocarcinoma subclasses. Proc Natl Acad Sci U S A. 2001;98(24):13790–13795. doi: 10.1073/pnas.191502998. [DOI] [PMC free article] [PubMed] [Google Scholar]
- 19.DiFeo A, et al. Roles of KLF6 and KLF6-SV1 in ovarian cancer progression and intraperitoneal dissemination. Clin Cancer Res. 2006;12(12):3730–3739. doi: 10.1158/1078-0432.CCR-06-0054. [DOI] [PubMed] [Google Scholar]
- 20.Amit I, et al. A module of negative feedback regulators defines growth factor signaling. Nat Genet. 2007;39(4):503–512. doi: 10.1038/ng1987. [DOI] [PubMed] [Google Scholar]
- 21.Paez JG, et al. EGFR mutations in lung cancer: correlation with clinical response to gefitinib therapy. Science. 2004;304(5676):1497–1500. doi: 10.1126/science.1099314. [DOI] [PubMed] [Google Scholar]
- 22. Politi K, Zakowski MF, Fan PD, Schonfeld EA, Pao W, Varmus HE. Lung adenocarcinomas induced in mice by mutant EGF receptors found in human lung cancers respond to a tyrosine kinase inhibitor or to down-regulation of the receptors. Genes Dev. 2006. 20 11 1496 1510 . 10.1101/gad.1417406 [DOI] [PMC free article] [PubMed] [Google Scholar]
- 23.Yu J, et al. Mutation-specific antibodies for the detection of EGFR mutations in non-small-cell lung cancer. Clin Cancer Res. 2009;15(9):3023–3028. doi: 10.1158/1078-0432.CCR-08-2739. [DOI] [PubMed] [Google Scholar]
- 24.Yea S, et al. Ras promotes growth by alternative splicing-mediated inactivation of the KLF6 tumor suppressor in hepatocellular carcinoma. Gastroenterology. 2008;134(5):1521–1531. doi: 10.1053/j.gastro.2008.02.015. [DOI] [PMC free article] [PubMed] [Google Scholar]
- 25.Citri A, Yarden Y. EGF-ERBB signalling: towards the systems level. Nat Rev Mol Cell Biol. 2006;7(7):505–516. doi: 10.1038/nrm1962. [DOI] [PubMed] [Google Scholar]
- 26.Johnson L, et al. Somatic activation of the K-Ras oncogene causes early onset lung cancer in mice. Nature. 2001;410(6832):1111–1116. doi: 10.1038/35074129. [DOI] [PubMed] [Google Scholar]
- 27.Davies BR, et al. AZD6244 (ARRY-142886), a potent inhibitor of mitogen-activated protein kinase/extracellular signal-regulated kinase kinase 1/2 kinases: mechanism of action in vivo, pharmacokinetic/pharmacodynamic relationship, and potential for combination in preclinical models. Mol Cancer Ther. 2007;6(8):2209–2219. doi: 10.1158/1535-7163.MCT-07-0231. [DOI] [PubMed] [Google Scholar]
- 28.Yeh TC, et al. Biological characterization of ARRY-142886 (AZD6244), a potent, highly selective mitogen-activated protein kinase kinase 1/2 inhibitor. Clin Cancer Res. 2007;13(5):1576–1583. doi: 10.1158/1078-0432.CCR-06-1150. [DOI] [PubMed] [Google Scholar]
- 29.Podsypanina K, et al. Mutation of Pten/Mmac1 in mice causes neoplasia in multiple organ systems. Proc Natl Acad Sci U S A. 1999;96(4):1563–1568. doi: 10.1073/pnas.96.4.1563. [DOI] [PMC free article] [PubMed] [Google Scholar]
- 30. Hirai H, et al. MK-2206, an allosteric Akt inhibitor, enhances antitumor efficacy by standard chemotherapeutic agents or molecular targeted drugs in vitro and in vivo. Mol Cancer Ther. 2010. 9 7 1956 1967 . 10.1158/1535-7163.MCT-09-1012 [DOI] [PubMed] [Google Scholar]
- 31.Sarbassov DD, Guertin DA, Ali SM, Sabatini DM. Phosphorylation and regulation of Akt/PKB by the rictor-mTOR complex. Science. 2005;307(5712):1098–1101. doi: 10.1126/science.1106148. [DOI] [PubMed] [Google Scholar]
- 32.Meng J, et al. Combination treatment with MEK and AKT inhibitors is more effective than each drug alone in human non-small cell lung cancer in vitro and in vivo. PLoS One. 2010;5(11):e14124. doi: 10.1371/journal.pone.0014124. [DOI] [PMC free article] [PubMed] [Google Scholar]
- 33.Boehm JS, et al. Integrative genomic approaches identify IKBKE as a breast cancer oncogene. Cell. 2007;129(6):1065–1079. doi: 10.1016/j.cell.2007.03.052. [DOI] [PubMed] [Google Scholar]
- 34.Guigon CJ, Zhao L, Willingham MC, Cheng SY. PTEN deficiency accelerates tumour progression in a mouse model of thyroid cancer. Oncogene. 2009;28(4):509–517. doi: 10.1038/onc.2008.407. [DOI] [PMC free article] [PubMed] [Google Scholar]
- 35.Maekawa T, et al. Expression and localization of FOXO1 in non-small cell lung cancer. Oncol Rep. 2009;22(1):57–64. [PubMed] [Google Scholar]
- 36.Paik JH, et al. FoxOs are lineage-restricted redundant tumor suppressors and regulate endothelial cell homeostasis. Cell. 2007;128(2):309–323. doi: 10.1016/j.cell.2006.12.029. [DOI] [PMC free article] [PubMed] [Google Scholar]
- 37.Jackson JG, Kreisberg JI, Koterba AP, Yee D, Brattain MG. Phosphorylation and nuclear exclusion of the forkhead transcription factor FKHR after epidermal growth factor treatment in human breast cancer cells. Oncogene. 2000;19(40):4574–4581. doi: 10.1038/sj.onc.1203825. [DOI] [PubMed] [Google Scholar]
- 38.Zhang X, et al. Phosphorylation of serine 256 suppresses transactivation by FKHR (FOXO1) by multiple mechanisms. Direct and indirect effects on nuclear/cytoplasmic shuttling and DNA binding. J Biol Chem. 2002;277(47):45276–45284. doi: 10.1074/jbc.M208063200. [DOI] [PubMed] [Google Scholar]
- 39.Camacho–Vanegas O, et al. Functional inactivation of the KLF6 tumor suppressor gene by loss of heterozygosity and increased alternative splicing in glioblastoma. Int J Cancer. 2007;121(6):1390–1395. doi: 10.1002/ijc.22809. [DOI] [PubMed] [Google Scholar]
- 40.Brunet A, et al. Akt promotes cell survival by phosphorylating and inhibiting a Forkhead transcription factor. Cell. 1999;96(6):857–868. doi: 10.1016/S0092-8674(00)80595-4. [DOI] [PubMed] [Google Scholar]
- 41.Kau TR, et al. A chemical genetic screen identifies inhibitors of regulated nuclear export of a Forkhead transcription factor in PTEN-deficient tumor cells. Cancer Cell. 2003;4(6):463–476. doi: 10.1016/S1535-6108(03)00303-9. [DOI] [PubMed] [Google Scholar]
- 42. Bivona TG, et al. FAS and NF-κB signalling modulate dependence of lung cancers on mutant EGFR. Nature. 2011. 471 7339 523 526 . 10.1038/nature09870 [DOI] [PMC free article] [PubMed] [Google Scholar]
- 43.Jemal A, Siegel R, Xu J, Ward E. Cancer statistics, 2010. CA Cancer J Clin. 2010;60(5):277–300. doi: 10.3322/caac.20073. [DOI] [PubMed] [Google Scholar]
- 44.Sangodkar J, et al. Targeted reduction of KLF6-SV1 restores chemotherapy sensitivity in resistant lung adenocarcinoma. Lung Cancer. 2009;66(3):292–297. doi: 10.1016/j.lungcan.2009.02.014. [DOI] [PMC free article] [PubMed] [Google Scholar]
Associated Data
This section collects any data citations, data availability statements, or supplementary materials included in this article.