

Abstract
The contraction pattern of the heart relies on the activation and conduction of the electrical impulse. Perturbations of cardiac conduction have been associated with congenital and acquired arrhythmias as well as cardiac arrest. The pattern of conduction depends on the regulation of heterogeneous gene expression by key transcription factors and transcriptional enhancers. Here, we assessed the genome-wide occupation of conduction system–regulating transcription factors TBX3, NKX2-5, and GATA4 and of enhancer-associated coactivator p300 in the mouse heart, uncovering cardiac enhancers throughout the genome. Many of the enhancers colocalized with ion channel genes repressed by TBX3, including the clustered sodium channel genes Scn5a, essential for cardiac function, and Scn10a. We identified 2 enhancers in the Scn5a/Scn10a locus, which were regulated by TBX3 and its family member and activator, TBX5, and are functionally conserved in humans. We also provided evidence that a SNP in the SCN10A enhancer associated with alterations in cardiac conduction patterns in humans disrupts TBX3/TBX5 binding and reduces the cardiac activity of the enhancer in vivo. Thus, the identification of key regulatory elements for cardiac conduction helps to explain how genetic variants in noncoding regulatory DNA sequences influence the regulation of cardiac conduction and the predisposition for cardiac arrhythmias.
Introduction
Abnormal heart rhythms are common and cause significant morbidity and mortality. Arrhythmias may present around birth as part of a congenital heart defect, the most common etiology of birth abnormalities. However, the majority of arrhythmias develop with increasing age or as a comorbidity. These include sinus node dysfunction, atrioventricular (AV) block, and atrial fibrillation, the most common arrhythmia encountered in clinical practice causing significant morbidity and mortality (1). Sudden cardiac death from ventricular fibrillation, occurring mostly in the setting of coronary heart disease, is a leading cause of death (2). Although molecular, genetic, and physiological mechanisms have been described, most of the underlying causes are insufficiently understood (3).
Rhythmic and synchronized contraction of the atria and ventricles of the heart crucially relies on the proper generation and conduction of the cardiac electrical impulse. This process necessitates localized cardiomyocyte specialization in the different heart components (atria, AV node, ventricular conduction system, etc.) and demands that the cells possess specific electrophysiological characteristics. These intrinsic heterogeneities are rooted, at least in part, in the regional, compartment-specific differences in ion channel and gap junction gene expression, the defining factors of electrophysiology that derive action potential shape and intercellular propagation of the impulse (4–8).
The development and function of the heart components is driven by a set of interacting DNA binding transcription factors and chromatin remodeling proteins that form evolutionarily conserved regulatory networks (9–11). These transcription factors interact with specific noncoding regulatory DNA sequences (i.e., enhancers) of many genes to activate or repress their activity. It is becoming increasingly clear that these same transcription factors play essential roles in regulating regionalized expression of ion channel and gap junction genes, affecting cardiac electrophysiology. Hallmark examples include transcription factors essential for heart development (e.g., NKX2-5 and TBX5), which activate gap junction subunit–encoding genes (e.g., CX40, encoded by Gja5) and ion channel genes and which, when mutated, can bring about electrical abnormalities such as AV conduction block and atrial fibrillation in humans (12–17). TBX2 and TBX3 are specifically expressed in — and critical for the development of — the sinus node, AV canal (AVC), and derived AV node and AV bundle (18–21). These factors may compete with TBX5 for the same DNA binding sites, but repress expression of gap junction proteins (e.g., CX40 and CX43) and ion channels (e.g., the sodium channel Scn5a) in pacemaker tissues of the sinus node and AVC (18, 22). The interplay between transcription factors expressed in broader patterns (i.e., TBX5 is expressed in atria and entire conduction system) and factors that display restricted patterns (i.e., TBX3 is expressed in sinus node and AV conduction system) provide essential contributions to the electrical pattern of the heart (refs. 11, 16, 18, 23–28, and Supplemental Figure 1; supplemental material available online with this article; doi: 10.1172/JCI62613DS1).
A series of genome-wide association studies (GWAS) (29–33) revealed that common variants in the population link genomic regions that modulate cardiac impulse conduction and repolarization, disturbances that increase the risk of arrhythmia. Interestingly, these variants were linked to essential cardiac transcription factors (e.g., NKX2-5, TBX5, and TBX3) and ion channels (e.g., SCN5A and SCN10A). Several of the variants were identified in noncoding sequences nearby these genes, which indicates that they represent potential enhancers controlling the localized and tissue-specific expression of these genes. These observations indicated that variants in regulatory elements of ion channel genes modulate development and homeostasis of the localized electrophysiological properties of the heart. However, the difficulties involved in the identification of functional enhancers in vivo has meant that insight into this process is lacking.
Here we investigated the transcriptional network by assessing the genome-wide DNA interaction of the key cardiac transcription factors TBX3/TBX5, NKX2-5, and GATA4 and of the ubiquitously expressed enhancer-associated factor p300 (34–37) in the mouse heart in vivo, and identified many candidate cardiac enhancers. We further analyzed how known human genetic variants in these cardiac enhancers may affect transcription factor binding, and thus their activity. For the first time to our knowledge, we provide functional explanations for the effects of variants in noncoding DNA on cardiac conduction and arrhythmias.
Results
ChIP-seq analysis in adult mouse hearts and de novo definition of consensus transcription factor binding sites.
The genome-wide occupancy profile of TBX3 in the heart was assessed using ChIP–massive parallel sequencing (ChIP-seq) analysis (38). Tbx3 is only expressed in the conduction system of the heart, a very small fraction of the total adult heart that is too small for ChIP-seq analysis (22). Therefore, Tbx3 expression was induced in all myocardial cells using mice with a Cre-inducible Tbx3 expression cassette (CT3) (18) and a cardiomyocyte-specific tamoxifen-inducible Cre expression cassette (Myh6-mER-Cre-mER) (39). At 1 day after the last treatment with tamoxifen, animals appeared healthy, but showed strong downregulation of known TBX3 targets, including Gja1 (encoding CX43) and Gja5 (encoding CX40) (40). We reasoned that ectopically expressed TBX3 in the working myocardium would reveal binding sites normally occupied by TBX3 in the conduction system myocardium. However, TBX3 and TBX5 (members of the TBX2 subfamily expressed in adult heart) recognize highly similar binding sites, which indicates that this approach may also reveal TBX5 binding sites. Unfortunately, whereas ChIP of TBX5 was successful, we repeatedly failed to sequence enriched fragments because of technical problems during sequence library construction. Therefore, we performed ChIP–quantitative PCR (qPCR) and established that endogenous TBX5 in the adult heart interacted with the sites occupied by ectopically expressed TBX3 (see below). We also established the occupancy of endogenous NKX2-5 and GATA4, 2 cardiac transcription factors that cooperate with T-box factors (41). It has previously been shown that occupancy by the enhancer-associated protein p300 can predict the location of heart enhancers (34). To address this, we determined the occupancy profile of p300 (Supplemental Figure 2). In all cases we used ChIP-grade antibodies against the native factors.
We first evaluated the quality of our ChIP-seq experiments by determining the overlap in peaks between the TBX3 and control ChIP-seq datasets. These datasets possessed a total of 25,446 and 1,089 peaks, respectively, with an overlap of 131. The overlapping peaks were subtracted from the main TBX3 dataset as likely false positive peaks. Next, we determined the number of peaks for both the NKX2-5 and the GATA4 ChIP-seq datasets (Figure 1A), similarly removing peaks that overlapped with the control dataset. The resulting datasets were used to analyze the distribution of factor binding regions across the genome. For this analysis, a promoter region of 1 kb upstream of all genes was used to define the number of peaks associated with a promoter. The distribution of the remaining peaks was then assessed in terms of intragenic or intergenic. This analysis revealed that the majority of peaks in all 3 datasets were positioned within a gene sequence (exons and introns), with a significant enrichment of peaks associated with a promoter region (P < 0.001). Our p300 data in general were in good agreement with the published data (34–36).
Figure 1. In vitro validation of ChIP-seq datasets.

(A) Overlap of all ChIP-seq binding regions with genes in refGene plus their promoters, defined here as the 1-kb upstream region of those genes. Values are percentage of all peaks. See Methods for a detailed description of peak definition. (B) Results obtained from the MEME motif discovery analysis. Binding motifs were in good agreement with those recently published for the HL-1 based ChIP-seq (35) and JASPAR motifs. (C) Number of overlapping binding regions between heart-derived ChIP-seq datasets. (D) ChIP-qPCR assay validating ChIP-seq peaks. Regions were randomly chosen from the group of ChIP-seq peaks that showed overlap between ChIP sequencing datasets for TBX3, GATA4 and NKX2-5. Shown is enrichment relative to Hprt for NKX2-5, GATA4, and TBX5 in WT adult mouse hearts and for TBX3 in TBX3-induced adult hearts. Ratios below represent the proportion of peaks that showed relative enrichment of more than 10. (E) Of the regions tested with ChIP-qPCR, 11 were tested for their response to NKX2-5, GATA4, and TBX5 or TBX3 in Cos7 cells. All enhancers responded to stimulation with GATA4 and NKX2-5. *P < 0.05.
To investigate whether the ChIP peaks directly correlate to DNA binding elements for TBX3/TBX5, NKX2-5, and GATA4, we performed de novo motif discovery using MEME (42). Using 600 random peaks of each transcription factor, our MEME analysis yielded motifs (Figure 1B) in good agreement with those derived from ChIP-seq data of biotinylated TBX5, NKX2-5, and GATA4 expressed in HL-1 cells (ref. 35 and Supplemental Figure 3). We found near-perfect matches for the GATA4 motif in the JASPAR (43, 44) and TRANSFAC (45) databases. Interestingly, the NKX2-5 ChIP-seq motif showed a closer resemblance to the NKX3-2 consensus site found in the JASPAR database, compared with the NKX2-5 consensus site. The ChIP-seq motif for TBX3/TBX5 resembled the motif for T in the JASPAR database and for TBX5 in the TRANSFAC database.
TBX3, TBX5, NKX2-5, and GATA4 are known to interact with each other in the regulation of transcription (46, 47). Recent ChIP-seq analysis of biotinylated TBX5, NKX2-5, and GATA4 in HL-1 cells indicated that overlapping peak regions often represent bona fide regulatory elements (35). Therefore, we assessed the intersections of our in vivo TBX3/TBX5, NKX2-5, and GATA4 datasets (Figure 1C) and found that the intragenic portion of the 185 overlapping peak regions was significantly enriched for GO terms for heart and muscle system development (Supplemental Figure 4A). Comparison of terms associated with the molecular function of the NKX2-5–GATA4 overlap and the TBX3–NKX2-5–GATA4 intersect revealed that inclusion of TBX3 resulted mainly in an enrichment of terms associated with ion binding (Supplemental Table 4). Furthermore, we found an overlap of 63.2% of TBX3 peak regions with the TBX5 dataset derived from HL-1 cells (35), demonstrating good correlation between the binding peak data of these closely related T-box proteins, despite the difference between the 2 experimental systems. Conversely, the TBX20 peak dataset (48) showed only a 17.8% overlap with our TBX3 dataset, consistent with the observed difference in binding motif.
We selected 21 peak regions occupied by TBX3, NKX2-5, and GATA4 and validated binding in adult mouse hearts using ChIP-qPCR (Figure 1D). A mean enrichment of 70- to 80-fold was observed for the transcription factors at these genomic locations. Furthermore, of 45 TBX3-occupied sites tested, 43 were occupied by endogenous TBX5. In addition, 22 of 25 tested genomic sites were also occupied by endogenous TBX3 in the developing heart (Supplemental Figure 5). These data support the notion that TBX3 and TBX5 recognize the same sites in vivo and that ChIP of TBX3 ectopically expressed in the adult heart occupies sites bound by endogenous TBX5. Using a luciferase reporter analysis, we next tested 11 of these 21 regions for their response to TBX3, TBX5, NKX2-5, and GATA4 in transient transfection assays (Figure 1E). All fragments were stimulated to varying degrees by NKX2-5 and GATA4. The effect of addition of TBX3 or TBX5 was variable, probably reflecting the complexity of enhancer function. Taken together, these results confirmed interaction of TBX3, TBX5, NKX2-5, and GATA4 with regions identified by ChIP-seq and that these regions acted as enhancers responding to the transcription factors.
Overlapping peak regions and gene expression arrays functionally classify TBX3 targets as conduction genes.
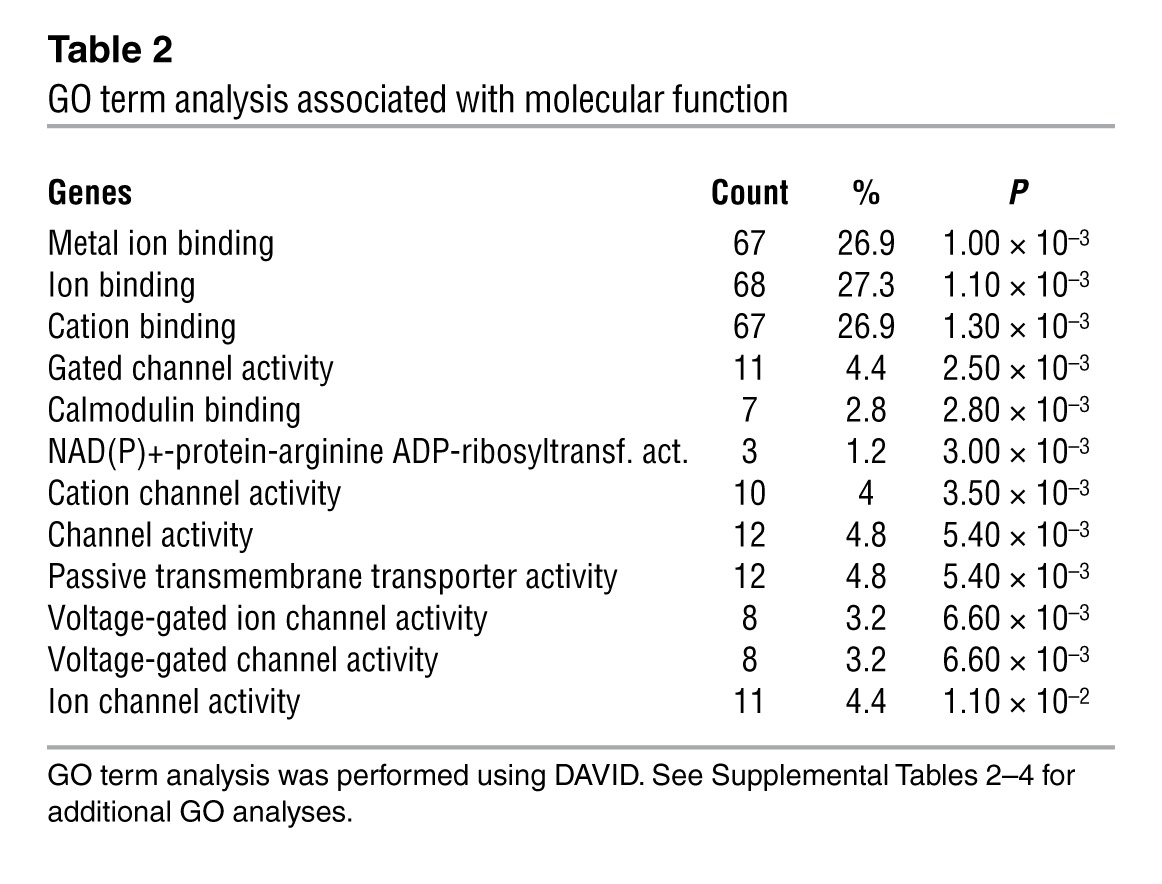
TBX3 plays a critical role in the suppression of gene expression in the pacemaker and conduction system components (18, 22, 23). We hypothesized that genes expressed at lower levels in the AVC/AV node compared with the working myocardium are expected to be enriched in genes regulated directly by TBX3. We analyzed the overlap between the gene set containing TBX3 peaks and a set of genes differentially expressed between the AVC/AV node and working myocardium (Supplemental Table 1 and ref. 22). The set of genes reduced in the AVC displayed the greatest enrichment (Supplemental Figure 4B), which indicates that TBX3 is involved in the direct suppression of this subgroup of genes. Next, we correlated TBX3 binding and TBX3-mediated gene regulation by combining the gene set containing TBX3 peaks with genes differentially expressed in heart tissue of the mice expressing tamoxifen-induced TBX3 and controls. The set of genes suppressed by TBX3 contained significantly more TBX3 binding sites compared with the induced or control gene sets (Supplemental Figure 4B). To further refine the identification of direct TBX3 gene targets, we compared sets of genes containing TBX3 peaks and enriched or reduced in AVC with those induced or suppressed by TBX3, leading to significant enrichment (Table 1). We hypothesize that the significantly enriched set of 182 genes (P < 0.01 versus the other sets) occupied by TBX3, suppressed by ectopic TBX3 expression, and reduced in the TBX3-positive AVC/AV node would reveal targets directly suppressed by TBX3 in the AVC/AV node in vivo (Table 1 and Supplemental Figure 4B). Gene Ontology (GO) term analysis using DAVID (49, 50) revealed that these genes were enriched for the terms ion transport, ion channels, and gap junctions (Table 2).
Table 1.
Comparison of TBX3 peak–containing gene sets enriched or reduced in AVC with those induced or suppressed by TBX3
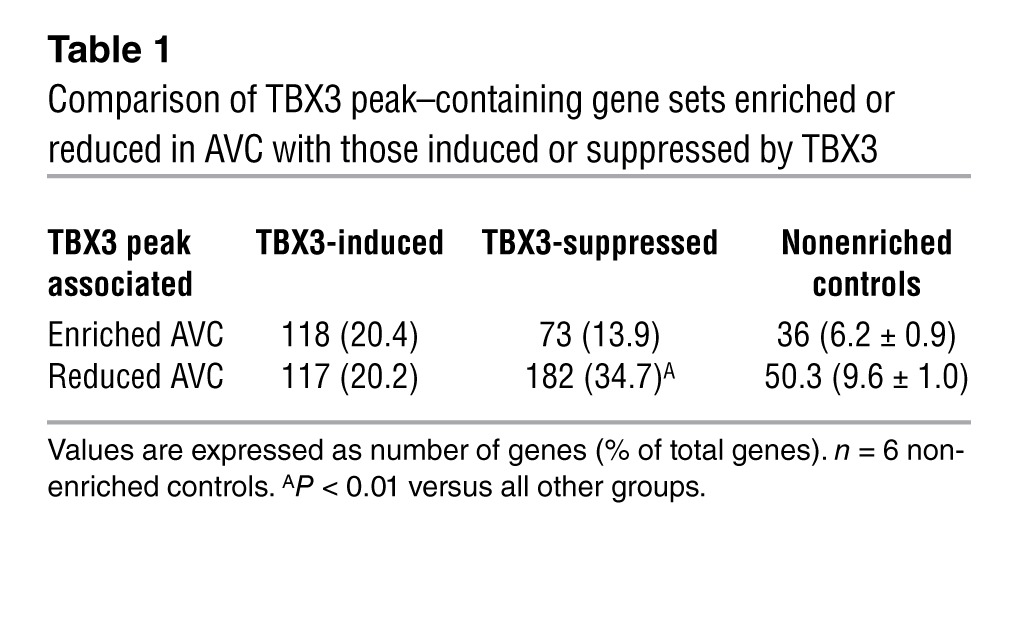
Table 2.
GO term analysis associated with molecular function
The enrichment of ion channel genes in the overlap analysis of TBX3 ChIP-seq peaks and AVC microarray data and the known role of TBX3 in conduction system and nodal development and homeostasis (18, 51–53) prompted us to analyze the response of 10 of these ion channel genes to induced TBX3 expression in the myocardium. All genes analyzed, including Scn5a and Scn10a, were found to be significantly downregulated in the presence of TBX3 in the working myocardium (Figure 2), while reference genes such as Gapdh, Hprt, Nkx2-5, and Gata4 were unaffected by the presence of TBX3 (Supplemental Figure 6).
Figure 2. TBX3 is involved in the coordinated regulation of conduction genes.

Quantitative RT-PCR analysis showed downregulation of 10 representative ion channel genes in atria of induced TBX3–expressing compared with control mice. These genes were significantly reduced in the AVC (P < 0.05) and contained ChIP-seq peaks for TBX3, GATA4, and NKX2-5. *P < 0.05.
Regulation of the Scn5a/Scn10a sodium channel gene locus by TBX3.
SCN5A encodes Nav1.5, the main sodium channel responsible for rapid depolarization. Mutations in SCN5A underlie multiple inherited arrhythmia syndromes (26, 28). SCN10A (encoding Nav1.8) has only recently been implicated in cardiac conduction in a series of GWAS (30–33, 54). Several observations suggested that Scn5a and Scn10a are regulated in a coordinated fashion by TBX3 and TBX5. Scn5a and Scn10a were positioned adjacently in the genome, both contained sites occupied by TBX3/TBX5 and other factors (Figure 3A), and both were readily downregulated by TBX3. Both genes had similar relative spatial and temporal expression profiles (for description of the Scn5a profile, see refs. 55, 56), although Scn5a expression was stronger than that of Scn10a, and its level increased in the ventricles toward the end of gestation (Supplemental Figure 7A). In situ hybridization showed that both genes had very similar expression patterns: expressed in the atria; strongest in the mediastinal atrial walls (body of atria); and weaker in the auricles and in the trabecules and crest of the interventricular septum, the precursors of the ventricular conduction system components (Figure 3B). This pattern resembled that of TBX5, a transcriptional activator expressed in atria and conduction system. Moreover, expression was absent from the TBX3-positive sinus node and AVC/AV node (Figure 3C), consistent with the notion that TBX3 suppresses these genes in its own expression domain. The genes flanking these 2 sodium channels, Scn11a and Exog, showed no binding regions for TBX3 and were not significantly downregulated by TBX3 (Supplemental Figure 7B), which indicates that TBX3-mediated regulation of this locus is likely to be confined to Scn5a and Scn10a. Taken together, these data indicate that Scn5a and Scn10a are coregulated, and that this process involves TBX3.
Figure 3. Scn5a and Scn10a are regulated by TBX3.

(A) Overview of the ChIP-seq datasets within the Scn5a/Scn10a locus including flanking genes Scn11a and Exog. Top: TBX3, GATA4, NKX2-5, and p300 datasets (present study). Bottom: published ChIP-seq datasets showing tracks for biotinylated TBX5, GATA4, and NKX2-5 expressed in HL-1 cells (35); P300 in ED11.5 embryonic mouse heart (34); and P300 and POL2 in adult mouse heart (37). (B) In situ hybridization of Scn5a and Scn10a in E14.5 WT hearts showing expression pattern overlap, and the resemblance of the Scn5a downstream enhancer fragment F9 (F9 LacZ) with these expression patterns. Arrows denote areas of highest activity, in the atrial body and future ventricular conduction system components. san, sinoatrial node; ra, right atrium; la, left atrium; rv, right ventricle; lv, left ventricle; ivs, interventricular septum; drg, dorsal root ganglion. (C) In situ hybridization of Scn5a and Scn10a in the E17.5 sinoatrial node region showing complementary patterns to Tbx3 and partial overlap with Tbx5. Dotted outlines denote the sinus node region. Original magnification, ×5 (B); ×10 (B, insets, and C).
Identification of enhancers in the Scn5a/Scn10a locus.
To gain insight into the mechanism of Scn5a/Scn10a regulation, we selected 9 fragments (F1–F9) in the Scn5a/Scn10a locus occupied by TBX3 for functional analysis using luciferase reporter assays (Figure 4A). Of these regions, 4 (F1, F2, F4, and F9) also contained NKX2-5, GATA4, and p300 peaks (Figure 3A) and overlapped with the TBX5 datasets (35). F1 and F2, located in a noncoding part of Scn10a, were strongly activated by NKX2-5 and GATA4. F9, located downstream of Scn5a, showed strong constitutive activity in H10 cells (Figure 4B). This effect was also observed for F4, located in a noncoding part of Scn5a that contains a region previously reported to affect Scn5a expression and thus modulate sodium channel function in vivo (57). Using an independent PCR-based assay, we confirmed the association of TBX3, TBX5, NKX2-5, and GATA4 with the mapped ChIP-seq positions to variable degrees of enrichment relative to Hprt gene control region in the adult heart (Figure 4C). In E10.5 mouse hearts, F1 and F2 were not found to be occupied, whereas F9 was occupied by endogenous TBX3 (Figure 4C).
Figure 4. In vitro and in vivo analyses of binding regions within the Scn5a/Scn10a locus.

(A) Overview of 9 TBX3 ChIP-seq peaks within the Scn5a/Scn10a locus chosen for further investigation based on ChIP enrichment and overlap with GATA4 and NKX2-5 ChIP-seq peaks. Regions a and b represent 2 negative control regions used for ChIP-PCR (Supplemental Figure 7C). (B) Enhancer activity in vitro. Enhancers cloned upstream of pGL2 and a minimal promoter were transfected into H10 cells with or without NKX2-5 and GATA4. Fragments F1, F2, and F6–F8 responded to addition of GATA4 and NKX2-5. F4 and F9 showed strong constitutive activity. *P < 0.05. (C) ChIP-qPCR assay for F1, F2, and F9, showing enrichment relative to Hprt for TBX3 in induced TBX3–expressing adult hearts and endogenous TBX3 in E10.5 hearts. ChIP-qPCR assays for endogenous TBX5, GATA4, and NKX2-5 were performed in WT adult mouse hearts. (D–G) Lateral views of whole embryos and magnified dorsal views of hearts (h) are shown for the reporter constructs with mouse and human F1–F2 and F9. Both human and mouse enhancers showed strong expression in the interventricular septum and, to a lesser extent, in the atria and ventricles. Ratios denote proportion of embryos showing cardiac activity.
Next, we determined the response of F1, F2, and F9 to T-box factors by means of luciferase assays. F1 and F2 were stimulated by TBX5 (activator) and repressed by both TBX3 and TBX2 (repressors). F9 was not stimulated by TBX5, but responded to TBX2 and TBX3 (Supplemental Figure 8B). The lack of response of F9 to transcription factor stimulation prompted us to analyze this region further (Supplemental Figure 8, A and C). Deletion analysis revealed a small, highly responsive fragment harboring binding sites for all transcription factors, indicative of the presence of sequences in F9 that act as suppressors.
To evaluate the in vivo activity pattern of the identified regulatory fragments, we cloned the mouse fragments into an Hsp68/LacZ reporter vector. In this assay, F1 and F2 were grouped as a single fragment, because of their close spatial association and broad base coverage by p300 association sites (Figure 5A). The F1–F2 construct showed cardiac activity in 7 of 9 embryos. The activity was weakest in the atria and in the ventricles and strongest in the region of the interventricular septum (Figure 4D). For F9, cardiac activity was observed in 6 of 6 embryos. Activity was present in the atria and ventricles, yet once again strongest in the interventricular region (Figure 4E). The activity pattern of this regulatory fragment closely resembled that of both Scn5a and Scn10a, with highest activity in the atrial body and future ventricular conduction system components (Figure 3B). The TBX3-positive sinus node was devoid of lacZ expression, consistent with the notion that TBX3 represses this fragment. Recent evidence indicated that heart enhancers are not well conserved in evolution (34, 58). Therefore, it is quite possible that the human orthologous regions do not function as enhancers. To test this possibility, the human positional orthologs of the mouse fragments were used in the same in vivo transgenic reporter assay. Human F1–F2 and F9 both showed activity patterns highly similar to their mouse counterparts (Figure 4, F and G), which indicates that their function is evolutionarily conserved. Furthermore, we tested whether transcription factors bind to the human fragments. ChIP-qPCR on human ventricular samples revealed that NKX2-5 indeed occupied these orthologous fragments in vivo (Figure 5C), thereby conserving their function (Figure 5B).
Figure 5. In vitro analysis of the homologous human genomic region F1–F2 and SNP associated with conduction.

(A) Relative position of SNP rs6801957, located under overlapping peaks for ChIP-seq datasets TBX3, GATA4, NKX2-5, and p300. (B) Sequence conservation between species around rs6801957, located in a T-box binding motif. Gaps are denoted by asterisks. (C) ChIP-qPCR assay with NKX2-5 on human (h-) ventricular tissue for F1, F2, and F9 showed enrichment for all 3 fragments. (D) TBX3 binding motif found through TBX3 ChIP-seq.
A genetic variant within the enhancer in SCN10A functionally affects a binding element for TBX3/TBX5.
Recent GWAS studies have identified genetic loci influencing conduction system function, but the underlying mechanisms are not known (30–33, 54). The reported GWAS SNP rs6801957 is positioned in the conserved enhancer F1 in SCN10A (Figure 5B) and may affect SCN5A/SCN10A expression. This SNP is positioned directly under a TBX3 ChIP-seq peak and is linked to a G-to-A substitution in the highly conserved portion of the T-box binding consensus sequence (Figure 5D). Enhancer fragments cloned from carriers of the major allele (i.e., G) could be stimulated by TBX5 and repressed by TBX3 in the presence of NKX2-5 and GATA4 (Figure 6A). In contrast, the fragment cloned from a minor allele (i.e., A) carrier did not respond to these T-box factors. Specific mutations generated in the fragments revealed that this SNP, but not other SNPs in this fragment that are in linkage disequilibrium (LD), was involved in the T-box factor response (Figure 6A). Therefore, rs6801957 appeared to functionally affect gene expression of SCN10A/SCN5A. Furthermore, analysis of all other SNPs (n = 25) in LD (r2 > 0.6) revealed that rs6801957 was uniquely associated with peaks in our ChIP-seq datasets (Supplemental Table 11). Gel mobility shift assays using DNA probes mimicking both major and minor human alleles demonstrated a significant reduction of T-box association with the minor allele compared with the major allele (Figure 6B and Supplemental Figure 9).
Figure 6. In vitro and in vivo analysis of genomic region F1–F2 and SNPs associated with conduction.

(A) Luciferase assays performed in Cos7 showed that rs6801957 was involved in T-box factor response. Representative human major (G) alleles Maj1 and Maj2 responded to stimulation by TBX5 and repression by TBX3, whereas this effect on the minor (A) allele Min1 was significantly less. Mutating rs6801957 in these alleles showed a similar effect. *P < 0.01. Error bars represent SD. See Supplemental Table 10 for information on variants per allele. (B) EMSA showing relative oligonucleotide binding of MBP-TBX3 (+) compared with MBP only (–). MBP-TBX3 fusion associated well with both Nppa probe and human Maj1, but less with Min1 and Mut (containing a 3-bp mutation in the proposed T-box binding element). See Supplemental Figure 9 for quantification and statistical analysis. (C) Representative image of the zebrafish heart (dotted outline) containing ZED-Maj1, showing expression in the ventricle (V). A, atrium. Scale bar: 100 μm. (D) Percent GFP expression in hearts of zebrafish containing the major or minor allele for rs6801957. ZED represents the vector without genomic region F1–F2. Representative human major alleles Maj1 and Maj3 showed GFP expression in 60%–70% of the hearts of zebrafish containing these constructs. When major alleles were mutated into minor alleles (Maj1Mut and Maj3Mut), a significant reduction in GFP expression was found. The presence of rs6795970 in Maj3, also linked to conduction disease, had no significant effect on GFP expression in the heart.
Next, we tested the activity of the 2.2-kb human F1–F2 enhancer fragment in zebrafish using the ZED vector, which allows simultaneous screening for transgenesis and enhancer-driven reporter activity in the heart (59); this analysis revealed that 70% of red fluorescent protein–expressing transgenic fish displayed enhancer-driven green fluorescence in the heart (Figure 6C). When the minor allele for rs6801957 was introduced in the enhancer fragment, this fraction dropped to about 40% (Figure 6D). When the minor allele for the SNP rs6795970 — which presumably affects SCN10A splicing and conduction (31) — was introduced, the fraction of fish displaying enhancer-driven green fluorescence in the heart did not change. However, when rs6801957 was additionally introduced, the fraction again dropped to about 40% (Figure 6D). Taken together, these in vivo data confirmed that rs6801957 affects enhancer function, which indicates that each allele carrying this SNP may express reduced levels of SCN10A, SCN5A, or both.
Discussion
Regulation of the cardiac electrical pattern by a network of transcriptional regulators and noncoding regulatory sequences of ion channel genes.
GWAS identified common variants that modulated cardiac impulse conduction and repolarization. Several of these variants were positioned within noncoding DNA in the vicinity of genes encoding key cardiac transcription factors (e.g., TBX5 and TBX3) and ion channels (e.g., SCN5A and SCN10A), which suggested the presence of a regulatory network for the electrophysiological properties of the heart (29–33). Tissue-specific genes are regulated by enhancers, usually found in noncoding DNA, each driving a subset of its gene’s entire expression profile. These enhancers thus represent ideal candidates for involvement in complex diseases, such as arrhythmias, as variants in an individual enhancer result in cell type–specific changes in gene expression (60, 61). The genome-wide occupancy of several factors, including TBX5, NKX2-5, and GATA4, has previously been assessed in vitro in HL-1 cells (35), the factors being first biotinylated to enable their efficient immunoprecipitation. Furthermore, the occupancy of GFP-fused TBX20 was also recently assessed in the heart (48). Here, we derived a ChIP-seq protocol that allowed us to identify — to our knowledge for the first time — the occupancy of the native forms of cardiac transcription factors in the heart in vivo. Our data, together with the existing data, represent an invaluable resource providing a map for the location of tissue-specific enhancers in the adult heart that regulate genes involved in the local electrophysiological properties of the heart.
Analysis of the genes interacting with and differentially regulated by TBX3 indicated that TBX3 functions mainly as a transcriptional repressor in vivo, consistent with previous observations using reporter assays (18, 62, 63). The gene set occupied by TBX3, repressed by TBX3, and reduced in the TBX3-positive AVC was highly enriched in genes encoding ion channels or involved in ion transport functions. This finding suggests that an important function of TBX3 in the conduction system is the direct regulation of electrophysiological properties. Both Scn10a and Scn5a were among the channel genes suppressed by TBX3 (and stimulated by TBX5), revealing functional parts of the regulatory network indicated by the GWAS studies.
Identification of specific T-box factor target sites.
TBX3-positive cardiomyocytes of the adult conduction system were limited in number and not sufficient for the ChIP-seq assay. To overcome this problem, we used a model in which Tbx3 was ectopically activated in all cardiomyocytes, assuming that this allows identification of binding sites occupied by TBX3 in the conduction system cardiomyocytes. Although the levels of Tbx3 expression in this model are moderate, and tolerated by the atria for a prolonged period (18), it is possible that TBX3 associates with sites normally occupied by other cardiac T-box proteins. Of the T-box proteins expressed in the adult myocardium (i.e., TBX5 and TBX20), TBX5 most closely resembles TBX3 (46, 47), and its binding sites are likely to be detected by ectopically expressed TBX3. Indeed, the consensus DNA binding site we identified for TBX3 binding resembles that identified for TBX5 (35), both of which diverge from previously defined T-box binding motifs (44, 45). The recently described TBX20 motif derived from ChIP-seq data (48) differs from the TBX3/TBX5 motif and known consensus sites by 1 position with no nucleotide preference in the middle of the sequence. To rule out possible differences in the computational prediction approach, we confirmed the TBX20 motif as published using MEME software. Thus, the observed difference in binding consensus may genuinely reflect a substantial in vivo functional difference in TBX20-specific gene target recognition. Assuming that the TBX20-GFP fusion protein used in this study mimics native TBX20, this finding may reflect the closer phylogenetic relationship of TBX3 and TBX5, which belong to the TBX2 subfamily, than to TBX20, which belongs to the TBX1 subfamily (41, 64). Preferential binding of the different cardiac T-box factor subfamilies, each playing important roles in the heart, may greatly influence their target specificity, affecting the mechanism underlying their function in heart development and gene regulation. In this respect, it will also be of great interest to fully unravel how T-box proteins interact with their target genes in the context of varying protein complexes to regulate gene expression.
Identification of functional enhancers for the cardiac sodium channels.
SCN5A, encoding the cardiac sodium channel, is essential for heart function (26, 65). Modest reduction in SCN5A expression levels slows cardiac conduction and predisposes to arrhythmias under certain conditions (i.e., monogenic disease and drug therapy) (57, 66). GWAS have implicated SCN10A in cardiac conduction. Its function in the heart remains unclear. Nav1.8 (encoded by Scn10a) may function in the myocardium to either decrease (31) or increase (33) conduction. Alternatively, Nav1.8 may function in the vagal innervation of the heart (67). We here identified key enhancers in Scn5a and Scn10a in mice and humans, providing more detailed insight into the link between the transcription factor network and the regulation of these important sodium channel genes in the heart. We hypothesized that these sequences represent key enhancers, both of which contribute to TBX5/TBX3-regulated expression patterns of Scn5a/Scn10a. More extensive analysis, such as chromatin conformation capture (68) and genetic modification of mice, will be required to investigate the precise contributions of each of the enhancers to the regulation of the 2 sodium channel genes.
Recent ChIP-seq of p300 occupation in mouse and human hearts indicated that cardiac enhancers are not well conserved throughout evolution (34, 69). The sequences we identified by ChIP-seq in mice may not be functionally conserved in humans. Therefore, we performed ChIP for NKX2-5 on human ventricular samples and found that the orthologous human DNA fragments were occupied by this factor. Furthermore, these elements were able to drive expression in patterns strikingly similar to their mouse counterparts. Together, these data revealed that the enhancers were functionally conserved in humans.
We provide the first functional evidence to our knowledge for the direct involvement of a human SNP in cardiac conduction system gene regulation. This SNP was found to be associated with increased PR/QRS duration, which suggests that the SNP — or a variant in LD with the SNP — decreases SCN5A/SCN10A expression. Our functional analysis indicated that the SNP itself converts a highly conserved nucleotide within the consensus T-box binding site and selectively affects TBX5/TBX3-mediated activity of the enhancer fragment, thereby reducing the cardiac activity of the enhancer. We hypothesize that the SNP affects the TBX5-activated/TBX3-repressed expression of SCN5A/SCN10A in vivo. It is well possible that the enhancer regulates both SCN5A and SCN10A. Given that SCN5A provides a much larger contribution to sodium current and conductivity of the heart than does SCN10A, it seems probable that altered SCN5A expression underlies the observed influence of the SNP on conduction system function. Other genetic variants in noncoding DNA identified by GWAS in this and the other loci (30–33, 54) may influence conduction system function in a similar way. Nevertheless, the effect of the variant on conduction times was very small (33). Furthermore, the GWAS identified heterozygous variants associated with conduction system function, whereas in our functional studies, we studied the effect of the isolated variants, equivalent to homozygosity for the variant. In this respect, it is likely that multiple genetic variants together can cause a cumulative biologically significant modulation of sodium channel gene expression.
In summary, the present study identified a set of enhancers and key binding factors important for cardiac conduction system development and function, and further identified disrupted transcription factor binding as a mechanism likely underlying the effect of a genetic variant at the SCN10A/SCN5A locus on cardiac conduction. Uncovering the molecular network and the noncoding regions regulating conduction system function will help to understand how they affect conduction system function, and may offer tools to predict disease susceptibility and progression among individuals (70).
Methods
ChIP sequencing from adult mouse heart.
CAG-CAT-TBX3–heterozygous (CTBX3+/–) mice (18) were crossed with Myh6MCM mice (39). Tamoxifen (catalog no. T5648; Sigma-Aldrich) was injected intraperitoneally (100 mg per mouse per day) at 4-day intervals in adult males. Hearts were removed on day 5, prior to the onset of heart dysfunction (40). Quantitative RT-PCR was performed to determine the efficiency of recombination. For NKX2-5, GATA4, and p300 ChIPs, hearts were isolated from adult FVB males. Tissues were cross-linked in 1% (p300) or 2% (TBX3, GATA4, and NKX2-5) formaldehyde for 30 minutes at room temperature. Cross-linking was quenched by addition of 0.125M glycine. Tissues were dissociated by IKA Ultra Turrax T5 FU, pelleted, and resuspended in cold lysis buffer (50 mM Tris-HCl, pH 8.1; 10 mM EDTA, pH 8.0; 1% SDS; and 1× Protease Inhibitor Cocktail [Roche]). Nuclei were obtained by use of a tight glass dounce homogenizer. Cross-linked nuclei were sonicated under conditions established to yield an average fragment size of approximately 300 bp. Antibodies TBX3 (A-20, sc-17871, lot no. J0306), TBX5 (C-20, sc-17866, lot no. D1708), NKX2-5 (N-19, sc-8697, lot nos. A1109 and J2010), GATA4 (C-20, sc-1237, lot no. F3010), and p300 (N-15, sc-583, lot no. K3009) were purchased from Santa Cruz. Immunoprecipitation, washing, elution, and reverse cross-linking were performed as previously described (71). Quality of the ChIP was assessed with primers on locations of known cardiac enhancers. Quality was also previously qualitatively assessed by noting peaks at published T-box responsive enhancers (52). Material was used for library preparation with standard NEBNext library kit protocol for Illumina sequencing (lot nos. E6000S/L and E6040S/L; New England BioLabs). ChIP-seq data were deposited in NCBI’s Gene Expression Omnibus (72) under accession no. GSE35151 ( http://www.ncbi.nlm.nih.gov/geo/query/acc.cgi?acc=GSE35151).
ChIP-qPCR was performed on a Roche LightCycler 480 System using Sybr Green detection. Fold enrichment indicates the ratio of ChIPed DNA to a negative control region in the Hprt locus, normalized for input DNA. Tested locations were randomly chosen using the Galaxy software interface. Primer sequences are provided in Supplemental Table 6.
ChIP-qPCR on human ventricular samples.
The human ventricular sample used for ChIP was from a nondiseased human heart that was technically unusable for transplantation based on logistic considerations and was provided by A. Varró (University of Szeged, Szeged, Hungary). Before cardiac explantation, the organ donor did not receive medication except dobutamine, furosemide, and plasma expanders.
Processing of ChIP sequencing data.
Sequencing results were run through the standard Illumina GAPipeline (version 1.3 for GAII runs) to convert images to reads of 36 bp in length (unaligned sequences produced by the Illumina Genome Analyzer) and edit for quality (FIRECREST, Bustard, and GERALD). Reads were then processed and aligned to the mouse reference genome (Mm9; NCBI Build 37) as previously described, allowing a maximum of 2 mismatches and retaining only sequences with unique alignments (73).
Peaks were extracted and defined from the wiggle files containing the coverage per bp using an in-house algorithm that returns peak start and stop coordinates in a BED file format. BED files for TBX3, GATA4, and NKX2-5 are shown in Supplemental Table 12. Locations of known cardiac enhancers were checked for transcription factor binding as a quality control for these datasets. See Supplemental Methods for the exact settings for peak calling.
Gene sets were extracted from UCSC refGene for the mouse using the Galaxy software interface. We allocated promoter regions for the 27,585 mouse genes currently listed under RefGene; a promoter was defined as the 1-kb upstream region of an annotated transcriptional start site. Overlaps between gene regions and peak regions were identified using Galaxy. For determining the intersection between gene arrays and TBX3 ChIP-seq peak regions, significantly up- or downregulated genes from the various microarray datasets were assigned coordinates using the Biomart Central Portal. All chromosomal coordinates were subsequently extended both up- and downstream by 1 kb. Coordinates were then intersected using the Galaxy software interface. 2 control gene sets were generated, both for the induced TBX3 array analysis and the AVC/working myocardium array analysis, using 6 sets of equivalent numbers of unique genes, randomly extracted from the nonsignificant genes of the latter study and further treated in exactly the same way as the test gene sets. Statistical analysis of the significance of enrichment between intersects and controls was carried out using a Z test, which uses the normal approximation of the binomial distribution to compare proportions (74, 75). Microarray data were deposited in NCBI’s Gene Expression Omnibus (72) with accession nos. GSE13614 and GSE31969.
Proteins assigned to overlaps were extracted using Galaxy and further analyzed using the DAVID bioinformatics resource gene ontology (GO) analysis software (49, 50). Unique gene names were called using chromosome locations via the BioMart Central Portal. Motif analysis was performed with MEME (42) using 600 random peaks, with an average length of approximately 165 bp, per total dataset. For scanning ChIP-seq peaks with known transcription factor motifs, position weight matrices were obtained from JASPAR (43, 44) and TRANSFAC (version 11.3; ref. 45) databases.
Transgenic mouse enhancer assay.
Enhancer candidate regions of 2–3 kb in the Scn5a/Scn10a locus were cloned into the Hsp68-LacZ reporter vector as previously described (76). Genomic coordinates of the amplified regions are provided in Supplemental Table 9. DNA was injected into the pronucleus of 0.5-day-old fertilized FVB/N eggs, which were subsequently transferred into the oviducts of CD-1 pseudopregnant foster females (Cyagen Inc.). At least 200 injections were performed per construct. Embryos were harvested and stained with X-gal to detect LacZ activity, and yolk sacs were processed for PCR genotyping.
In vivo zebrafish enhancer assay.
Enhancer sequences Maj1, Maj1Mut, Maj3, and Maj3Mut were amplified by PhusionTAQ PCR (New England Biolabs) and cloned into the ZED vector (59) by Gateway technology (Life Technologies BV). ZED-Maj1, ZED-Maj1Mut, ZED-Maj3, and ZED-Maj3Mut were injected in WT zebrafish embryos at the 1-cell stage at a final concentration of 15 ng/μl in the presence of 25 ng/μl TOL2 transposase RNA. Embryos were kept at 28.5°C in E3 medium and scored for heart-specific red fluorescent protein, and subsequently heart-specific GFP, fluorescence at 48 hours post fertilization (hpf) on a Leica MZFLIII fluorescence stereomicrocope (Leica Microsystems GmbH) set up with appropriate fluorescence filters.
In vivo imaging of the embryos at 48 hpf was carried out on a Zeiss Axioskop 2 Mot plus fluorescence microscope (Carl Zeiss MicroImaging GmbH) mounted with a Leica DFC490 CCD camera (Leica Microsystems) using appropriate fluorescence filters.
Other methods.
Procedures for quantitative expression analysis, luciferase assays, in situ hybridization, and EMSA were performed as described previously (18). See Supplemental Methods and Supplemental Tables 5, 7, and 8 for details.
Statistics.
Unless otherwise indicated, a P value less than 0.05 was considered significant. See Supplemental Methods for details.
Study approval.
This investigation conformed to NIH guidelines (Guide for the Care and Use of Laboratory Animals. NIH publication no. 85-23. Revised 1996). All animal work was approved by the Animal Experimental Committee of the Academic Medical Center, University of Amsterdam, and carried out in compliance with Dutch government guidelines. Investigations using the human ventricular sample conformed to the principles outlined in the Helsinki Declaration of the World Medical Association. Use of human cardiac material was approved by the Ethical Review Board of the Medical Center of the University of Szeged.
Supplementary Material
Acknowledgments
The authors thank Jan Ruijter, Bouke de Boer, Corrie de Gier-de Vries, Carol Verhoek-Pocock, Ted Bradley, Frank Baas, Marcel Willemsen, Antoine van Kampen, Kim Beijer, and Henk Buermans for their contributions. We thank András Varró for providing the human cardiac tissue. This work was supported by grants from the Netherlands Heart Foundation (NHS grant 2010B205, to V.M. Christoffels) and by the European Community’s Seventh Framework Programme contract (“CardioGeNet” 223463, to M. van den Boogaard and V.M. Christoffels). C.R. Bezzina is supported by the Netherlands Heart Foundation (NHS 2005T024). P.A.C. ‘t Hoen is supported by the Center for Medical Systems Biology, in the framework of the Netherlands Genomics Initiative/Netherlands Organization for Scientific Research.
Footnotes
Conflict of interest: The authors have declared that no conflict of interest exists.
Citation for this article: J Clin Invest. 2012;122(7):2519–2530. doi:10.1172/JCI62613.
References
- 1.Shah AJ, Liu X, Jadidi AS, Haissaguerre M. Early management of atrial fibrillation: from imaging to drugs to ablation. Nat Rev Cardiol. 2010;7(6):345–354. doi: 10.1038/nrcardio.2010.49. [DOI] [PubMed] [Google Scholar]
- 2.Huikuri HV, Castellanos A, Myerburg RJ. Sudden death due to cardiac arrhythmias. N Engl J Med. 2001;345(20):1473–1482. doi: 10.1056/NEJMra000650. [DOI] [PubMed] [Google Scholar]
- 3.Bezzina CR, et al. Genome-wide association study identifies a susceptibility locus at 21q21 for ventricular fibrillation in acute myocardial infarction. Nat Genet. 2010;42(8):688–691. doi: 10.1038/ng.623. [DOI] [PMC free article] [PubMed] [Google Scholar]
- 4.Schram G, Pourrier M, Melnyk P, Nattel S. Differential distribution of cardiac ion channel expression as a basis for regional specialization in electrical function. Circ Res. 2002;90(9):939–950. doi: 10.1161/01.RES.0000018627.89528.6F. [DOI] [PubMed] [Google Scholar]
- 5.Marionneau C, et al. Specific pattern of ionic channel gene expression associated with pacemaker activity in the mouse heart. J Physiol. 2005;562(pt 1):223–234. doi: 10.1113/jphysiol.2004.074047. [DOI] [PMC free article] [PubMed] [Google Scholar]
- 6.Mangoni ME, Nargeot J. Genesis and regulation of the heart automaticity. Physiol Rev. 2008;88(3):919–982. doi: 10.1152/physrev.00018.2007. [DOI] [PubMed] [Google Scholar]
- 7.Postma AV, Christoffels VM, Bezzina CR. Developmental aspects of cardiac arrhythmogenesis. Cardiovasc Res. 2011;91(2):243–251. doi: 10.1093/cvr/cvr134. [DOI] [PubMed] [Google Scholar]
- 8.Boukens BJ, Christoffels VM, Coronel R, Moorman AF. Developmental basis for electrophysiological heterogeneity in the ventricular and outflow tract myocardium as a substrate for life-threatening ventricular arrhythmias. Circ Res. 2009;104(1):19–31. doi: 10.1161/CIRCRESAHA.108.188698. [DOI] [PubMed] [Google Scholar]
- 9.Olson EN. Gene regulatory networks in the evolution and development of the heart. Science. 2006;313(5795):1922–1927. doi: 10.1126/science.1132292. [DOI] [PMC free article] [PubMed] [Google Scholar]
- 10.Bruneau BG. Chromatin remodeling in heart development. Curr Opin Genet Dev. 2010;20(5):505–511. doi: 10.1016/j.gde.2010.06.008. [DOI] [PubMed] [Google Scholar]
- 11.Hatcher CJ, Basson CT. Specification of the cardiac conduction system by transcription factors. Circ Res. 2009;105(7):620–630. doi: 10.1161/CIRCRESAHA.109.204123. [DOI] [PMC free article] [PubMed] [Google Scholar]
- 12.Schott JJ, et al. Congenital heart disease caused by mutations in the transcription factor NKX2-5. Science. 1998;281(5373):108–111. doi: 10.1126/science.281.5373.108. [DOI] [PubMed] [Google Scholar]
- 13.Basson CT, et al. Mutations in human TBX5 (corrected) cause limb and cardiac malformation in Holt-Oram syndrome. Nat Genet. 1997;15(1):30–35. doi: 10.1038/ng0197-30. [DOI] [PubMed] [Google Scholar]
- 14.Li QY, et al. Holt-Oram syndrome is caused by mutations in TBX5, a member of the Brachyury (T) gene family. Nat Genet. 1997;15(1):21–29. doi: 10.1038/ng0197-21. [DOI] [PubMed] [Google Scholar]
- 15.Bruneau BG. The developmental genetics of congenital heart disease. Nature. 2008;451(7181):943–948. doi: 10.1038/nature06801. [DOI] [PubMed] [Google Scholar]
- 16.Christoffels VM, Smits GJ, Kispert A, Moorman AF. Development of the pacemaker tissues of the heart. Circ Res. 2010;106(2):240–254. doi: 10.1161/CIRCRESAHA.109.205419. [DOI] [PubMed] [Google Scholar]
- 17.Basson CT, et al. Different TBX5 interactions in heart and limb defined by Holt-Oram syndrome mutations. . Proc Natl Acad Sci U S A. 1999;96(6):2919–2924. doi: 10.1073/pnas.96.6.2919. [DOI] [PMC free article] [PubMed] [Google Scholar]
- 18.Hoogaars WM, et al. Tbx3 controls the sinoatrial node gene program and imposes pacemaker function on the atria. Genes Dev. 2007;21(9):1098–1112. doi: 10.1101/gad.416007. [DOI] [PMC free article] [PubMed] [Google Scholar]
- 19.Mommersteeg MTM, et al. Molecular pathway for the localized formation of the sinoatrial node. Circ Res. 2007;100(3):354–362. doi: 10.1161/01.RES.0000258019.74591.b3. [DOI] [PubMed] [Google Scholar]
- 20.Sizarov A, et al. Molecular analysis of the patterning of the conduction tissues in the developing human heart. Circ Arrhythm Electrophysiol. 2011;4(4):532–542. doi: 10.1161/CIRCEP.111.963421. [DOI] [PubMed] [Google Scholar]
- 21.Wiese C, et al. Formation of the sinus node head and differentiation of sinus node myocardium are independently regulated by tbx18 and tbx3. Circ Res. 2009;104(3):388–397. doi: 10.1161/CIRCRESAHA.108.187062. [DOI] [PubMed] [Google Scholar]
- 22.Horsthuis T, et al. Gene expression profiling of the forming atrioventricular node using a novel Tbx3-based node-specific transgenic reporter. Circ Res. 2009;105(1):61–69. doi: 10.1161/CIRCRESAHA.108.192443. [DOI] [PubMed] [Google Scholar]
- 23.Bakker ML, et al. Transcription factor Tbx3 is required for the specification of the atrioventricular conduction system. Circ Res. 2008;102(11):1340–1349. doi: 10.1161/CIRCRESAHA.107.169565. [DOI] [PubMed] [Google Scholar]
- 24.Bruneau BG, et al. A murine model of Holt-Oram syndrome defines roles of the T-box transcription factor Tbx5 in cardiogenesis and disease. Cell. 2001;106(6):709–721. doi: 10.1016/S0092-8674(01)00493-7. [DOI] [PubMed] [Google Scholar]
- 25.Moskowitz IP, et al. A molecular pathway including id2, tbx5, and nkx2-5 required for cardiac conduction system development. Cell. 2007;129(7):1365–1376. doi: 10.1016/j.cell.2007.04.036. [DOI] [PubMed] [Google Scholar]
- 26.George AL., Jr Inherited disorders of voltage-gated sodium channels. J Clin Invest. 2008;115(8):1990–1999. doi: 10.1172/JCI25505. [DOI] [PMC free article] [PubMed] [Google Scholar]
- 27.Papadatos GA, et al. Slowed conduction and ventricular tachycardia after targeted disruption of the cardiac sodium channel gene Scn5a. Proc Natl Acad Sci U S A. 2002;99(9):6210–6215. doi: 10.1073/pnas.082121299. [DOI] [PMC free article] [PubMed] [Google Scholar]
- 28.Wilde AA, Brugada R. Phenotypical manifestations of mutations in the genes encoding subunits of the cardiac sodium channel. Circ Res. 2011;108(7):884–897. doi: 10.1161/CIRCRESAHA.110.238469. [DOI] [PubMed] [Google Scholar]
- 29.Gudbjartsson DF, et al. Variants conferring risk of atrial fibrillation on chromosome 4q25. Nature. 2007;448(7151):353–357. doi: 10.1038/nature06007. [DOI] [PubMed] [Google Scholar]
- 30.Pfeufer A, et al. Genome-wide association study of PR interval. Nat Genet. 2010;42(2):153–159. doi: 10.1038/ng.517. [DOI] [PMC free article] [PubMed] [Google Scholar]
- 31.Chambers JC, et al. Genetic variation in SCN10A influences cardiac conduction. Nat Genet. 2010;42(2):149–152. doi: 10.1038/ng.516. [DOI] [PubMed] [Google Scholar]
- 32.Holm H, et al. Several common variants modulate heart rate, PR interval and QRS duration. Nat Genet. 2010;42(2):177–122. doi: 10.1038/ng.511. [DOI] [PubMed] [Google Scholar]
- 33.Sotoodehnia N, et al. Common variants in 22 loci are associated with QRS duration and cardiac ventricular conduction. Nat Genet. 2010;42(12):1068–1076. doi: 10.1038/ng.716. [DOI] [PMC free article] [PubMed] [Google Scholar]
- 34.Blow MJ, et al. ChIP-Seq identification of weakly conserved heart enhancers. Nat Genet. 2010;42(9):806–810. doi: 10.1038/ng.650. [DOI] [PMC free article] [PubMed] [Google Scholar]
- 35.He A, Kong SW, Ma Q, Pu WT. Co-occupancy by multiple cardiac transcription factors identifies transcriptional enhancers active in heart. Proc Natl Acad Sci U S A. 2011;108(14):5632–5637. doi: 10.1073/pnas.1016959108. [DOI] [PMC free article] [PubMed] [Google Scholar]
- 36.Visel A, et al. ChIP-seq accurately predicts tissue-specific activity of enhancers. Nature. 2009;457(7231):854–858. doi: 10.1038/nature07730. [DOI] [PMC free article] [PubMed] [Google Scholar]
- 37. Rosenbloom KR, et al. ENCODE whole-genome data in the UCSC Genome Browser: update 2012. Nucleic Acids Res. 2012. 40 database issue D912 –D917 10.1093/nar/gkr1012 [DOI] [PMC free article] [PubMed] [Google Scholar]
- 38.Park PJ. ChIP-seq: advantages and challenges of a maturing technology. Nat Rev Genet. 2009;10(10):669–680. doi: 10.1038/nrg2641. [DOI] [PMC free article] [PubMed] [Google Scholar]
- 39.Sohal DS, et al. Temporally regulated and tissue-specific gene manipulations in the adult and embryonic heart using a tamoxifen-inducible Cre protein. Circ Res. 2001;89(1):20–25. doi: 10.1161/hh1301.092687. [DOI] [PubMed] [Google Scholar]
- 40.Bakker ML, et al. Cardiovasc Res. T-box transcription factor TBX3 reprograms mature cardiac myocytes into pacemaker–like cells [published online ahead of print March 14, 2012]. doi: 10.1093/cvr/cvs120 . [DOI] [PubMed] [Google Scholar]
- 41.Naiche LA, Harrelson Z, Kelly RG, Papaioannou VE. T-Box genes in vertebrate development. Annu Rev Genet. 2005;39:219–239. doi: 10.1146/annurev.genet.39.073003.105925. [DOI] [PubMed] [Google Scholar]
- 42.Machanick P, Bailey TL. MEME-ChIP: motif analysis of large DNA datasets. Bioinformatics. 2011;27(12):1696–1697. doi: 10.1093/bioinformatics/btr189. [DOI] [PMC free article] [PubMed] [Google Scholar]
- 43.Stormo GD. DNA binding sites: representation and discovery. Bioinformatics. 2000;16(1):16–23. doi: 10.1093/bioinformatics/16.1.16. [DOI] [PubMed] [Google Scholar]
- 44.Wasserman WW, Sandelin A. Applied bioinformatics for the identification of regulatory elements. Nat Rev Genet. 2004;5(4):276–287. doi: 10.1038/nrg1315. [DOI] [PubMed] [Google Scholar]
- 45.Matys V, et al. TRANSFAC: transcriptional regulation, from patterns to profiles. Nucleic Acids Res. 2003;31(1):374–378. doi: 10.1093/nar/gkg108. [DOI] [PMC free article] [PubMed] [Google Scholar]
- 46.Boogerd CJ, Moorman AF, Barnett P. Protein interactions at the heart of cardiac chamber formation. Ann Anat. 2009;191(6):505–517. doi: 10.1016/j.aanat.2009.06.004. [DOI] [PubMed] [Google Scholar]
- 47.Plageman TF, Jr, Yutzey KE. T-box genes and heart development: putting the “T” in heart. Dev Dyn. 2005;232(1):11–20. doi: 10.1002/dvdy.20201. [DOI] [PubMed] [Google Scholar]
- 48.Shen T, et al. Tbx20 regulates a genetic program essential to adult mouse cardiomyocyte function. J Clin Invest. 2011;121(12):4640–4654. doi: 10.1172/JCI59472. [DOI] [PMC free article] [PubMed] [Google Scholar]
- 49.Huang dW, Sherman BT, Lempicki RA. Bioinformatics enrichment tools: paths toward the comprehensive functional analysis of large gene lists. Nucleic Acids Res. 2009;37(1):1–13. doi: 10.1093/nar/gkn923. [DOI] [PMC free article] [PubMed] [Google Scholar]
- 50.Huang dW, Sherman BT, Lempicki RA. Systematic and integrative analysis of large gene lists using DAVID bioinformatics resources. Nat Protoc. 2009;4(1):44–57. doi: 10.1038/nprot.2008.211. [DOI] [PubMed] [Google Scholar]
- 51.Hoogaars WMH, et al. The transcriptional repressor Tbx3 delineates the developing central conduction system of the heart. Cardiovasc Res. 2004;62(3):489–499. doi: 10.1016/j.cardiores.2004.01.030. [DOI] [PubMed] [Google Scholar]
- 52.Singh R, et al. Tbx2 and Tbx3 induce atrioventricular myocardial development and endocardial cushion formation. Cell Mol Life Sci. 2012;69(8):1377–1389. doi: 10.1007/s00018-011-0884-2. [DOI] [PMC free article] [PubMed] [Google Scholar]
- 53.Frank DU, et al. Lethal arrhythmias in Tbx3–deficient mice reveal extreme dosage sensitivity of cardiac conduction system function and homeostasis. Proc Natl Acad Sci U S A. 2012;109(3):E154–E163. doi: 10.1073/pnas.1115165109. [DOI] [PMC free article] [PubMed] [Google Scholar]
- 54.Smith JG, et al. Genome-wide association studies of the PR interval in African Americans. PLoS Genet. 2011;7(2):e1001304. doi: 10.1371/journal.pgen.1001304. [DOI] [PMC free article] [PubMed] [Google Scholar]
- 55.Remme CA, et al. The cardiac sodium channel displays differential distribution in the conduction system and transmural heterogeneity in the murine ventricular myocardium. Basic Res Cardiol. 2009;104(5):511–522. doi: 10.1007/s00395-009-0012-8. [DOI] [PMC free article] [PubMed] [Google Scholar]
- 56.Dominguez JN, de la Rosa A, Navarro F, Franco D, Aranega AE. Tissue distribution and subcellular localization of the cardiac sodium channel during mouse heart development. Cardiovasc Res. 2008;78(1):45–52. doi: 10.1093/cvr/cvm118. [DOI] [PubMed] [Google Scholar]
- 57.Atack TC, et al. Informatic and functional approaches to identifying a regulatory region for the cardiac sodium channel. Circ Res. 2011;109(1):38–46. doi: 10.1161/CIRCRESAHA.110.235630. [DOI] [PMC free article] [PubMed] [Google Scholar]
- 58.Schmidt D, et al. Five-vertebrate ChIP-seq reveals the evolutionary dynamics of transcription factor binding. Science. 2010;328(5981):1036–1040. doi: 10.1126/science.1186176. [DOI] [PMC free article] [PubMed] [Google Scholar]
- 59.Bessa J, et al. Zebrafish enhancer detection (ZED) vector: a new tool to facilitate transgenesis and the functional analysis of cis-regulatory regions in zebrafish. Dev Dyn. 2009;238(9):2409–2417. doi: 10.1002/dvdy.22051. [DOI] [PubMed] [Google Scholar]
- 60.Wasserman NF, Aneas I, Nobrega MA. An 8q24 gene desert variant associated with prostate cancer risk confers differential in vivo activity to a MYC enhancer. Genome Res. 2010;20(9):1191–1197. doi: 10.1101/gr.105361.110. [DOI] [PMC free article] [PubMed] [Google Scholar]
- 61.Hardy J, Singleton A. Genomewide association studies and human disease. N Engl J Med. 2009;;360(17):1759–1768. doi: 10.1056/NEJMra0808700. [DOI] [PMC free article] [PubMed] [Google Scholar]
- 62.Brummelkamp TR, et al. TBX-3, the gene mutated in Ulnar-Mammary syndrome, is a negative regulator of p19ARF and inhibits senescence. J Biol Chem. 2002;277(8):6567–6572. doi: 10.1074/jbc.M110492200. [DOI] [PubMed] [Google Scholar]
- 63.Carlson H, Ota S, Campbell CE, Hurlin PJ. A dominant repression domain in Tbx3 mediates transcriptional repression and cell immortalization: relevance to mutations in Tbx3 that cause ulnar-mammary syndrome. Hum Mol Genet. 2001;10(21):2403–2413. doi: 10.1093/hmg/10.21.2403. [DOI] [PubMed] [Google Scholar]
- 64.Ruvinsky I, Silver LM, Gibson-Brown JJ. Phylogenetic analysis of T-Box genes demonstrates the importance of amphioxus for understanding evolution of the vertebrate genome. Genetics. 2000;156(3):1249–1257. doi: 10.1093/genetics/156.3.1249. [DOI] [PMC free article] [PubMed] [Google Scholar]
- 65.Ruan Y, Liu N, Priori SG. Sodium channel mutations and arrhythmias. Nat Rev Cardiol. 2009;6(5):337–348. doi: 10.1038/nrcardio.2009.44. [DOI] [PubMed] [Google Scholar]
- 66.Antzelevitch C, et al. Brugada syndrome: Report of the second consensus conference: endorsed by the Heart Rhythm Society and the European Heart Rhythm Association. Heart Rhythm. 2005;2(4):429–440. doi: 10.1016/j.hrthm.2005.01.005. [DOI] [PubMed] [Google Scholar]
- 67.Blasius AL, et al. Hypermorphic mutation of the voltage-gated sodium channel encoding gene Scn10a causes a dramatic stimulus-dependent neurobehavioral phenotype. Proc Natl Acad Sci U S A. 2011;108(48):19413–19418. doi: 10.1073/pnas.1117020108. [DOI] [PMC free article] [PubMed] [Google Scholar]
- 68.Simonis M, Kooren J, de Laat W. An evaluation of 3C-based methods to capture DNA interactions. Nat Methods. 2007;4(11):895–901. doi: 10.1038/nmeth1114. [DOI] [PubMed] [Google Scholar]
- 69.May D, et al. Large–scale discovery of enhancers from human heart tissue. Nat Genet. 2011;44(1):89–93. doi: 10.1038/ng.1006. [DOI] [PMC free article] [PubMed] [Google Scholar]
- 70.Visel A, Rubin EM, Pennacchio LA. Genomic views of distant-acting enhancers. Nature. 2009;461(7261):199–205. doi: 10.1038/nature08451. [DOI] [PMC free article] [PubMed] [Google Scholar]
- 71.Boogerd CJ, et al. Sox4 mediates Tbx3 transcriptional regulation of the gap junction protein Cx43. Cell Mol Life Sci. 2011;68(23):3949–3961. doi: 10.1007/s00018-011-0693-7. [DOI] [PMC free article] [PubMed] [Google Scholar]
- 72.Edgar R, Domrachev M, Lash AE. Gene Expression Omnibus: NCBI gene expression and hybridization array data repository. Nucleic Acids Res. 2002;30(1):207–210. doi: 10.1093/nar/30.1.207. [DOI] [PMC free article] [PubMed] [Google Scholar]
- 73.Ramos YF, et al. Genome-wide assessment of differential roles for p300 and CBP in transcription regulation. Nucleic Acids Res. 2010;38(16):5396–5408. doi: 10.1093/nar/gkq184. [DOI] [PMC free article] [PubMed] [Google Scholar]
- 74.Ruijter JM, van Kampen AHC, Baas F. Statistical evaluation of serial analysis of gene expression (SAGE) libraries: consequences for experimental design. Physiol Genomics. 2002;11(2):37–44. doi: 10.1152/physiolgenomics.00042.2002. [DOI] [PubMed] [Google Scholar]
- 75.Schaaf GJ, van Ruissen F, van Kampen A, Kool M, Ruijter JM. Serial Analysis Of Gene Expression (Sage). Methods And Protocols. 2008. Statistical comparison of two or more SAGE libraries: one tag at the time. In: Nielsen KL, ed. pp. 151–168. Totowa, New Jersey: Humana Press; [DOI] [PubMed] [Google Scholar]
- 76.Kothary R, et al. Inducible expression of an hsp68-lacZ hybrid gene in transgenic mice. Development. 1989;105(4):707–714. doi: 10.1242/dev.105.4.707. [DOI] [PubMed] [Google Scholar]
Associated Data
This section collects any data citations, data availability statements, or supplementary materials included in this article.