

Abstract
Epistasis refers to the phenomenon in which phenotypic consequences caused by mutation of one gene depend on one or more mutations at another gene. Epistasis is critical for understanding many genetic and evolutionary processes, including pathway organization, evolution of sexual reproduction, mutational load, ploidy, genomic complexity, speciation, and the origin of life. Nevertheless, current understandings for the genome-wide distribution of epistasis are mostly inferred from interactions among one mutant type per gene, whereas how epistatic interaction partners change dynamically for different mutant alleles of the same gene is largely unknown. Here we address this issue by combining predictions from flux balance analysis and data from a recently published high-throughput experiment. Our results show that different alleles can epistatically interact with very different gene sets. Furthermore, between two random mutant alleles of the same gene, the chance for the allele with more severe mutational consequence to develop a higher percentage of negative epistasis than the other allele is 50∼70% in eukaryotic organisms, but only 20∼30% in bacteria and archaea. We developed a population genetics model that predicts that the observed distribution for the sign of epistasis can speed up the process of purging deleterious mutations in eukaryotic organisms. Our results indicate that epistasis among genes can be dynamically rewired at the genome level, and call on future efforts to revisit theories that can integrate epistatic dynamics among genes in biological systems.
Epistasis between two deleterious mutations is positive when a double mutant causes a weaker mutational defect than predicted from individual deleterious mutations, and is negative when the double mutant causes a larger defect (1, 2). In a population with sexual reproduction, positive epistasis alleviates the total harm when multiple deleterious mutations combine together and thus reduces the effectiveness of natural selection in removing these deleterious mutations, whereas negative epistasis can lower average mutational load by efficiently purging deleterious mutants (3). As a consequence, selective elimination of deleterious mutations would be especially effective if negative epistasis is prevalent. It is important to understand the distribution of epistasis among mutations, which plays a central role in genetics and theoretical descriptions for many evolutionary processes (1, 2).
Tremendous efforts have been put into genome-wide measurements for the sign and magnitude of epistasis among different genes in various species (4–15). A series of high-throughput experimental platforms have been developed, such as synthetic genetic array (SGA) (4, 5), diploid-based synthetic lethality analysis with microarrays (6, 7), synthetic dosage-suppression and lethality screen (8–10), and epistatic miniarray profiles (11–13). The epistatic relations in these experiments were mostly measured based on one mutant type (deletion mutant) per gene. Few studies constructed multiple mutant alleles for single genes to examine the dynamics of epistatic relations among genes under different genetic perturbations. As a consequence, the global landscape of epistasis for different alleles of the same gene remains largely uninvestigated.
Here we address this issue by combining experimental data with mathematical modeling using flux balance analysis (FBA). FBA involves the optimization of cellular objective functions and allows prediction of in silico flux values and/or growth (16–18). FBA has been used to investigate the fitness consequence of single-deletion mutants (19, 20) and epistatic relations between metabolic reactions, genes, and functional modules (21–24). The FBA predictions show good agreement with genome-wide experimental studies (25–32). One essential advantage of FBA modeling is that it can simulate epistasis between genes based on different genetic mutants. Using this platform, together with data from a recently published experiment, we were able to show that epistasis can be rewired among genes, and that the sign of epistasis can change dramatically at the global scale, depending on the mutant alleles involved in the processes. Our study provides a genome-wide picture on the dynamic epistatic landscape of various mutant alleles for the same gene.
Results
Epistatic Relations Between Genes Are Largely Allele-Specific.
We first used the yeast Saccharomyces cerevisiae metabolic reconstruction iMM904 (16) to examine the distribution of epistasis under various genetic mutant alleles. The reconstruction is a genome-scale metabolic model, having 904 metabolic genes associated with 1,412 reactions. For each gene, we simulated genetic perturbations that retain the corresponding flux from 90% to 0% in decrements of 10% of its WT (optimal) flux. As a result, 10 different single mutants per nonessential gene and nine different single mutants per essential gene (the 0% flux mutants in these genes represent lethal deletion for which epistasis cannot be calculated) were simulated. We computed the fitness of the single mutants and double mutants with any possible pairwise allele combination of different genes. These data were used to infer the epistatic relationships among genes. In total, over 40 million simulations were conducted.
To investigate the dynamics of epistasis among genes, we calculated the percentage of shared epistatic interaction partners between any two mutants within the same gene. Two mutant alleles are defined to share an epistatic interaction partner (a mutant from another gene) if they both epistatically interact with this mutant and the signs of epistasis are the same. The percentage of shared epistatic interaction partners between two mutants is calculated as the number of their shared epistatic interaction partners divided by the sum of their total epistatic interaction partners. As shown in Fig. 1A, our results indicate that the percentage of shared epistatic interaction partners between two mutants of the same gene decreases as the flux difference between them increases. Two mutants of the same genes could have as low as only ∼20% overlap between their epistatic interaction partners, indicating that the epistatic profile of a gene is largely dependent on the mutant types used. Our results also show that the average number of epistatic interaction partners per gene do not affect this conclusion (Fig. S1). Interestingly, there are cases where the sign of epistasis between two genes can even change under varying mutant types (an example is in Fig. S2, and all pairs with reversed sign of epistasis are listed in Dataset S1). However, such events are rare (∼1.2% of all gene pairs that show epistatic interactions). Furthermore, we repeated the above FBA analysis for another species, Escherichia coli, and the results confirmed the above trend (Fig. S3).
Fig. 1.

Epistatic relations between genes are allele specific. (A) FBA simulation results for the distribution of the percentage of shared epistatic interaction partners between two mutant alleles within the same gene. Solid and broken lines represent mean and 95% confidence intervals, respectively. (B) The cumulative distribution for the percentage of shared epistatic interaction partners between two mutant alleles within the same gene based on real experimental data. Two broken lines represent 10% and 20% of shared epistatic profiling, respectively.
In a recently released high-throughput experiment that measured genome-wide epistatic relations among genes in S. cerevisiae (4), there were 43 mutant pairs having two different mutant alleles of the same gene (Dataset S2), each of which were experimentally crossed with 3,885 array gene deletion mutants to explore their epistatic relations in the genome. In total, over 200,000 double mutants were experimentally constructed. This dataset provides the most comprehensive experimental source for investigating the epistatic landscape of different mutant alleles in the same gene. Fig. 1B shows the empirical cumulative distribution for the percentage of shared interaction partners between mutant pairs within the same gene. Our results indicate that more than 50% of mutant pairs within the same gene have less than 10% overlap of their epistatic interaction partners, and ∼90% mutant pairs have less than 20% overlap (Fig. 1B). As shown in Dataset S2, the functions of genes used in the experiments are very diverse, and not restricted to metabolic functions as genes in the FBA model. Nevertheless, the result from experimental studies confirms our FBA modeling prediction that different mutant alleles of the same gene can have very distinct epistatic interaction partners in the genome. In addition, the conclusions are robust under various epistasis thresholds (Fig. S4).
Sign of Epistasis for Individual Genes Depends on Mutation Severity.
The relative prevalence of positive vs. negative epistasis is of tremendous importance for understanding many evolutionary processes (1–3). In the following we addressed this issue for different alleles of the same gene. Based on the above high-throughput experimental dataset, we calculated the percentage of negative epistasis for each mutant, defined as the number of negative epistatic partners for this mutant divided by the overall number of its epistatic partners. We then compared the percentage of negative epistasis between different mutant alleles of the same gene in the experiment. Among 43 mutant pairs in the study, 35 mutant pairs have significantly different fitnesses between two mutants of the same gene. As shown in Fig. 2A Left, 21 mutant pairs (60%) show that alleles with more severe defects have a higher chance than the other allele in the same gene to develop negative epistasis in the genome.
Fig. 2.

Mutant alleles in the same gene with more severe defects tend to have a higher percentage of negative epistasis in yeast. (A) The two matrices represent all mutant pairs identified in real experimental data (Left) and FBA simulation (Right) (fitness difference |f| ≥ 0.01; epistasis threshold |ε| ≥ 0.01). Each cell represents one mutant pair within the same gene. The color bar to the right represents the normalized percentage of negative epistasis for the mutant allele with more severe defects (percentage of negative epistasis for the mutant allele with more severe defects/the sum of percentage of negative epistasis for two mutant alleles). Red and yellow colors represent that mutant allele with more severe defects in the same gene has higher and lower percentage of negative epistasis than the other allele, respectively. (B) Distribution for the number of mutant pairs among randomly selected 35 pairs where mutants with more severe defects have higher percentage of negative epistasis. The arrow represents the observed number for the mutant allele pairs within the same genes. (C) The percentage of mutant pairs in which the mutant allele with more severe defects in the same gene has a higher percentage of negative epistasis under various fitness difference and epistasis thresholds during FBA simulations.
To see if this result could be caused by a systematic trend in the high-throughput experiments, we randomly selected 35 pairs of mutants from distinct genes that have the same fitness level for single-deletion mutant and fitness difference between two mutants as the above 35 pairs of mutants within the same genes, and compared their relative prevalence of negative epistasis. The permutation was repeated 100,000 times, and the result is depicted in Fig. 2B. Among all repeats of randomly selected 35 mutant pairs, only a small percentage (4.1%) have 21 or more mutant pairs where the mutant with more severe defects has a higher chance than the other mutant to develop negative epistasis in the genome, indicating that our observation for different mutant alleles of the same gene is not likely caused by the overall pattern in the high-throughput experiments.
Using results from the above FBA simulation, we also confirmed the same pattern that between mutant alleles of the same gene, the mutant allele with more severe defect is more likely than the other allele to develop negative epistasis in the genome (Fig. 2A, Right). Indeed, an even higher percentage of mutant allele pairs in the FBA simulation (∼70%) than in real experiments (60%) support this conclusion. To avoid possible bias from the definition of epistasis and fitness differences between mutant alleles in the FBA simulation, we repeated the calculations based on multiple criteria and our conclusion remains the same (Fig. 2C).
Our observation is surprising given that previous results based on virus models or gene network simulations proposed a totally opposite pattern at the genome level, i.e., mutations with larger mutational defects are more likely to develop positive epistasis (33–37). We further used the FBA simulations to explore the dynamics of epistasis for various mutant alleles of the same gene in different species. High-quality genome-wide metabolic networks in three bacteria [Escherichia coli (38), Salmonella typhimurium (39), and Helicobacter pylori (40)], one archaea [Methanosarcina barkeri (41)], and another single-cell eukaryote [Plasmodium falciparum (42)] were used in our simulation. As shown in Fig. 3, when two mutant alleles of the same gene are compared, in 22%, 17%, 32%, and 19% of cases for E. coli, S. typhimurium, H. pylori, and M. barkeri, respectively, mutant alleles with more severe defects display higher percentages of negative epistasis than the other allele, indicating that more deleterious mutant alleles in the same gene indeed tend to develop positive epistasis in these species. However, these numbers are significantly smaller than that of yeast and another eukaryotic organism, P. falciparum (52%). The conclusion is robust under various epistasis thresholds (Fig. S5).
Fig. 3.

Mutant alleles with more severe defects tend to have a higher percentage of negative epistasis in eukaryotes than bacteria and archaea. The y axis shows the percentage of mutant pairs in which mutant alleles with more severe defects in the same gene have a higher percentage of negative epistasis than the other allele. FBA simulations were conducted for three bacterial species (E. coli, S. typhimurium, and H. pylori), one archaea species (M. barkeri), and two single-cell eukaryote species (P. falciparum and S. cerevisiae). The mean and SEs were based on results from 40 epistasis threshold values ranging from 0.01 to 0.05.
Self-Purging Mechanism for Deleterious Mutations at the Population Level.
Our above results indicate that between two random mutant alleles of the same gene, the chance for the allele with more severe mutational consequence to develop a higher percentage of negative epistasis than the other allele is 50∼70% in eukaryotic organisms, but only 20∼30% in bacteria and archaea. In other words, mutant alleles with more severe defects in the same gene might have a higher chance to develop negative epistasis in eukaryotic organisms than in bacteria and archaea. We constructed a simple population genetic model as in Fig. 4A to address the evolutionary significance of this observation. The genetic system has two genes: a query gene A, which contains three different alleles (AS: mutants with severe defects; AD: mutants with weak defects; AWT: WT), and a gene X, which has two different alleles (mutant, XM, and WT, XWT). We simulated the ratio of allele frequency between the severe and the weak mutant alleles in gene A under different probabilities of having negative epistasis between these two alleles and the mutant allele in the gene X.
Fig. 4.

Increased efficiency of purging deleterious mutations in eukaryotic organisms. (A) The population genetics model for allele frequency changes from generation to generation. In the figure, p and ω represent allele frequency and fitness, respectively. A and X are genes with different alleles, and ε is the epistasis term between mutant types of different genes. (B) The ratio of the severe to the weak alleles of the A gene in the 50th, 100th, 150th, 200th, 250th, and 300th generations. Colors represent the ratio as indicated at the bottom. The diagonal line in each panel represents the situation where the severe and the weak mutant alleles have the same probability of having negative epistasis in the genome. It is noteworthy to point out that in each panel the ratio of the severe to the weak alleles decreases, indicating increased efficiency of purging the severe mutant allele, from the Upper Right (region I, the weak mutant has more negative epistasis) to the Bottom Left (region II, the severe mutant has more negative epistasis) part of the panel. The arrows A and B are discussed in the text.
Our results in Fig. 4B depict the simulation results. The six panels in the figure represent the ratio of AS to AD alleles in the 50th, 100th, 150th, 200th, 250th, and 300th generations, respectively. Our simulations indicate that if the percentage of negative epistasis for the severe mutant is kept as a constant, as the percentage of negative epistasis for the weak mutation increases (as shown by the arrow A), the ratio of the severe to the weak allele frequency would increase. However, this ratio would decrease, indicating a faster removal of the severe mutants from the population, in another direction (as shown by the arrow B), i.e., the percentage of negative epistasis for the weak mutant is kept as a constant, but the percentage of negative epistasis for the severe mutant increases. Therefore, the distribution for the sign of epistasis among different alleles of the same gene observed in this study might represent an efficient way for eukaryotic organisms to purge deleterious mutations from populations.
Discussion
Our study represents a genome-wide theoretical survey for the dynamics of global epistatic effects under various mutant alleles of the same gene. We show that the epistatic profiling of a gene at the genome level is largely dependent on mutant types involved. Our results indicate that previous conclusions inferring epistatic relations among genes based on only one mutant type per gene can be greatly improved by using multiple mutant alleles. More importantly, our study shows that mutant alleles with severe defects have a higher chance to develop negative epistasis in eukaryotic organisms than in bacteria and archaea. It has been speculated that eukaryotic organisms might have more negative epistasis due to their increased complexity over prokaryotic organisms (43, 44). Even if this hypothesis is true, however, our results for different mutant alleles of the same gene cannot be directly inferred from this complexity argument.
Even though the mechanism underlying our observation remains to be determined, we argue that such distributions for negative epistasis among different alleles of the same genes have significant evolutionary consequences, as shown in our population genetics simulations (Fig. 4). The origin and maintenance of sexual reproduction remains one of the central issues in evolutionary biology. Population genetics models have been proposed to explore the impact of epistasis on the maintenance of sexual reproduction (45–48). The mutational deterministic hypothesis posits that sex enhances the ability of natural selection to purge deleterious mutations by bringing them together into single genome through recombination (45). This explanation requires the prevalence of negative epistasis at the genome level. Here we found that the mutations with larger deleterious defects within the same gene have a higher chance to develop negative epistasis in eukaryotic organisms than bacteria and archaea. The model we proposed in Fig. 4, which is based on the population genetics theory from Kondrashov (45), indicates that such distribution of negative epistasis among different alleles of the same gene in eukaryotic organisms might lead to more efficient purging of deleterious mutations from populations, thus providing a previously unappreciated evolutionary advantage for sexual reproduction. We emphasize that these findings do not necessarily provide sufficient evidence to explain the cause for the emergence of sexual reproduction during evolution.
Although we found several unique characteristics regarding the global epistatic landscape of different mutant alleles in the same gene, three caveats need to be addressed. First, the FBA modeling used in this study, which has been successfully applied to various research problems (19–24), includes only metabolic genes in the simulation. However, results from our analysis on the experimentally defined epistatic relations among ∼0.2 million double mutants comprising ∼4,000 S. cerevisiae genes, which nearly represent all functional categories in the budding yeast, confirmed our major FBA modeling predictions.
Second, even though FBA is one of the most comprehensive computational tools for simulating epistatic interactions among genes, there are still many aspects that can be improved to aid in capturing the full set of empirical genetic interactions (49). For example, rules for transcriptional regulation and physical interactions can be integrated into the current FBA framework to improve its accuracy (50). In addition, mapping between individual alleles and metabolic flux reduction is a complex process and difficult to measure experimentally (51). It is noteworthy that in our simulations we have uniformly evaluated fitness consequence based on the percentage of WT flux attainable in a specific background. Depending on the regulation dynamics of individual genes, such uniform sampling may be unlikely to correspond to random sampling of mutant alleles. For instance, a mutation that limits the availability of a ligand that activates an enzyme following a Hill equation with early saturation may have a very high frequency of neutral or mildly deleterious mutations compared with a similar enzyme with late saturation. Nevertheless, uniform sampling in our study is still useful in illustrating the main evolutionary ideas presented here, which all have to do with relative severity of mutations rather than their absolute fitness.
Third, measuring the presence of epistasis is subject to a choice of threshold. Does the flux smoothly influence epistasis, or can epistasis abruptly change or become zero? We have seen evidence of both trends in our simulations. Though there are many different trends in the magnitude of epistasis that we are currently investigating, we present two cases to explore this issue (Figs. S6 and S7 and Datasets S3 and S4). However, based on Figs. S4 and S5, we have confirmed that our major results are robust to a variety of epistasis thresholds. As a result, although the choice of thresholds is a common problem for research on epistasis, we are still confident that our conclusion is unlikely to be significantly influenced by this factor. With these limitations in mind, our observations identified several important features for the epistasis among genes, and call on future experimental and theoretical efforts to revisit genetics and evolutionary theories that can integrate epistatic dynamics among genes in biological systems.
Methods
Experimental Dataset.
The experimental data were extracted from a global survey for the epistatic interactions among genes in S. cerevisiae (4). In the original SGA study (4), the authors screened 1,712 S. cerevisiae query gene mutants against 3,885 array gene mutants to generate a total of more than 5 million gene mutant pairs spanning all biological processes. In each gene mutant pair, the epistasis value is calculated based on the equation ε = Wxy − WxWy, in which Wxy is the fitness of an organism with two mutations in genes X and Y, and Wx or Wy refers to the fitness of the organism with mutation only at gene X or Y, respectively. In addition, a statistical confidence measure (P value) was assigned to each interaction based on the observed variation of each double mutant across four experimental replicates and estimates of the background error distributions for the corresponding query and array mutants. Finally, a defined confidence threshold (|ε| ≥ 0.01, P < 0.05) was applied to generate epistatic interactions (4).
Flux Balance Analysis.
FBA frames the stoichiometric equations that describe the biological reactions of a system as the following matrix equations, which is possible because stoichiometric equations are linear (16–18).
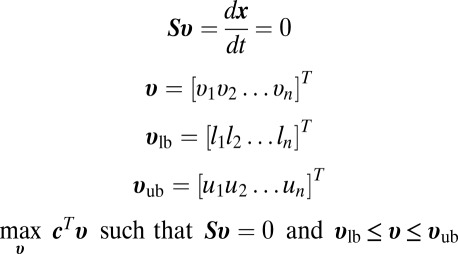 |
The vector of concentration change over time (dx/dt) is found by multiplying the stoichiometric matrix S by a flux vector v. S has columns corresponding to each reaction in the system, and rows corresponding to metabolites. Typically, one or more enzymes correspond to each reaction, which allows us to see how a genetic perturbation, such as a knockout, may affect the system. The vector v consists of reaction fluxes and is subject to upper and lower bounds vub and vlb. If we want to simulate the knockout or knockdown of an enzyme, the fluxes corresponding to that enzyme can be constrained to be zero or lower than WT, respectively. It is assumed that the change in concentration over time is at steady state, therefore dx/dt = 0 in the FBA simulation (18).
The linear objective is written in terms of the vi with weight coefficients ci. Modified versions of COBRA and COBRA2 scripts, popular FBA software packages written for MATLAB, were used to implement our simulation framework (17). The method for calculating a realistic WT flux for a given environment and organism model is taken from Smallbone and Simeonidis (18). This method, termed geometric FBA, attempts to choose a flux vector that is close to the average of all optimal flux vectors. The geometric FBA solution is also a minimal L1-norm solution, which has been previously heralded as a good choice because it minimizes the total amount of flux needed to achieve the objective, based on the fact that cells would avoid having much unnecessary flux and wasted energy (18). A minimal L1-norm solution is advantageous in this study because restricting fluxes for mutants based on unnecessarily large WT fluxes may not constrain the system. Finally, the minimal L1-norm solution avoids the problem of having futile cycles, which are thermodynamically infeasible (18).
Mutations of genes are simulated by the use of gene-reaction mapping and flux constraints. Enzymes may be involved in multiple reactions (i.e., pleiotropy). Although we often have Boolean rules describing the relationship between genes in an enzyme complex, it is currently extremely difficult to ascertain the exact contribution of each enzyme to each reaction (51). Choosing the simplest unbiased approach, we used gene-reaction mapping and uniformly constrained the flux through each reaction associated to the gene being mutated. With one notable exception (24), most research relating to simulation of mutations with FBA has focused on null mutants (19–23, 25, 26). Our simulation approach, though simplifying the actual dynamics that result in decreased fluxes in vivo, allows us to see behavior that was not previously possible. To be consistent, we used the same equation and threshold (|ε| ≥ 0.01) to calculate epistasis for FBA results as we did for the experimental data.
Population Genetics Model.
A flowchart in Fig. S8 provides more illustration of the simulation procedure. We constructed a genetic system with a query gene A, which contains three different alleles (AS: severe mutant; AD: weakly deleterious mutants; and AWT: WT) and a gene X that has two different alleles (XM: mutant and XWT: WT). The table in Fig. 4A explains how genotype frequencies could be calculated from generation T to generation T + 1 under natural selection. In the figure, p and ω represent allele frequency and fitness, respectively. The average fitness in generation T could be calculated (52).
We simulated the ratio of allele frequency for the severe (AS) to the weak (AD) mutant alleles of the A gene under all possible combinations of the percentages of negative epistasis for these two alleles, as shown on the x and y axis of Fig. 4B. For each possible combination in each generation (a specific location on each panel of Fig. 4B), the following two-step procedure was repeated 1,000 times. First, the epistatic relations (negative, positive, and no epistasis) between the mutant alleles of the genes A and X were randomly determined as the following: either A allele is assumed to have 10% possibility of having epistasis (either positive or negative) with the allele XM (4); when A and X alleles do have epistasis, the likelihoods for the epistasis being negative (and the remaining epistases are positive) are assigned independently for AS and AD alleles according to their location on Fig. 4B. Second, the fitness of each genotype was calculated, which was then used to infer the genotype frequencies in the next generation according to Fig. 4A. The average genotype frequencies among 1,000 randomizations were then recorded for simulations in the next generation. The ratio of allele frequency for the severe to the weak mutant alleles of the A gene in each generation was calculated based on genotype frequencies in that generation.
To make the simulation simple, the initial allele frequencies for the severe, weak, and WT alleles of the A gene were assumed to be equal (one-third), and the initial allele frequencies for the mutant and WT of the X gene were also assumed to be equal (one-half). The fitness was assumed to be 1, 0.99, and 0.98 for the WT, weak, and severe mutant alleles of gene A, respectively, and 1 and 0.99 for the WT and the mutant alleles of gene X, respectively. The positive and negative epistasis values between A and X gene mutants were assumed to be 0.01 and −0.01, respectively. A variety of fitness differences between the severe and weak alleles and epistasis values have also been used in the simulations, and the trend remains the same.
Supplementary Material
Acknowledgments
We thank Dr. Ricardo Azevedo for his insights and critical comments on the paper; Dr. Huifeng Jiang and Mr. Kaxiong Ye for discussion; and the editor and two anonymous reviewers for constructive comments. This work was supported by a startup fund from Cornell University, National Science Foundation Grant DEB-0949556, and National Institutes of Health Grant 1R01AI085286 (to Z.G.).
Footnotes
The authors declare no conflict of interest.
*This Direct Submission article had a prearranged editor.
This article contains supporting information online at www.pnas.org/lookup/suppl/doi:10.1073/pnas.1121507109/-/DCSupplemental.
References
- 1.Phillips PC. Epistasis—the essential role of gene interactions in the structure and evolution of genetic systems. Nat Rev Genet. 2008;9:855–867. doi: 10.1038/nrg2452. [DOI] [PMC free article] [PubMed] [Google Scholar]
- 2.Boone C, Bussey H, Andrews BJ. Exploring genetic interactions and networks with yeast. Nat Rev Genet. 2007;8:437–449. doi: 10.1038/nrg2085. [DOI] [PubMed] [Google Scholar]
- 3.Kimura M, Maruyama T. The mutational load with epistatic gene interactions in fitness. Genetics. 1966;54:1337–1351. doi: 10.1093/genetics/54.6.1337. [DOI] [PMC free article] [PubMed] [Google Scholar]
- 4.Costanzo M, et al. The genetic landscape of a cell. Science. 2010;327:425–431. doi: 10.1126/science.1180823. [DOI] [PMC free article] [PubMed] [Google Scholar]
- 5.Tong AH, et al. Global mapping of the yeast genetic interaction network. Science. 2004;303:808–813. doi: 10.1126/science.1091317. [DOI] [PubMed] [Google Scholar]
- 6.Pan X, et al. A robust toolkit for functional profiling of the yeast genome. Mol Cell. 2004;16:487–496. doi: 10.1016/j.molcel.2004.09.035. [DOI] [PubMed] [Google Scholar]
- 7.Pan X, et al. A DNA integrity network in the yeast Saccharomyces cerevisiae. Cell. 2006;124:1069–1081. doi: 10.1016/j.cell.2005.12.036. [DOI] [PubMed] [Google Scholar]
- 8.Measday V, Hieter P. Synthetic dosage lethality. Methods Enzymol. 2002;350:316–326. doi: 10.1016/s0076-6879(02)50971-x. [DOI] [PubMed] [Google Scholar]
- 9.Measday V, et al. Systematic yeast synthetic lethal and synthetic dosage lethal screens identify genes required for chromosome segregation. Proc Natl Acad Sci USA. 2005;102:13956–13961. doi: 10.1073/pnas.0503504102. [DOI] [PMC free article] [PubMed] [Google Scholar]
- 10.Sopko R, et al. Mapping pathways and phenotypes by systematic gene overexpression. Mol Cell. 2006;21:319–330. doi: 10.1016/j.molcel.2005.12.011. [DOI] [PubMed] [Google Scholar]
- 11.Collins SR, et al. Functional dissection of protein complexes involved in yeast chromosome biology using a genetic interaction map. Nature. 2007;446:806–810. doi: 10.1038/nature05649. [DOI] [PubMed] [Google Scholar]
- 12.Kornmann B, et al. An ER-mitochondria tethering complex revealed by a synthetic biology screen. Science. 2009;325:477–481. doi: 10.1126/science.1175088. [DOI] [PMC free article] [PubMed] [Google Scholar]
- 13.Fiedler D, et al. Functional organization of the S. cerevisiae phosphorylation network. Cell. 2009;136:952–963. doi: 10.1016/j.cell.2008.12.039. [DOI] [PMC free article] [PubMed] [Google Scholar]
- 14.Bonhoeffer S, Chappey C, Parkin NT, Whitcomb JM, Petropoulos CJ. Evidence for positive epistasis in HIV-1. Science. 2004;306:1547–1550. doi: 10.1126/science.1101786. [DOI] [PubMed] [Google Scholar]
- 15.Roguev A, et al. Conservation and rewiring of functional modules revealed by an epistasis map in fission yeast. Science. 2008;322:405–410. doi: 10.1126/science.1162609. [DOI] [PMC free article] [PubMed] [Google Scholar]
- 16.Mo ML, Palsson BO, Herrgård MJ. Connecting extracellular metabolomic measurements to intracellular flux states in yeast. BMC Syst Biol. 2009;3:37. doi: 10.1186/1752-0509-3-37. [DOI] [PMC free article] [PubMed] [Google Scholar]
- 17.Becker SA, et al. Quantitative prediction of cellular metabolism with constraint-based models: The COBRA Toolbox. Nat Protoc. 2007;2:727–738. doi: 10.1038/nprot.2007.99. [DOI] [PubMed] [Google Scholar]
- 18.Smallbone K, Simeonidis E. Flux balance analysis: A geometric perspective. J Theor Biol. 2009;258:311–315. doi: 10.1016/j.jtbi.2009.01.027. [DOI] [PubMed] [Google Scholar]
- 19.Papp B, Pál C, Hurst LD. Metabolic network analysis of the causes and evolution of enzyme dispensability in yeast. Nature. 2004;429:661–664. doi: 10.1038/nature02636. [DOI] [PubMed] [Google Scholar]
- 20.Ibarra RU, Edwards JS, Palsson BO. Escherichia coli K-12 undergoes adaptive evolution to achieve in silico predicted optimal growth. Nature. 2002;420:186–189. doi: 10.1038/nature01149. [DOI] [PubMed] [Google Scholar]
- 21.Harrison R, Papp B, Pál C, Oliver SG, Delneri D. Plasticity of genetic interactions in metabolic networks of yeast. Proc Natl Acad Sci USA. 2007;104:2307–2312. doi: 10.1073/pnas.0607153104. [DOI] [PMC free article] [PubMed] [Google Scholar]
- 22.Deutscher D, Meilijson I, Kupiec M, Ruppin E. Multiple knockout analysis of genetic robustness in the yeast metabolic network. Nat Genet. 2006;38:993–998. doi: 10.1038/ng1856. [DOI] [PubMed] [Google Scholar]
- 23.Segrè D, Deluna A, Church GM, Kishony R. Modular epistasis in yeast metabolism. Nat Genet. 2005;37:77–83. doi: 10.1038/ng1489. [DOI] [PubMed] [Google Scholar]
- 24.He X, Qian W, Wang Z, Li Y, Zhang J. Prevalent positive epistasis in Escherichia coli and Saccharomyces cerevisiae metabolic networks. Nat Genet. 2010;42:272–276. doi: 10.1038/ng.524. [DOI] [PMC free article] [PubMed] [Google Scholar]
- 25.Edwards JS, Ibarra RU, Palsson BO. In silico predictions of Escherichia coli metabolic capabilities are consistent with experimental data. Nat Biotechnol. 2001;19:125–130. doi: 10.1038/84379. [DOI] [PubMed] [Google Scholar]
- 26.Segrè D, Vitkup D, Church GM. Analysis of optimality in natural and perturbed metabolic networks. Proc Natl Acad Sci USA. 2002;99:15112–15117. doi: 10.1073/pnas.232349399. [DOI] [PMC free article] [PubMed] [Google Scholar]
- 27.Shlomi T, Berkman O, Ruppin E. Regulatory on/off minimization of metabolic flux changes after genetic perturbations. Proc Natl Acad Sci USA. 2005;102:7695–7700. doi: 10.1073/pnas.0406346102. [DOI] [PMC free article] [PubMed] [Google Scholar]
- 28.AbuOun M, et al. Genome scale reconstruction of a Salmonella metabolic model: Comparison of similarity and differences with a commensal Escherichia coli strain. J Biol Chem. 2009;284:29480–29488. doi: 10.1074/jbc.M109.005868. [DOI] [PMC free article] [PubMed] [Google Scholar]
- 29.Durot M, Bourguignon PY, Schachter V. Genome-scale models of bacterial metabolism: Reconstruction and applications. FEMS Microbiol Rev. 2009;33:164–190. doi: 10.1111/j.1574-6976.2008.00146.x. [DOI] [PMC free article] [PubMed] [Google Scholar]
- 30.Feist AM, Palsson BO. The growing scope of applications of genome-scale metabolic reconstructions using Escherichia coli. Nat Biotechnol. 2008;26:659–667. doi: 10.1038/nbt1401. [DOI] [PMC free article] [PubMed] [Google Scholar]
- 31.Fong SS, et al. In silico design and adaptive evolution of Escherichia coli for production of lactic acid. Biotechnol Bioeng. 2005;91:643–648. doi: 10.1002/bit.20542. [DOI] [PubMed] [Google Scholar]
- 32.Fong SS, Joyce AR, Palsson BO. Parallel adaptive evolution cultures of Escherichia coli lead to convergent growth phenotypes with different gene expression states. Genome Res. 2005;15:1365–1372. doi: 10.1101/gr.3832305. [DOI] [PMC free article] [PubMed] [Google Scholar]
- 33.Burch CL, Chao L. Epistasis and its relationship to canalization in the RNA virus phi 6. Genetics. 2004;167:559–567. doi: 10.1534/genetics.103.021196. [DOI] [PMC free article] [PubMed] [Google Scholar]
- 34.You L, Yin J. Dependence of epistasis on environment and mutation severity as revealed by in silico mutagenesis of phage t7. Genetics. 2002;160:1273–1281. doi: 10.1093/genetics/160.4.1273. [DOI] [PMC free article] [PubMed] [Google Scholar]
- 35.Sanjuán R. Quantifying antagonistic epistasis in a multifunctional RNA secondary structure of the Rous sarcoma virus. J Gen Virol. 2006;87:1595–1602. doi: 10.1099/vir.0.81585-0. [DOI] [PubMed] [Google Scholar]
- 36.Azevedo RB, Lohaus R, Srinivasan S, Dang KK, Burch CL. Sexual reproduction selects for robustness and negative epistasis in artificial gene networks. Nature. 2006;440:87–90. doi: 10.1038/nature04488. [DOI] [PubMed] [Google Scholar]
- 37.Lohaus R, Burch CL, Azevedo RB. Genetic architecture and the evolution of sex. J Hered. 2010;101(Suppl 1):S142–S157. doi: 10.1093/jhered/esq013. [DOI] [PubMed] [Google Scholar]
- 38.Feist AM, et al. A genome-scale metabolic reconstruction for Escherichia coli K-12 MG1655 that accounts for 1260 ORFs and thermodynamic information. Mol Syst Biol. 2007;3:121. doi: 10.1038/msb4100155. [DOI] [PMC free article] [PubMed] [Google Scholar]
- 39.Thiele I, et al. A community effort towards a knowledge-base and mathematical model of the human pathogen Salmonella Typhimurium LT2. BMC Syst Biol. 2011;5:8. doi: 10.1186/1752-0509-5-8. [DOI] [PMC free article] [PubMed] [Google Scholar]
- 40.Thiele I, Vo TD, Price ND, Palsson BO. Expanded metabolic reconstruction of Helicobacter pylori (iIT341 GSM/GPR): An in silico genome-scale characterization of single- and double-deletion mutants. J Bacteriol. 2005;187:5818–5830. doi: 10.1128/JB.187.16.5818-5830.2005. [DOI] [PMC free article] [PubMed] [Google Scholar]
- 41.Feist AM, Scholten JC, Palsson BO, Brockman FJ, Ideker T. Modeling methanogenesis with a genome-scale metabolic reconstruction of Methanosarcina barkeri. Mol Syst Biol. 2006;2:2006, 0004. doi: 10.1038/msb4100046. [DOI] [PMC free article] [PubMed] [Google Scholar]
- 42.Plata G, Hsiao TL, Olszewski KL, Llinás M, Vitkup D. Reconstruction and flux-balance analysis of the Plasmodium falciparum metabolic network. Mol Syst Biol. 2010;6:408. doi: 10.1038/msb.2010.60. [DOI] [PMC free article] [PubMed] [Google Scholar]
- 43.Sanjuán R, Elena SF. Epistasis correlates to genomic complexity. Proc Natl Acad Sci USA. 2006;103:14402–14405. doi: 10.1073/pnas.0604543103. [DOI] [PMC free article] [PubMed] [Google Scholar]
- 44.Sanjuán R, Nebot MR. A network model for the correlation between epistasis and genomic complexity. PLoS ONE. 2008;3:e2663. doi: 10.1371/journal.pone.0002663. [DOI] [PMC free article] [PubMed] [Google Scholar]
- 45.Kondrashov AS. Deleterious mutations and the evolution of sexual reproduction. Nature. 1988;336:435–440. doi: 10.1038/336435a0. [DOI] [PubMed] [Google Scholar]
- 46.Otto SP. Unravelling the evolutionary advantage of sex: A commentary on ‘Mutation-selection balance and the evolutionary advantage of sex and recombination’ by Brian Charlesworth. Genet Res. 2007;89:447–449. doi: 10.1017/S001667230800966X. [DOI] [PubMed] [Google Scholar]
- 47.de Visser JA, Elena SF. The evolution of sex: Empirical insights into the roles of epistasis and drift. Nat Rev Genet. 2007;8:139–149. doi: 10.1038/nrg1985. [DOI] [PubMed] [Google Scholar]
- 48.Kouyos RD, Silander OK, Bonhoeffer S. Epistasis between deleterious mutations and the evolution of recombination. Trends Ecol Evol. 2007;22:308–315. doi: 10.1016/j.tree.2007.02.014. [DOI] [PubMed] [Google Scholar]
- 49.Covert MW, Schilling CH, Palsson B. Regulation of gene expression in flux balance models of metabolism. J Theor Biol. 2001;213:73–88. doi: 10.1006/jtbi.2001.2405. [DOI] [PubMed] [Google Scholar]
- 50.Szappanos B, et al. An integrated approach to characterize genetic interaction networks in yeast metabolism. Nat Genet. 2011;43:656–662. doi: 10.1038/ng.846. [DOI] [PMC free article] [PubMed] [Google Scholar]
- 51.Banta S, et al. Contribution of gene expression to metabolic fluxes in hypermetabolic livers induced through burn injury and cecal ligation and puncture in rats. Biotechnol Bioeng. 2007;97:118–137. doi: 10.1002/bit.21200. [DOI] [PMC free article] [PubMed] [Google Scholar]
- 52.Hartl DL, Clark AG. Principles of Population Genetics. Sunderland, MA: Sinauer; 2007. [Google Scholar]
Associated Data
This section collects any data citations, data availability statements, or supplementary materials included in this article.