

Abstract
Fluorescent small molecules have become indispensable tools for biomedical research along with the rapidly developing optical imaging technology. We report here a neural stem cell specific boron-dipyrromethane (BODIPY) derivative compound of designation red 3 (CDr3), developed through a high throughput/content screening of in-house generated diversity oriented fluorescence library in stem cells at different developmental stages. This novel compound specifically detects living neural stem cells of both human and mouse origin. Furthermore, we identified its binding target by proteomic analysis as fatty acid binding protein 7 (FABP7), also known as brain lipid binding protein) which is highly expressed in neural stem cells and localized in the cytoplasm. CDr3 will be a valuable chemical tool in the study and applications of neural stem cells.
Keywords: BLBP, DOFL, high throughput screening, mass spectrometry, radial glia
Neural stem cells (NSCs) generate the nervous system, promote neuronal plasticity and repair damage throughout life by self-renewing and differentiating into neurons and glia (1, 2). They have great potential for therapeutic use in patients suffering from neurological diseases (3) and also as a research tool for drug development (4). The conventional method for the detection and characterization of living NSCs depends on immunodetection of marker molecules, which involves the use of xenogenic antibodies and is limited to the expression of cell surface molecules. Therefore, there is a significant unmet need for more convenient and safer methods that detect living NSCs.
Synthetic small molecules are now being explored for highly sophisticated and biologically safe bioimaging probes to detect specific biomolecules and visualize cellular and molecular events. Employing fluorescence has particular advantages in optical imaging. Many fluorescent chemical sensors and tags have been used in broad range of biomedical science and engineering. However, cell type specific fluorescent small molecules which are known to bind to molecular biomarkers are very rare. We have generated Diversity Oriented Fluorescence Library (DOFL) by exploring diverse chemical space directly around fluorophores and previously reported a pluripotent stem cell probe CDy1, which was discovered by a screening of 280 rosamine compounds (5, 6). In the current study, we expanded our DOFL using various fluorophores and screened them in a set of cells at different stages of development into neural cells and discovered a boron-dipyrromethane (BODIPY) compound of designation red 3 (CDr3), which specifically identifies NSCs of both human and mouse origin.
Cellular binding partners of small molecules have commonly been identified by affinity method, which requires modification of the compounds to be attached to solid-phase resin. The modification, however, may change the biological activities of the compounds and the in vitro conditions for binding may bring a false target which is different from the actual in vivo target (7). In contrast, the intrinsic fluorescence property of our DOFL compounds makes it possible to track the targets without any modification from the stained living cells through all processes for target identification once they bind strongly to the target molecules. We further tracked down the CDr3 signal and identified its cellular binding target as fatty acid binding protein 7 (FABP7) which is known as an intracellular biomarker of NSCs.
Results
CDr3 was Discovered by a High Throughput/Content DOFL Screening.
We screened 3,160 DOFL compounds generated from various fluorescent scaffolds in E14 mouse embryonic stem cell (mESC), E14-derived NSC (NS5), differentiated NS5 into astrocyte (D-NS5) (8) and mouse embryonic fibroblast (MEF). Based on fluorescence intensity analyzed using image analysis software and visual confirmation, we selected 221 compounds that stained NS5 more brightly than the other cell types for further validation. These primary hits were tested for different incubation times ranging from 1 h to 48 h and were subsequently narrowed down to 16 compounds that stained NS5 consistently. We then validated the 16 compounds by flow cytometry to identify a compound named as CDr3 (λex/λem = 579/604 nm; extinction coefficient = 1.02 × 10⁶ M-1 cm-1; quantum yield = 0.77) as the final hit that stains NS5 most selectively and brightly (Fig. 1 A–C). CDr3 was derived from an activated ester of BODIPY® FL (4,4-difluoro-5,7-dimethyl-4-bora-3a,4a-diaza-s-indacene-3-propionic acid). Due to the acidity of the 5-methyl group, the activated ester of BODIPY® FL was reacted with 3,4-dimethyl aldehyde through Knoevenagel condensation to render CDr3 as a new fluorescent probe (Figs. S1 and S2). The condensation reaction led to a red shift in the fluorescence emission properties due to the extended π-conjugation system. The half maximal staining intensity measured after 1 h incubation with NS5 was obtained at 0.39 μM (Fig. S3). We further assessed the specificity of CDr3 in mixed brain cell cultures prepared from postnatal mouse brains. With the appearance of numerous morphologically distinct populations of cells after 2 wks in vitro culture, they were incubated with CDr3 and Hoechst33342. While the NS5 treated with the same procedure in parallel were brightly stained by CDr3, the various types of primary cells were not stained. The primary cells thereafter were immunostained to demonstrate the presence of neurons, astrocytes and other types of cells (Fig. S4).
Fig. 1.

Selective Staining of NS5 by CDr3. (A) Chemical structure of CDr3. (B) Nuclei of E14, NS5, D-NS5, and MEF were visualized by Hoechst 33342; but only NS5 was selectively stained by CDr3. Left phase contrast bright-field (BF) images; Right fluorescent (FL) images obtained with DAPI and Texas Red filter set. Scale bar, 50 μm. (C) Flow cytometry dot plot images of E14, NS5, D-NS5, and MEF incubated with CDr3. DMSO was added for unstained control cells. The images of each type of cells were overlaid.
CDr3 Does Not Affect Normal Proliferation of NSCs.
We then determined whether CDr3 affects NSC proliferation by culturing NS5 and mouse neurospheres in the presence of CDr3. Total numbers of NS5 cells grown for 6 h and 48 h and the percentage of BrdU positive cells pulse-labeled in the CDr3-containing medium were not different from those of cells grown in DMSO-only containing medium which was used as a vehicle control (Fig. S5 A and B). In accordance with the result of experiment with NS5 cells, the number and size of neurospheres generated in the presence of CDr3 were not different from control (Fig. S5C).
CDr3 Binds to an Intracellular NSC Marker FABP7.
When we subjected CDr3-stained NS5 cell lysate to 2-dimensional SDS-PAGE for a fluorescence scan, a major spot of ∼15 kDa was detected (Fig. 2A). MALDI-TOF/TOF MS and MS/MS analysis allowed us to identify the stained protein as FABP7 (Fig. 2B). NS5 used in the current study as a NSC is known to express FABP7 (8). We examined the mRNA expression level of FABP7 by real time RT-PCR and observed that its level in NS5 is 282-fold and 7,220-fold higher than in MEF and E14, respectively, and decreases fivefold upon 3 d differentiation into astrocyte (Fig. 2C). High magnification confocal microscopy showed that CDr3 stains the cytoplasm of NS5 where the majority of FABP7 localizes (Fig. 2D). To confirm that FABP7 is the specific binding target of CDr3, we cloned both human and mouse FABP7 genes and fused them to EGFP constructs for expression in HEK293 cells. It was observed that the signals of EGFP and CDr3 overlap in the cells that express either human or mouse FABP7 fused to EGFP (Fig. 3). Transient expression of the transfected FABP7 genes was verified by the detection of FABP7 by Western blotting (Fig. S6). Then we subcloned the human FABP7 gene into a bacterial expression vector with His-tag to facilitate purification of recombinant FABP7 for in vitro binding assays. The interaction between CDr3 and FABP7 in vitro was demonstrated by FABP7 concentration-dependent increase of CDr3 fluorescence with a dissociation constant of 9.6 μM (Fig. S7A). Job plot analysis showed a symmetrical shape of fluorescence increase with a maximum at a CDr3 ratio of 0.5 implying that the binding stoichiometry between CDr3 and FABP7 is 1∶1 (Fig. S7B).
Fig. 2.

Identification of CDr3 Binding Protein. (A) Protein lysate of CDr3-stained NS5 was separated by 2DE. The major fluorescent spot was marked with a red circle (Upper). Many silver-stained protein spots were detected in a duplicate gel (Lower). (B) MS/MS fragment ion analysis of tryptic peptide (MVVTLTFGDIVAVR) indicated FABP7 as a binding target of CDr3. Only the main y-series of ion fragmentation was labelled in the spectrum. M* indicates oxidation at methionine residue. (C) Quantitative real time RT-PCR analysis of FABP7 mRNA in E14, NS5, D-NS5 and MEF. Relative expression level of FABP7 to GAPDH is depicted. (D) The confocal fluorescence image acquired on a Nikon A1R microscope using a 100× objective lens shows cytoplasmic localization of CDr3. Nuclei were stained with Hoechst 33342. Scale bar, 10 µm.
Fig. 3.

CDr3 Binding to Recombinant FABP7. Fluorescence signals from EGFP and CDr3 overlap only in the cells expressing either mouse FABP7 or human FABP7 fused to EGFP. The fluorescence images were acquired on a Nikon Ti microscope using DAPI, FITC and Texas Red filter sets. Scale bar, 50 µm.
CDr3 Identifies Both Mouse and Human NSCs.
Having found that CDr3 stains not only mouse FABP7 expressing HEK293 cells, but also human FABP7 expressing cells, we attempted to test CDr3 on ReNcell VM human NSC line (Millipore) derived from the ventral mesencephalon region of human fetal brain tissue. This cell line, immortalized by retroviral transduction with the v-myc gene, is karyotypically normal, expresses high level of NSC marker nestin and can differentiate into neuron, astrocyte and oligodendrocyte (9). However, it has not previously been known to express FABP7. We first examined the expression level of FABP7 by real time RT-PCR and found a 540-fold higher level of FABP7 mRNA in ReNcell VM than in H1 human ESC. This expression was dramatically (20-fold) down-regulated upon differentiation into neurons (Fig. 4A). Western blot analysis demonstrated a similar observation in protein expression levels with a strong FABP7 band at 14 kDa detected in ReNcell VM lysate while no FABP7 was detected in the lysates of H1 and ReNcell VM-derived neurons (Fig. 4B). In accordance with the Western blot data, ReNcell VM were strongly stained by FABP7 antibody while H1 and ReNcell VM-derived neurons were not stained (Fig. 4C). We then incubated the 3 types of cells with CDr3 to determine whether living ReNcell VM could be distinguished by the compound among others. As expected from the FABP7 expression analysis data, CDr3 selectively stained ReNcell VM in live cell cultures (Fig. 4D).
Fig. 4.

Selective Staining of Human NSC ReNcell VM by CDr3. (A) Real-time PCR analysis of FABP7 expression in H1, ReNcell VM and ReNcell VM-differentiated neurons. Relative expression level of FABP7 to GAPDH is depicted. (B) Strong signal of FABP7 protein (14 kDa) was detected by Western blotting in ReNcell VM (lane 3) lysate, while it was not detectable in the lysates of H1 (lane 1) and ReNcell VM-differentiated neurons (lane 2). β-Actin (42 kDa) staining demonstrates consistent loading across sample lanes. Fluorescence scan of the gel showed CDr3-labelled FABP7 in the lysate of ReNcell VM (lane 3) incubated with CDr3. (C) Immunocytochemistry of FABP7 in H1, ReNcell VM and ReNcell VM-differentiated neurons (D-ReNcell VM). Only ReNcell VM was brightly stained by FABP7 antibody. Scale bar, 50 µm. (D) H1, ReNcell VM and ReNcell VM-differentiated neurons were incubated with CDr3. Fluorescence signal was detected only in ReNcell VM. Upper: phase contrast bright-field image; Lower: fluorescence image. Scale bar, 50 µm.
NSC Can be Isolated Using CDr3 from Heterogeneous Cell Populations.
Next, we were interested to test whether CDr3 can be used for the isolation of living NSCs from heterogeneous population of cells generated by a random differentiation of ESCs. We induced differentiation of mESC to embryoid bodies using retinoic acid (10, 11). CDr3bright and CDr3dim cells were separately collected by FACS from embryoid body cells stained with CDr3 (Fig. S8 A and B). Each cell population was stained with FABP7 antibody and analyzed by flow cytometry. The overlay plot showed two well-separated clusters, which can be interpreted as the cells isolated by CDr3 from the heterogeneous embryoid body cells were FABP7 expressing cells (Fig. S8C). The expression of FABP7 in cultured CDr3bright cells was confirmed by immunocytochemistry (Fig. S8D).
Discussion
Identification of specific types of living cells mostly depends on cell surface marker detection using antibodies. However, certain types of cells can be distinguished more specifically by intracellular markers which can be detected by small molecules but not by antibodies. The binding target of CDr3, FABP7, is a well-known intracellular marker of NSC. Among the currently known nine mammalian FABPs that play pivotal roles in transporting and trafficking of lipids in various tissues, FABP7 is particularly expressed in the central nervous system (12). Its expression is pronounced during the fetal period contributing to the normal development of neuroepithelial cells and knocking down the gene’s expression causes premature differentiation of neuroepithelial cells to neurons (13–15). The FABP7 knockout mouse exhibits enhanced anxiety, reduced prepulse inhibition and shorter startle latency. A dramatic decrease in the number of neural stem cells is also observed in the hippocampal dentate gyrus of the mouse (16, 17). The neuroepithelial cells differentiate into radial glial cells which further differentiate to neurons and glias in the developing and also adult brains (18–20). During in vitro neural differentiation of ESC, FABP7 expressing radial glial cells are the common NSCs which intermediate between ESC and fully differentiated neurons and glias (21–23). In the presence of CDr3 in the medium, the ESC, differentiated NSC and primary brain cells are stained, but not as bright as NS5 or ReNcell VM. By rinsing, CDr3 is rapidly washed out from these cells, while NS5 and ReNcell remain brightly stained. These observations imply that CDr3 passively diffuses into the cell to be retained by binding to FABP7 rendering CDr3 specific for FABP7-expressing NSCs.
Even though the majority of the drugs on the market that promote or inhibit specific biological processes are small molecules, the application of fluorescent small molecules in biomedical science has been restricted to the production of fluorescently labeled biomolecules and cell type-independent organelle staining dyes. By generating DOFL and screening them in different types of cells including NSC, we developed a NSC-specific fluorescent chemical compound CDr3. DOFL approach has many advantages for developing cell type specific imaging probes and identifying their binding targets. Our data presented here successfully exemplifies the practical use of DOFL in the development of cell type specific small molecular weight imaging probes and identification of their cellular binding targets. As the first NSC-specific fluorescent chemical compound that binds specifically to an intracellular NSC marker FABP7, CDr3 will be a valuable tool in the study and applications of NSCs.
Materials and Methods
DOFL High Throughput/Content Screening.
DOFL compounds were diluted from 1 mM DMSO stock solutions with the culture medium to make final concentration of 0.5 µM or 1.0 µM. The four different types of cells plated side by side on 384-well plates were incubated with the compounds overnight at 37 °C. The nuclei were stained with either Hoechst33342 or DRAQ5 the next day before image acquisition. The fluorescence cell images of two regions per well were acquired using ImageXpress Micro™ cellular imaging system (Molecular Device) with 10× objective lens and the intensity was analyzed by MetaXpress® image processing software (Molecular Device). The hit compounds which stained NS5 more brightly than other cells were selected based on the intensity data and manual screening of the raw images.
Characterization of CDr3.
The quantum yield was calculated by measuring the integrated emission area of the fluorescent spectra, and referring them to the area measured for Rhodamine B in ethanol after excitation at 530 nm (Φrho-B = 0.70). The quantum yield was then calculated using an equation below, where F represents the area of fluorescent emission, n is reflective index of the solvent, and Abs is absorbance at excitation wavelength selected for standards and samples:
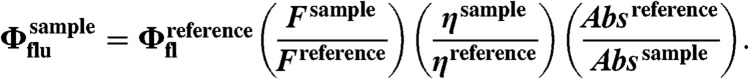 |
1H and 13C NMR Spectra on CDr3.
1H NMR (300 MHz, CDCl3): 2.28 (s, 3H), 2.96 (t, J = 7.5 Hz, 2H), 3.40 (t, J = 7.5 Hz, 2H), 3.92 (s, 3H), 3.97 (s, 3H), 4.78 (s, 2H), 6.30 (d, J = 3.9 Hz, 1H), 6.71 (s, 1H), 6.85 (d, J = 3.9 Hz, 1H), 6.86 (d, J = 8.1 Hz, 1H), 7.03 (s, 1H), 7.12 (d, J = 1.8 Hz, 1H), 7.16 (d, J = 1.8, 8.4 Hz, 1H), 7.29 (d, J = 16.2 Hz, 1H), 7.48 (d, J = 16.2 Hz, 1H).
13C NMR (75.5 MHz, CDCl3): 11.3, 23.7, 29.6, 33.0, 55.9, 56.0, 56.1, 74.0, 94.9, 109.6, 110.4, 111.1, 116.2, 116.6, 121.6, 122.1, 122.2, 126.7, 129.2, 133.6, 139.1, 143.0, 149.3, 150.8, 171.0.
ESI-MS m/z(C25H24BCl3F2N2O4) calculated: 571.1 (M+H)+, found: 551.1 (M-F).
Living Cell Staining.
The cells were incubated with 0.5 µM CDr3 in Opti-MEM GlutaMAXTM for 1 h and, if necessary, subsequently with 2 µM of Hoechst 33342 for 15 min at 37 °C. Then the cells were rinsed in maintenance medium for 1 h and the medium was replaced again with fresh medium before image acquisition. The bright field and fluorescence images were acquired on ECLIPSE Ti microscope or A1R confocal microscope using NIS Elements 3.10 software (Nikon Instruments Inc.) or on Axio Observer D1 using AxioVision v 4.8 software (Carl Zeiss Inc.).
MALDI-TOF/TOF MS and MS/MS Analyses.
Tryptic peptide of 0.6 μl was spotted onto Prespotted AnchorChip target plate (Bruker Daltonics Inc.) according to manufacturer’s protocol. The peptide mass fingerprint and selected peptide MS/MS fragment ion analysis were carried out on UltraFlex III TOF-TOF (Bruker Daltonics Inc.) with the compass 1.2 software package including FlexControl 3.0 and FlexAnalysis 3.0 with PAC peptide calibration standards. The peak lists of MS and MS/MS were submitted to in-house Mascot server (http://phenyx.bii.a-star.edu.sg/search_form_select.html) through BioTools 3.2 with the database of SwissProt 57.8 (509,019 sequences) allowing peptide mass tolerance of 100 ppm and 0.5 Da with maximum one missed cleavage and considering variable modifications of carbamidomethyl at cysteine (C) and Oxidation at methionine (M).
Supplementary Material
ACKNOWLEDGMENTS.
We thank Siti Hajar and Chew Yan Tuang for excellent technical support in cell culture and screening, Rory Johnson for kind help in culturing E14 and NS5 cell lines and Clement Khaw (SBIC-Nikon Imaging Centre) for confocal microscopy. This study was supported by an intramural funding from A*STAR (Agency for Science, Technology and Research, Singapore) Biomedical Research Council and a Singapore Ministry of Education Academic Research Fund Tier 2 (MOE2010-T2-1-025).
Footnotes
Conflict of interest statement: S.-W.Y, D.Z., and Y.-T.C. are the inventors of CDr3 for which a patent has been applied.
This article is a PNAS Direct Submission. B.F.C. is a guest editor invited by the Editorial Board.
This article contains supporting information online at www.pnas.org/lookup/suppl/doi:10.1073/pnas.1200817109/-/DCSupplemental.
References
- 1.Falk S, Sommer L. Stage- and area-specific control of stem cells in the developing nervous system. Curr Opin Genet Dev. 2009;19:454–460. doi: 10.1016/j.gde.2009.08.002. [DOI] [PubMed] [Google Scholar]
- 2.Kaneko N, Sawamoto K. Adult neurogenesis and its alteration under pathological conditions. Neurosci Res. 2009;63:155–164. doi: 10.1016/j.neures.2008.12.001. [DOI] [PubMed] [Google Scholar]
- 3.Lindvall O, Kokaia Z. Stem cells for the treatment of neurological disorders. Nature. 2006;441:1094–1096. doi: 10.1038/nature04960. [DOI] [PubMed] [Google Scholar]
- 4.Schule B, Pera RA, Langston JW. Can cellular models revolutionize drug discovery in Parkinson’s disease? Biochim Biophys Acta. 2009;1792:1043–1051. doi: 10.1016/j.bbadis.2009.08.014. [DOI] [PubMed] [Google Scholar]
- 5.Im CN, et al. A fluorescent rosamine compound selectively stains pluripotent stem cells. Angew Chem Int Ed Engl. 2010;49:7497–7500. doi: 10.1002/anie.201002463. [DOI] [PubMed] [Google Scholar]
- 6.Kang NY, Yun SW, Ha HH, Park SJ, Chang YT. Embryonic and induced pluripotent stem cell staining and sorting with the live-cell fluorescence imaging probe CDy1. Nat Protoc. 2011;6:1044–1052. doi: 10.1038/nprot.2011.350. [DOI] [PubMed] [Google Scholar]
- 7.Kim YK, et al. The binding of fluorophores to proteins depends on the cellular environment. Angew Chem Int Ed Engl. 2011;50:2761–2763. doi: 10.1002/anie.201007626. [DOI] [PMC free article] [PubMed] [Google Scholar]
- 8.Conti L, et al. Niche-independent symmetrical self-renewal of a mammalian tissue stem cell. PLoS Biol. 2005;3(9):1594–1606. doi: 10.1371/journal.pbio.0030283. [DOI] [PMC free article] [PubMed] [Google Scholar]
- 9.Donato R, et al. Differential development of neuronal physiological responsiveness in two human neural stem cell lines. BMC Neurosci. 2007;8:36. doi: 10.1186/1471-2202-8-36. [DOI] [PMC free article] [PubMed] [Google Scholar]
- 10.Liour SS, Yu RK. Differentiation of radial glia-like cells from embryonic stem cells. Glia. 2003;42:109–117. doi: 10.1002/glia.10202. [DOI] [PubMed] [Google Scholar]
- 11.Bibel M, et al. Differentiation of mouse embryonic stem cells into a defined neuronal lineage. Nat Neurosci. 2004;7:1003–1009. doi: 10.1038/nn1301. [DOI] [PubMed] [Google Scholar]
- 12.Storch J, Corsico B. The emerging functions and mechanisms of mammalian fatty acid-binding proteins. Annu Rev Nut. 2008;28:73–95. doi: 10.1146/annurev.nutr.27.061406.093710. [DOI] [PubMed] [Google Scholar]
- 13.Shimizu F, Watanabe TK, Shinomiya H, Nakamura Y, Fujiwara T. Isolation and expression of a cDNA for human brain fatty acid-binding protein (B-FABP) Biochim Biophys Acta. 1997;1354:24–28. doi: 10.1016/s0167-4781(97)00115-2. [DOI] [PubMed] [Google Scholar]
- 14.Feng L, Hatten ME, Heintz N. Brain lipid-binding protein (BLBP): A novel signaling system in the developing mammalian CNS. Neuron. 1994;12:895–908. doi: 10.1016/0896-6273(94)90341-7. [DOI] [PubMed] [Google Scholar]
- 15.Arai Y, et al. Role of Fabp7, a downstream gene of Pax6, in the maintenance of neuroepithelial cells during early embryonic development of the rat cortex. J Neurosci. 2005;25:9752–9761. doi: 10.1523/JNEUROSCI.2512-05.2005. [DOI] [PMC free article] [PubMed] [Google Scholar]
- 16.Owada Y, et al. Altered emotional behavioral responses in mice lacking brain-type fatty acid-binding protein gene. Eur J Neurosci. 2006;24(1):175–187. doi: 10.1111/j.1460-9568.2006.04855.x. [DOI] [PubMed] [Google Scholar]
- 17.Watanabe A, et al. Fabp7 maps to a quantitative trait locus for a schizophrenia endophenotype. PLoS Biol. 2007;5:2469–2483. doi: 10.1371/journal.pbio.0050297. [DOI] [PMC free article] [PubMed] [Google Scholar]
- 18.Gotz M, Huttner WB. The cell biology of neurogenesis. Nat Rev Mol Cell Biol. 2005;6:777–788. doi: 10.1038/nrm1739. [DOI] [PubMed] [Google Scholar]
- 19.Malatesta P, Hartfuss E, Gotz M. Isolation of radial glial cells by fluorescent-activated cell sorting reveals a neuronal lineage. Development. 2000;127:5253–5263. doi: 10.1242/dev.127.24.5253. [DOI] [PubMed] [Google Scholar]
- 20.Merkle FT, Tramontin AD, Garcia-Verdugo JM, Alvarez-Buylla A. Radial glia give rise to adult neural stem cells in the subventricular zone. Proc Natl Acad Sci USA. 2004;101:17528–17532. doi: 10.1073/pnas.0407893101. [DOI] [PMC free article] [PubMed] [Google Scholar]
- 21.Pankratz MT, et al. Directed neural differentiation of human embryonic stem cells via an obligated primitive anterior stage. Stem Cells. 2007;25:1511–1520. doi: 10.1634/stemcells.2006-0707. [DOI] [PMC free article] [PubMed] [Google Scholar]
- 22.Liour SS, et al. Further characterization of embryonic stem cell-derived radial glial cells. Glia. 2006;53:43–56. doi: 10.1002/glia.20257. [DOI] [PubMed] [Google Scholar]
- 23.Nat R, et al. Neurogenic neuroepithelial and radial glial cells generated from six human embryonic stem cell lines in serum-free suspension and adherent cultures. Glia. 2007;55:385–399. doi: 10.1002/glia.20463. [DOI] [PubMed] [Google Scholar]
Associated Data
This section collects any data citations, data availability statements, or supplementary materials included in this article.