

Abstract
The clinical outcome of Plasmodium falciparum infections ranges from asymptomatic parasitemia to severe malaria syndromes associated with high mortality. The virulence of P. falciparum infections is associated with the type of P. falciparum erythrocyte membrane protein 1 (PfEMP1) expressed on the surface of infected erythrocytes to anchor these to the vascular lining. Although var2csa, the var gene encoding the PfEMP1 associated with placental malaria, was discovered in 2003, the identification of the var/PfEMP1 variants associated with severe malaria in children has remained elusive. To identify var/PfEMP1 variants associated with severe disease outcome, we compared var transcript levels in parasites from 88 children with severe malaria and 40 children admitted to the hospital with uncomplicated malaria. Transcript analysis was performed by RT-quantitative PCR using a set of 42 primer pairs amplifying var subtype-specific loci covering most var/PfEMP1 subtypes. In addition, we characterized the near-full-length sequence of the most prominently expressed var genes in three patients diagnosed with severe anemia and/or cerebral malaria. The combined analysis showed that severe malaria syndromes, including severe anemia and cerebral malaria, are associated with high transcript levels of PfEMP1 domain cassette 8-encoding var genes. Transcript levels of group A var genes, including genes encoding domain cassette 13, were also significantly higher in patients with severe syndromes compared with those with uncomplicated malaria. This study specifies the var/PfEMP1 types expressed in severe malaria in children, and thereby provides unique targets for future efforts to prevent and treat severe malaria infections.
Among the more than 200 million individuals who were diagnosed with Plasmodium falciparum malaria infections in 2009, about 800,000 died (1) and more than 8 million had severe and complicated infections. The virulence of P. falciparum is associated with expression of proteins on the infected erythrocyte surface that anchors these cells to the vascular endothelium (2). Proteins of the P. falciparum erythrocyte membrane protein 1 (PfEMP1) (3–5) family mediate this adhesion through specific binding to host receptors, such as ICAM1 (CD54), CD36, VCAM (CD106), ELAM-1 (CD62), CD31, and CSA, as reviewed by Rowe et al. (6). The var genes encode the PfEMP1 family, and each parasite genome contains ∼60 diverse var genes (3, 7). As a result of an evolutionary arms race between the parasite and the human immune system, tremendous variation has evolved in the var genes. However, immunoepidemiological data have shown that severe malaria is associated with a serologically more conserved subset of PfEMP1 (8, 9). Previous (10) and recently conducted in vitro studies presented in the two accompanying papers (11, 12) support the hypothesis that the PfEMP1 subset associated with severe malaria confers a growth advantage to the parasites expressing these PfEMP1 variants as a result of these variants’ superior ability to bind to endothelial receptors.
PfEMP1 proteins are large (250–350 kDa), complex molecules composed of two to nine Duffy binding-like (DBL) or cysteine-rich interdomain region (CIDR) domains, each of 300–650 amino acids. Based on sequence similarity analysis across the seven known P. falciparum var genomes, CIDR and DBL domains can be subclassified into the main subclasses DBLα-ζ and CIDRα-δ, and these can be further divided into 147 subtypes (13). In addition, DBL and CIDR can be characterized on the basis of their composition of 628 semiconserved homology blocks and conserved cysteines. DBL domains appear to maintain a characteristic fold (14–17) despite the fact that the overall amino acid similarity is only about 30%. PfEMP1 can be classified into groups A, B, and C according to the upstream promoter region of the encoding gene (18, 19). Group B can be subdivided into B, having the most frequent domain structure of DBLα-CIDRα-DBLδ-CIDR, and B/A, having a more complex domain structure, which is characteristic for group A. Finally, a set of 23 conserved domain cassettes (DCs) has been identified in PfEMP1 (13). The most prominent of these are var1 (DC1) (20), var2csa (DC2) (21), and var3 (DC3) (22), which are found in all P. falciparum genomes and where the encoded domain structure spans the entire length of the protein. The remaining DCs encode two to four domains and are found unlinked to each other at the N- or C-terminal end of the molecules (13).
The pathogenicity of P. falciparum is associated with PfEMP1 that is dominantly expressed by the infecting parasites. Placental infection, a major cause of morbidity and mortality among pregnant women and their offspring, is caused by parasites expressing the conserved VAR2CSA PfEMP1 variant, which mediates binding to CSA in the placenta ( 21, 23–27). With the exception of placental malaria, immunity to severe noncerebral malaria is obtained after one or a few P. falciparum infections (28), and this has raised hope that severe malaria is precipitated by parasites expressing a limited PfEMP1 set that induces cross-reacting protective antibodies. If these PfEMP1 types were identified, it might be feasible to produce a vaccine that would protect children against the most virulent malaria infections. During the past 10 years, much effort has gone into defining the PfEMP1 molecules associated with severe infections. However, the tools applied so far have been restricted to distinguish between PfEMP1 groups A, B, and C and var1–var3. Conflicting evidence has been presented (29–38), but consensus suggests that members of group A and B PfEMP1 are associated with virulence. The group A to C classification does not reflect the structure of PfEMP1 diversity, and a more precise description of the protein variants expressed in malaria disease and what they have in common has been lacking.
Based on a previously published analysis of the global var gene repertoire (13), 42 primer pairs targeting specific CIDR and DBL subtypes were developed for quantitative PCR (qPCR). These primers were used to compare var gene transcript levels in children with malaria syndromes that carry high mortality and children sufficiently sick to be hospitalized. The evidence presented shows that children with severe syndromes were infected with parasites expressing high levels of var genes encoding PfEMP1 containing DC8 or DC13. Data showing that these PfEMP1 types share similar traits and that children in endemic areas acquire antibodies to recombinant DC8 domains early in life are also presented.
Results
Clinical Characteristics and Grouping of the Patients with Malaria.
Patients who had malaria were recruited at the pediatric ward of Korogwe District Hospital, Tanzania. Children admitted to the ward had undergone triage at the outpatient clinic and were judged to be too ill to be treated outside the hospital. After admission, the children were examined and grouped according to clinical syndrome. The patient samples investigated as part of this study were selected retrospectively to reflect groups of children having symptoms and signs previously associated with high mortality ( 39, 40); these included severe anemia, cerebral malaria, respiratory distress, and hyperparasitemia. Forty patients who did not fulfill any of these criteria served as controls. Table 1 shows the clinical characteristics of the children; apart from defining criteria, these did not differ significantly between the groups. As expected, children with cerebral malaria and/or respiratory distress had the highest mortality. Some children had overlapping clinical syndromes (e.g., both severe anemia and cerebral malaria). The clinical characteristics of children grouped to avoid overlapping syndromes or using alternative definitions of severe disease (e.g., prostration), as well as those of children diagnosed and treated at village clinics, are shown in SI Appendix, Table S1.
Table 1.
Clinical characteristics of the patients with malaria
| Patient characteristic | Uncomplicated hospital infections* (n = 40) | Severe anemia, Hb < 5 g/dL (n = 47) | Cerebral malaria (Blantyre coma score <3) (n = 30) | Respiratory distress (n = 18) | Hyperparasitemia (>200,000 per μL) (n = 18) | Died (n = 9) |
| Age: mean ± SD, y | 2.3 ± 1.1 | 2.0 ± 0.9 | 2.7 ± 1.3 | 1.6 ± 0.9 | 2.9 ± 1.3 | 2.5 ± 1.3 |
| Minimum/maximum | 0.51–5.0 | 0.58–4.0 | 0.62–4.9 | 0.61–3.5 | 0.51–4.9 | 0.79–4.8 |
| Females, % | 50.6 | 46.8 | 40.0 | 50.0 | 38.9 | 55.6 |
| Parasitemia median, p/μL | 36,085 | 13,790 | 41,930 | 28,315 | 248,000 | 41,930 |
| Percentiles 25 and 75 | 16,275–70,770 | 1,505–72,205 | 5,110–135,415 | 7,580–93,100 | 214,400–313,600 | 24,230–69,510 |
| Temperature median, °C | 38.5 | 38.1 | 38.3 | 38.1 | 39.0 | 38.4 |
| Percentiles 25 and 75 | 38.0–39.7 | 37.4–38.8 | 37.7–39.2 | 37.5–39.1 | 38.1–39.4 | 37.5–38.5 |
| Hemoglobin: mean ± SD, g/dL | 7.6 ± 1.7 | 3.9 ± 0.7 | 6.5 ± 1.9 | 5.4 ± 2.3 | 7.4 ± 2.4 | 6.5 ± 1.7 |
| Minimum/maximum | 5.1–11.8 | 1.7–4.9 | 3.4–10.5 | 1.7–10.0 | 3.4–11.9 | 4.8–9.5 |
| Mean coma score | 4.9 | 4.4 | 1.3 | 2.8 | 5 | 2.1 |
| Percentiles 25 and 75 | 5–5 | 5–5 | 0–2 | 1–5 | 3–5 | 1–3 |
| Minimum/maximum | 3–5 | 0–5 | 0–2 | 0–5 | 2–5 | 0–5 |
| P-lactate: mean ± SD, mM | 3.8 ± 1.6 | 4.4 ± 2.5 | 4.9 ± 3.9 | 6.9 ± 4.6 | 5.1 ± 1.9 | 5.7 ± 4.4 |
| Mortality, % | 0 | 2.1 | 20.0 | 28.0 | 5.6† | 100 |
*Patients requiring admission to Korogwe District Hospital without fulfilling any of the criteria for classification as complicated malaria.
†The patient who died with hyperparasitemia did not have any other symptoms of severe malaria (Blantyre coma score = 5, hemoglobin level = 8.5 g/dL, no symptoms of respiratory distress, plasma lactate = 4.1 mmol/L).
Design and Validation of Primers.
Var genes contain polymorphic sequences coding DBL and CIDR domains, and these domains can be subdivided into 147 subclasses based on sequence similarity analysis (13). Some var genes encode DCs, where the presence of a particular semiconserved sequence in one part of the gene is predictive for the presence of other semiconserved sequences in regions of the gene encoding other domains. Based on analyses of the var gene repertoire of seven genomes, 42 degenerate primer pairs were designed to target semiconserved var sequences specific for domain subclasses or DCs. The primers were designed to optimize specificity (not annealing to sequences other than their intended target) and coverage (annealing to as many sequences characteristic for the intended target as possible), as well as to secure broad coverage of the global var gene diversity. Primer performance was established by sequencing PCR products from reference genomes 3D7, HB3, or FCR3 and by comparing these results with in silico predicted performance on the seven known genomes. An overview of primer set performance and coverage of global diversity is presented in SI Appendix, Figs. S1 and S2. In summary, 85 domain subtypes (58%) were targeted by the primers directly or indirectly through DC association. Because each var gene typically encodes four to six domains and many domain subtypes are infrequently encoded, 87% of all var genes in the seven sequenced genomes were predicted to be targeted by at least one of the primer sets.
Abundance of var Transcripts in Parasites from Different Patient Groups.
The abundance of different var gene transcripts was measured relative to the transcript levels of two control genes, and delta cycle threshold (ΔCt) values were converted to arbitrary transcript units (Tus), where a value of 32 corresponded to the mean transcript level of the control genes. The results of the var gene transcript analyses are shown in Table 2 and SI Appendix, Table S2. The most striking observation was that primers targeting DC8 consistently measured a substantially higher transcript level in children with severe and complicated malaria than in those with uncomplicated malaria. This increase was highly statistically significant and was seen in patients with severe anemia, cerebral malaria, and respiratory distress (Table 2), but it was less pronounced in patients with cerebral malaria with a hemoglobin level >8 g/dL (SI Appendix, Table S2).
Table 2.
Transcript levels of var subtype in children hospitalized with malaria
| Primer domain subclass | DC | Group | Uncomplicated (95% confidence interval) (n = 40) | Severe anemia (95% confidence interval) (n = 46) | P | Cerebral malaria (95% confidence interval) (n = 30) | P | Respiratory distress (95% confidence interval) (n = 18) | P | Died (95% confidence interval) (n = 9) | P |
| DBLa1.1 | DC1 | A | 1 (1–1.5) | 1 (1–2.4) | 0.3874 | 1.4 (1–2.8) | 0.0898 | 1 (1–2.9) | 0.3919 | 1.1 (1–2.4) | 0.6591 |
| var2csa | DC2 | E | 4.7 (1.8–8.2) | 2.3 (1.4–3.5) | 0.2283 | 3.4 (1–9) | 0.5275 | 1.7 (1–3.6) | 0.0995 | 1 (1–5.1) | 0.0727 |
| DBLe8 | DC3 | A | 1 (1–1) | 1 (1–1) | 0.1096 | 1 (1–1) | 0.2845 | 1 (1–1.3) | 0.2797 | 1 (1–2.7) | 0.2676 |
| DBLb7 and 9 | DC5 | A | 1 (1–1) | 1 (1–1) | 0.4809 | 1 (1–1) | 0.8315 | 1 (1–1) | 0.6646 | 1 (1–1) | 0.4681 |
| DBLg | DC5 | A | 1 (1–1) | 1 (1–1) | 0.2589 | 1 (1 1.4) | 0.0407 | 1 (1–1.3) | 0.3994 | 1 (1–1) | 0.6883 |
| DBLz5 | DC6 | B(A/C) | 1 (1–1.6) | 1 (1–1.4) | 0.9075 | 1.1 (1–6.1) | 0.1119 | 3.3 (1–6.5) | 0.1598 | 1 (1–7.8) | 0.9769 |
| DBLg | DC6 | B(A/C) | 1 (1–1.2) | 1 (1–2.3) | 0.4387 | 1.1 (1–3.5) | 0.1028 | 1.3 (1–3.4) | 0.2215 | 1 (1–4.4) | 0.9032 |
| DBLe2 | DC7 | B(C) | 1 (1–1) | 1 (1–1) | 0.8644 | 1 (1–1) | 0.1724 | 1 (1–1) | 0.0944 | 1 (1–1.4) | 0.9016 |
| DBLe3 | DC7 | B(A/C) | 1 (1–1) | 1 (1–1) | 0.8262 | 1 (1–1) | 0.7886 | 1 (1–1) | 0.5608 | 1 (1–2.3) | 0.9577 |
| DBLa_CIDRa | DC8 | B | 1 (1–1.1) | 3.5 (1–7.5) | 0.0003 | 2.8 (1–6.5) | 0.0069 | 4.4 (1–8.3) | 0.0087 | 1 (1–3.4) | 0.6422 |
| DBLg4/6 | DC8 | B | 1 (1–1.7) | 5 (1.3–10.3) | 0.0021 | 2.4 (1–10.7) | 0.0079 | 3.1 (1.2–14.2) | 0.0062 | 1.1 (1–8.3) | 0.5571 |
| CIDRa1.1 | DC8 | B | 1.1 (1–3.2) | 18.2 (7.8–29.4) | 0.0002 | 16.7 (7.6–30) | 0.0003 | 7.6 (2.3–31.6) | 0.0107 | 1.6 (1–31.4) | 0.6601 |
| DBLb12 and DBLb3/5 | DC8 | B/A | 7.3 (1.1–13.2) | 28 (15.7–35.2) | 0.0004 | 23.3 (3.4–54.2) | 0.0428 | 12.8 (1.2–46) | 0.2772 | 17.7 (1–56.6) | 0.3291 |
| DBLz4 | DC9 | B | 1.6 (1–4.1) | 1 (1–1.2) | 0.0214 | 1 (1–2) | 0.1344 | 1 (1–2.5) | 0.0374 | 1 (1–5.9) | 0.4616 |
| DBLg of DC9 | DC9 | B | 1 (1–1.2) | 1 (1–1) | 0.0031 | 1 (1–1) | 0.1052 | 1 (1–1) | 0.2343 | 1 (1–1) | 0.1007 |
| DBLz6 | DC10 | B | 1 (1–1) | 1 (1–1) | 0.8865 | 1 (1–1) | 0.7469 | 1 (1–1) | 0.3817 | 1 (1–1) | 0.3963 |
| DBLe12 | DC12 | B/A | 1 (1–1) | 1 (1–1) | 0.6136 | 1 (1–1) | 0.1865 | 1 (1–1) | 0.2198 | 1 (1–1) | 0.0519 |
| DBLa1.7 | DC13 | A | 1.2 (1–3) | 1.7 (1–9.8) | 0.3222 | 2 (1–31.7) | 0.1755 | 3.6 (1–11.5) | 0.4169 | 1 (1–35.2) | 0.7604 |
| CIDRa1.4 | DC13 | A | 1 (1–1) | 1 (1–1) | 0.0018 | 1 (1–1.4) | 0.0006 | 1 (1–1.4) | 0.004 | 1 (1–2.8) | 0.0028 |
| DBLa1.5/6a | DC16 | A | 1.1 (1–2.4) | 1.5 (1–2.8) | 0.7357 | 1 (1–3.1) | 0.9593 | 1 (1–1.5) | 0.1908 | 1 (1–1.6) | 0.1702 |
| DBLa1.5/6b | DC16 | A | 3 (1–5.7) | 3.3 (1–5.5) | 0.8023 | 3.8 (1–15.8) | 0.5628 | 1 (1–3.8) | 0.1032 | 2.8 (1–4.8) | 0.4994 |
| CIDRd | DC16 | A | 1 (1–1.7) | 1.1 (1–3.1) | 0.2562 | 1.7 (1–8.9) | 0.1719 | 1 (1–4.6) | 0.8828 | 1 (1–2.5) | 0.5288 |
| DBLa0.16 | DC19 | B | 1 (1–1.5) | 1.5 (1–2.5) | 0.2349 | 2.2 (1.1–4.2) | 0.0177 | 1.8 (1.1–6) | 0.0382 | 3.4 (1–5.2) | 0.0476 |
| CIDRa3.4 | DC19 | B/C | 3.2 (1.6–4.8) | 1.8 (1.1–3) | 0.3911 | 4.8 (2;9.9) | 0.2623 | 4.2 (1.4–9.8) | 0.4346 | 2 (1–9) | 0.6382 |
| DBLa0.9 | DC20 | B | 1.1 (1–2.2) | 1 (1–2) | 0.9123 | 1 (1–1.8) | 0.5804 | 1 (1–1.7) | 0.3109 | 1 (1–5.9) | 0.5756 |
| DBLa2/a1.1/2/4/7 | A | 18.9 (5.5–26.3) | 58.4 (33.2–77.1) | 0.0002 | 51.1 (23.6–101.3) | 0.0041 | 32.7 (12.2–71.9) | 0.0878 | 32.7 (1.8–79.2) | 0.5099 | |
| DBLa1.4 | A | 1 (1–1) | 1 (1–1) | 0.3681 | 1 (1–1.7) | 0.063 | 1 (1–1.2) | 0.4465 | 1 (1–1) | 0.4676 | |
| CIDRa1.6 | A | 1 (1–1) | 1 (1–1) | 0.6835 | 1 (1–1) | 0.0246 | 1 (1–1) | 0.1087 | 1 (1–27.4) | 0.0208 | |
| CIDRa1.7 | A | 1 (1–1.6) | 1 (1–3.4) | 0.5877 | 1 (1–3.5) | 0.816 | 1 (1–5.2) | 0.8758 | 1 (1–1) | 0.1141 | |
| CIDRa1.4 and CIDRa1 | A | 1 (1–1.3) | 1.8 (1–4.5) | 0.0958 | 1.9 (1–10.3) | 0.1199 | 1 (1–5.4) | 0.6552 | 1 (1–4.2) | 0.6848 | |
| DBLa0.6/9 | B | 1 (1–3.5) | 1.5 (1–3.2) | 0.9531 | 1.8 (1–2.5) | 0.9547 | 1.1 (1–2.3) | 0.5204 | 1 (1–4.7) | 0.5661 | |
| DBLb3 | A | 1 (1–3.1) | 2.8 (1.2–10) | 0.0436 | 7.9 (1–16.8) | 0.0287 | 4.5 (1–20) | 0.1353 | 2.6 (1–9.1) | 0.3779 | |
| DBLa1 not var3 | A | 13.3 (5.1–21.9) | 43.6 (33.4–63.8) | 0 | 65.1 (38.9–86) | 0.0001 | 32 (17.9–85.3) | 0.0218 | 18.4 (4–102.2) | 0.2642 | |
| DBLg9 | A/B/C | 1 (1–1) | 1 (1–1) | 0.7118 | 1 (1–1) | 0.9254 | 1 (1–1) | 0.915 | 1 (1–2.7) | 0.2514 | |
| CIDRg1/2 | B | 1 (1–1) | 1 (1–1) | 0.8551 | 1 (1–1) | 0.2704 | 1 (1–1) | 0.5608 | 1 (1–1) | 0.399 | |
| DBLa0.1 | B | 1 (1–1) | 1 (1–1) | 0.4224 | 1 (1–1) | 0.766 | 1 (1–1) | 0.3994 | 1 (1–1) | 0.4445 | |
| CIDRa2.2 | B | 1 (1–1) | 1 (1–1.4) | 0.2735 | 1 (1–1.6) | 0.4951 | 1 (1–2) | 0.9334 | 1 (1–2.7) | 0.7956 | |
| CIDRa2.3/5/6/7/9/10 | B | 3.6 (2.4–5.3) | 4.1 (2.4–8.9) | 0.6405 | 3.7 (1–8.5) | 0.4786 | 7.2 (1.9–14.1) | 0.3526 | 3.4 (1–13.4) | 0.6211 | |
| CIDRg2/9 | B | 1 (1–1) | 1 (1–1) | 0.5543 | 1 (1–1) | 0.9215 | 1 (1–1) | 0.8187 | 1 (1–2.5) | 0.7096 | |
| DBLb5 | B(A/C) | 1 (1–1) | 1 (1–2.6) | 0.0477 | 1 (1–1.1) | 0.3718 | 1.3 (1–4.3) | 0.0118 | 1.4 (1–3.2) | 0.0577 | |
| CIDRg | B/C | 9.7 (3.9–19.7) | 8.5 (6.7 16.7) | 0.6902 | 10 (5.7–18) | 0.7304 | 7.8 (4.4–22.8) | 0.873 | 5.4 (1.1–19.7) | 0.415 | |
| CIDRa3.1–3 | B/C | 1 (1–1) | 1 (1–1.6) | 0.0401 | 1.1 (1–2.4) | 0.0472 | 1.5 (1–2.7) | 0.0497 | 1.6 (1–7.3) | 0.1066 |
Transcript levels [median Tu level (95% confidence interval)] of var subtype in hospitalized patients with uncomplicated malaria; in patients diagnosed with severe anemia, cerebral malaria, or respiratory distress; or in patients who died from malaria. All P values are calculated by comparison of the severe syndrome group to the uncomplicated malaria patient group using the Wilcoxon rank sum test.
The general transcript level of group A var genes, as judged by primer “DBLa1 not var3” with broadest coverage of these genes, was also markedly and statistically significantly higher in those children with severe anemia or cerebral malaria than in the children with uncomplicated disease. The primer “DBLa2/a1.1/2/4/7,” which targets DBLα sequences in genes encoding DC8 and group A genes encoding DBLα1/2/4/7, showed a similar pattern. The primer “CIDRa1.4,” which targets genes coding DC13 (i.e., DBLα1.7-CIDRα1.4) also detected higher transcript levels in children with severe and complicated disease than in those with uncomplicated malaria (Table 2). Interestingly, the levels were highest in those with cerebral malaria with a hemoglobin level >8 g/dL (SI Appendix, Table S2). Despite the fact that the difference in Tu level between the groups was highly statistically significant, the median Tu values measured with primer CIDRa1.4 did not differ much between the groups. This reflects that most individuals in all groups had an immeasurable Tu level but that more parasites from individuals with severe disease had measurable responses than parasites from the patients with uncomplicated malaria. When Tu > 8 was used as the cutoff for high transcript level, the percentages (95% confidence interval) of parasites with high levels were 13.0% (4.9–26.3), 20.0 (7.7–38.6), and 2.5 (0.6–13.1) for severe anemia, cerebral malaria, and uncomplicated disease, respectively.
Transcripts targeted by primer “DBLb3” were also found at higher levels among patients with severe anemia and cerebral malaria than in the children with uncomplicated disease (Table 2). The P values for these differences were modest, but the findings were robust in the sense that children grouped as having severe malaria using several different criteria also showed statistically significantly higher levels of transcripts targeted by primer DBLb3 than the controls (SI Appendix, Table S2). The DBLβ3 domains targeted by primer DBLb3 have not been assigned to any DC but are found in group A genes (a graphic representation of group A N-terminal domain architectures is presented in Fig. 1). Thus, in silico analyses of 399 fully annotated var genes (13) predict the DBLb3 primer to target 5 of 10 var genes encoding a DC13 cassette and 8 of 14 var genes encoding CIDRα1.6/7. Other primers also reported higher transcript levels in patients with severe anemia or cerebral malaria, but the level of statistical significance was modest, and in any case, the median transcript levels in the patients with severe disease was low, indicating that transcript levels above the detection limit were found in only a few of the patients with severe disease. Transcript levels were not always higher in the children with severe or complicated disease. The transcript levels measured with two primers targeting DC9 were statistically significantly higher in those with uncomplicated disease than in those with severe anemia (Table 2) and in the group combining all children with complicated disease outcomes (SI Appendix, Table S2).
Fig. 1.
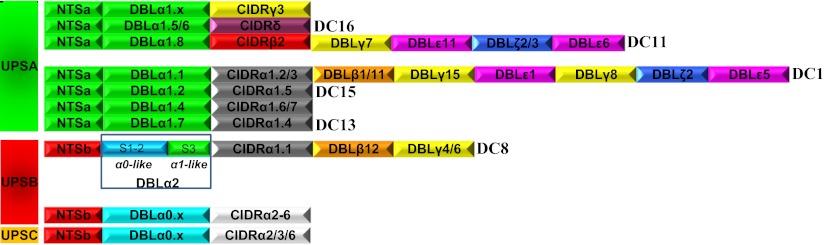
Comparison of DC8 and DC13 and other common PfEMP1 head structures. DBLα2 is a DBLα0/DBLα1 hybrid, and CIDRα1.1 belongs to the group A CIDRα1 subgroup.
Among the children who died, the transcript levels were generally lower than among those who survived but had severe disease. Compared with the children with uncomplicated disease, those who died had higher levels of transcripts targeted by primer CIDRa1.4 (P = 0.0028).
The transcript levels in parasites from children who were recruited and treated at village clinics were also measured. In these children, the transcript levels measured with the 42 primer pairs were generally low (SI Appendix, Table S2).
Thus, the RT-qPCR measurements strongly suggested that DC8 genes were transcribed predominantly in children with severe or complicated malaria. The experiments also indicated that certain group A genes were expressed at high levels among these children. These genes were less well defined but did include group A genes encoding DC13. Other group A signatures, such as DC16, were not associated with severe disease outcome.
Annotation of DC8 and DC13.
The results of the transcript analyses indicated that severe disease was associated with transcription of genes encoding DC8 and DC13. Amino acid sequence alignments of the DCs are shown in SI Appendix, Fig. S4. Fig. 1 compares the head structures of genes encoding these DCs with other PfEMP1 head structures. DC8-containing genes are characterized by having B type upstream promoter (UPSB), followed by sequences encoding NTSβ-DBLα2-CIDRα1.1-DBLβ12-DBLγ4 or NTSβ-DBLα2-CIDRα1.1-DBLβ12-DBLγ6. The DC8 DBLα was previously classified as α2 because it formed a separate cluster between α0 and α1 in DBLα maximum likelihood (ML) dendrograms (13). This study also identified a recombination hotspot in DBL domains located at the border between DNA coding DBL subdomains S2 and S3. Analysis of all known DBLα subdomains S1–S3 (SI Appendix, Fig. S3) shows that DBLα2 can be divided into two parts: S1–S2, which has sequence signatures typical of DBLα0 of group B and C genes, and S3, which is similar to the S3s of group A DBLα1 sequences (Fig. 1 and SI Appendix, Fig. S3). Interestingly, the CIDRα1.1 encoded in DC8 var genes belongs to a subgroup of CIDRα1 sequences, which, except for DC8, are reserved for group A PfEMP1. The DC8-encoded DBLβ12 and DBLγ4 are also found in group A genes, and, more specifically, DBLβ domains of group A and DC8 PfEMP1 share homology block 141 (13). Six of the seven fully sequenced and annotated P. falciparum genomes originating from different continents carry at least one DC8 var gene, and the combined evidence suggests that the DC8 was formed during evolution by recombination of a group A and group B gene, and that this gene has been maintained in the population.
The transcript analyses showed that high transcript levels of group A genes were associated with severe disease and identified DC13 genes as particularly important. DC13 encodes DBLα1.7-CIDRα1.4 and is found in five of the seven sequenced genomes. Group A var genes can be divided into two groups based on the subtype of their first CIDR domain (Fig. 1). One group encodes CIDRα1 (which can be subdivided into α1.1–α1.7), and another group encodes CIDRβ, CIDRγ, or CIDRδ (each of which also can be divided into subtypes). Our transcript analyses indicate that DC16-containing genes are not associated with severe disease, but the primer coverage of the group A head structures was incomplete and the possibility cannot be ruled out that some of the untargeted head structures (including DC11 and DC15) could be associated with severe disease.
Quantification of Full-Length var Transcripts in Patient Samples Using Second-Generation Sequencing.
An alternative method to quantify var gene transcription was developed and tested on parasites from three patients. Patients 1914 and 1983 had cerebral malaria with hemoglobin levels of 6.9 g/dL and 5.0 g/dL, respectively; patient 1965 had a hemoglobin level of 4.4 g/dL without cerebral symptoms (additional patient descriptive information is provided in Materials and Methods). Primers targeting conserved sequences in DBLα were used to PCR-amplify cDNA from the patients. The PCR amplicons were then directly deep-sequenced to identify and quantify transcription of the most abundant var transcripts. Specific primers targeting amplicon sequences were then designed and used together with a primer targeting conserved sequence in exon2 to PCR-amplify and sequence the major part of the transcript encoding the surface-exposed parts of the PfEMP1 molecule. Based on this sequence information, unique specific primers were designed for each annotated gene and used in RT-qPCR to quantify transcript levels. Thus, by this method, transcript levels are first assessed based on quantification of DBLα sequence tags and then more precisely with gene-specific qPCR primers (Fig. 2, Left, bar charts). By quantification based on sequence tags 4, 8, and 9, unique tag sequences contributed to more than 75% of the total number of DBLα reads in each patient, respectively. Based on these 21 unique sequence tags, sequence information on 15 unique var genes was obtained (Fig. 2, Left). The five DBLα tag sequences for which near-full-length sequence information could not be obtained were not among those transcribed at the highest levels by quantification based on DBLα tags. For the last DBLα tag, extended sequence information could not be obtained either but specific qPCR primers targeting the DBLα tag sequence could verify the transcription level of this gene. By comparing the two methods of quantification (Fig. 2, bar charts), it is clear that DBLα tag-based quantification is not always accurate; however, it generally gives a reasonable impression of which genes are highly transcribed.
Fig. 2.

Identification of full-length sequences of dominant var transcripts in one patient with cerebral malaria (1914), one patient with cerebral malaria and a hemoglobin level of 5 g/dL (1983), and one patient with severe anemia without cerebral symptoms (1965). Bar charts show proportions of specific DBLα tag reads relative to the total read number (gray bars/left y axes) and the transcript level (Tu) measured by RT-qPCR using primers specific for the targeted genes (white bars/right y axes). Colored panels show domain and DC annotation of full-length genes identified from the DBLα tag analysis. Gene numbers correspond to the DBLα tag numbers (bar charts, x axes). Domains marked by numbers were found by in silico analysis to be targeted by correspondingly numbered primers reporting high transcript levels, defined as Tu > 8 units (corresponds roughly to half the level of seryl-tRNA-synthetase). The high-abundance primers are listed below domain annotations according to Tu with the highest Tu (1 = highest Tu). Primers in bold are predicted to amplify sequences in the annotated full-length genes, and primers in italics are not.
In all three patients (1914, 1983, and 1965), several var genes were transcribed at high levels, but one or two of the genes seemed to dominate. In the patient with cerebral malaria (1914), the dominantly transcribed genes were a DC13-coding gene and a group A gene without a cassette annotation but carrying a DBLα1.4-CIDRα1.7 head structure. In the patient (1983) with cerebral malaria and a hemoglobin level of 5 g/dL, the dominant transcript encoded DC8 containing PfEMP1, and in the patient (1965) with severe anemia without cerebral involvement, two transcripts encoding DC8-containing PfEMP1 dominated. Interestingly, high levels of DC5-encoding transcripts were found in all patients.
Because RT-qPCR data presented in Table 2 and SI Appendix, Table S2 were also available for these three patients, it was possible to evaluate whether the primers used on the large panel of patients had typed the dominantly transcribed genes in the three patients studied in detail (Fig. 2). On the basis of the RT-qPCR data, parasites were defined as having high or low levels of DC8-, DC13-, and DC5-encoding transcripts based on the criteria described in Materials and Methods. According to these criteria, parasites from patient 1914 were DC8low, DC13low, and DC5high. Thus, this classification missed the high level of DC13-encoding transcripts, although evidence of high level group A transcripts was provided by the group A-specific primers. Parasites from patient 1983 were correctly classified as DC8high, DC13high, and DC5high. Parasites from patient 1965 were DC8high, DC13low, and DC5low; in this instance, the DC8 and DC13 classifications were correct but the DC5 transcript was missed. Thus, in these three patients, DC8 typing was correct but the RT-qPCR tended to miss DC13 and DC5 signals and the expression of these genes could be underestimated.
Proportion of Patient Samples with High DC8, DC13, and DC5 Transcript Levels.
The above results indicated that parasites causing severe malaria had higher transcript levels of var genes coding DC8 and DC13 than parasites from patients with uncomplicated disease. DC5 transcription might also be associated with severe malaria, because data from the three patients investigated in detail indicated that DC5 was transcribed in these patients and that primers targeting DC5 were not always able to measure DC5 transcripts. Finally, a significantly higher level of DC5 transcripts was measured with primer “DBLg of DC5” in parasites from patients with cerebral malaria than in those from patients with uncomplicated disease (Table 2), although the level of statistical significance was modest. To assess to which degree DC8-, DC13-, and DC5-coding genes were transcribed in individual patients, a cutoff for high var transcript level was defined. The cutoff was based on the level of var2csa transcripts in parasites from pregnant women. Fig. 3 shows Euler diagrams representing different patient groups, indicating the proportion of patient samples with high levels of transcripts coding DC8, DC13, and/or DC5. Eighty-one percent of the parasites from patients with severe and complicated malaria could be typed as having high expression of genes coding the DCs, and 70% of these patients had high levels of DC8 transcripts. Among the parasites from patients with uncomplicated disease or village infections, only 42% or 13% could be typed, respectively. A large proportion of the parasites from patients with severe anemia or cerebral malaria had high levels of DC8 transcripts. There was a tendency for a higher proportion of parasites from patients with cerebral malaria to have a higher proportion of transcription of DC5 than parasites from patients with severe anemia, but the difference did not reach statistical significance (P = 0.12, Fisher’s exact test).
Fig. 3.
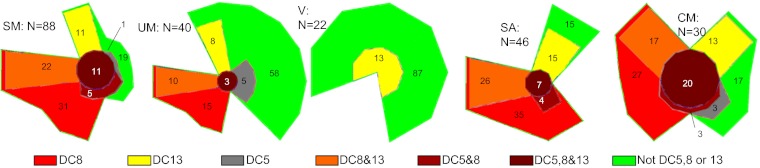
Color-coded, areal-proportional Euler diagrams showing the proportion (%) of patients transcribing high levels of genes encoding DC8, DC13, or DC5, or combinations thereof. The green areas show the percentage of patients in which parasites did not transcribe genes coding DC8, DC13, or DC5 at high levels. The five diagrams show patients with severe malaria (SM), uncomplicated malaria (UM), infections treated at village dispensaries (V), severe anemia (SA), and cerebral malaria (CM), respectively. The number of patients in each group (N) is shown. High transcription was defined as Tu > 8 units, which roughly corresponded to half the level of seryl-tRNA-synthetase transcripts.
Recombinant PfEMP1 Domains Belonging to DC8 Are Well Recognized by IgG in Plasma from Young Children.
It has previously been shown that children in malaria-endemic areas acquire antibodies to PfEMP1 domains in an ordered fashion and that antibodies to PfEMP1 belonging to group A are acquired before antibodies to group B and group C PfEMP1 (41). To test whether antibodies to recombinant proteins representing DC8 were acquired earlier than antibodies to other group B and group C molecules, we measured antibody levels to 99 different PfEMP1 domains in 543 young children from northeastern Tanzania (SI Appendix, Fig. S5). The seropositivity rate (number of children with antibodies/total number of children × 100) was calculated for each PfEMP1 domain, and the positivity rates were then compared between domains belonging to the different groups (group A domains, DC8 domains, and group B and group C domains). The mean prevalence of antibody positivity to recombinant proteins representing DC8 was 10.5%, significantly higher than the mean positivity rate of recombinant proteins representing other group B (5.1%; P = 0.013) and group C (4.5%; P = 0.028) domains and at the same level as the recognition of group A domains (Table 3). The mean recognition rate and 95% confidence interval of the nonvariant blood stage antigen GLURP was 11.2 (8.7–14.2), reflecting the dramatic reduction in malaria transmission that has taken place in northeastern Tanzania during the past 6 y (42). These results indicate that recombinant proteins representing DC8 with regard to serological recognition resemble group A domains and differ from other group B and group C domains. The results also imply that children are exposed to parasites expressing DC8 at an early age.
Table 3.
Group A and DC8 PfEMP1 antibody reactivity in Tanzanian children
| Domain type | No. of domains tested | Mean (%) recognition of domain type (95% confidence interval)* | P value (ANOVA, Bonferroni-corrected) |
| A | 50 | 8.4 (6.9–9.9) | P = 1 (A vs. DC8) |
| DC8 | 8 | 10.5 (7.7–13.3) | P = 0.002 (DC8 vs. B) |
| other B | 36 | 4.7 (3.0–6.4) | P = 0.019 (DC8 vs. C) |
| C | 5 | 4.8 (0.0–9.9) | P = 1 (B vs. C) |
Domains belonging to group A and DC8 PfEMP1s are more often recognized by IgG in children than domains belonging to group B or C. Plasma samples from 543 Tanzanian children aged 6 mo to 2–3 y were tested.
*Percentage of children responding was calculated for each domain. The mean recognition among the domains of the given type is shown here.
Discussion
The inability of the research field to identify and characterize the PfEMP1 types associated with parasite virulence during malaria infections in children has constituted a roadblock for PfEMP1 vaccine development for the past 25 years. It has been impossible to identify the protein on the surface of infected erythrocytes by protein chemistry because of difficulties in securing sufficient amounts of protein, and identification by transcription analyses has been impeded because of the extensive sequence diversity of the var genes. Early in vivo and in vitro studies suggested that severe malaria was associated with expression of PfEMP1s belonging to group A and group B/A (10, 43), and this notion has been confirmed by studies that have used RT-qPCR assays targeting groups A–C (29). Others studies have relied on semiquantitative RT-PCR to identify short sequence tags in DBLα, comparing their abundance in children with different clinical syndromes (30–34). The results of those studies are not completely similar, but they support the notion that severe infections are associated with parasites expressing PfEMP1 with DBLα sequences that are characteristic for group A PfEMP1. Neither of the above approaches has been able to identify larger PfEMP1 sequences characteristic for patients with severe malaria or to identify in which var gene context they appear.
For this study, we used two different approaches to measure var transcripts. The first builds on the recently published extensive analysis of the var gene repertoire in seven P. falciparum genomes (13), which allowed us to design 42 primer sets predicted to target the most prominent DCs and the most frequently encoded PfEMP1 domain subtypes. These primers were used in RT-qPCR assays to amplify parasite cDNA made from mRNA isolated directly from the peripheral blood of the malaria-infected children. This approach will obviously only detect transcripts targeted by the primers, and as a result of the use of degenerate primers on unknown parasite genes, the transcript level obtained with one primer set cannot be directly compared with the levels measured with another set of primers. Thus, caution should be used when comparing transcript levels measured with different primers. However, differences in transcript levels measured between parasites obtained from different patient groups represent a difference between the transcript phenotypes of the parasites infecting these patients. Primer performance was tested and found satisfactory after analyses of genomic DNA (gDNA) from cultures of parasites with a known var gene repertoire and in silico testing using var gene sequences of the seven parasites with a known var gene repertoire. To verify the results obtained with RT-qPCT, we typed var gene transcripts of parasites from three patients using another approach. This involved amplification and quantification of DBLα sequence tags and identifying the corresponding full-length sequence of highly expressed transcripts by sequencing large PCR products obtained using a 5′ primer unique to the identified sequence tag and a primer targeting the conserved exon2 located 3′ to the exon1 encoding the cytoadhesive domains of PfEMP1. This method is unable to detect ∼5–10% of the var genes. Thus, none of the methods are entirely optimal, and by both methods, single var genes transcribed at high levels could remain undetected. Nevertheless, the approaches applied here are superior to the methods used earlier to identify PfEMP1 expression in patients with severe malaria. Specifically, the strength of the RT-qPCR method is to reveal associations between transcript levels and disease group, whereas the advantage of the more tedious full-length var gene identification obviously is to reveal the exact sequence composition of expressed PfEMP1.
The majority of the investigated patients were young children admitted to Korogwe District Hospital. In our setting, admission to the hospital is reserved for children who are quite ill and none of these children could be classified as having mild malaria. Eighty-eight of the children were severely ill, having symptoms or signs associated with high mortality, whereas 40 children without qualifying symptoms or signs served as controls. The main and consistent finding of this study was the detection of high levels of DC8 transcripts in patients with severe malaria regardless of symptomology (Table 2 and SI Appendix, Table S2). The levels of DC8 transcripts were markedly and statistically significantly higher in patients with severe disease than in patients with uncomplicated malaria. As predicted by the RT-qPCR assays, parasites from two of the three patients tested by the alternative approach were also found to transcribe high levels of DC8-encoding var genes (Fig. 2). Furthermore, in a large proportion of the patients with severe disease, the DC8 transcript levels were at par with the var2csa transcript levels found in parasites from pregnant women, where VAR2CSA is expressed on the surface of more than 90% of the infected erythrocytes as judged by staining anti-VAR2CSA with specific antibody reagents (44). Genes encoding DC8 are prevalent in the parasite population and are present in six of the seven sequenced genomes. They are characterized by having a UPSB promoter and a run of four specific N-terminal domains (Fig. 3). Despite the fact that the domain architecture is conserved across parasite genomes, the DC8 domains are not identical but share between 45% and 63% similarity at the amino acid level.
The sequence analyses provided in Fig. 3 and SI Appendix, Fig. S3 indicate that the gene has arisen as a consequence of a recombination event between a group A and group B var gene, occurring in the DBLα-encoding part of the gene, and 3′ to this point, which constitutes most of the amino acid coding sequence, the gene can be said to be group A-like. The fact that var genes encoding DC8 are found in most parasites indicates that the genes are important for the parasite, and DC8 PfEMP1 may convey to the parasite the same cytoadhesive functions leading to severe malaria syndromes in other malaria-endemic regions. Additional studies are required to confirm this prediction. DC8 sequences show considerable amino acid polymorphism, indicating they are subject to antibody-mediated diversifying selection as shown for VAR2CSA (45). Antibodies to recombinant PfEMP1 domains representing DC8 were relatively prevalent among young children living in the Korogwe District (Table 3). This indicates that children are exposed to parasites expressing DC8 early in life. Further evidence that transcription of DC8-coding genes leads to expression of functional PfEMP1 on the surface of infected erythrocytes is provided in the accompanying papers by Claessens et al. (11) and Avril et al. (12) showing that parasites selected for binding to endothelial cells express DC8-containing PfEMP1.
The general level of group A transcripts, as measured by primers with a broad group A coverage, was also found at significantly higher levels in children with severe disease than in those with uncomplicated disease. The coverage of the RT-qPCR primer set was not able to dissect exactly which group A genes were involved in severe malaria. However, the primers CIDRa1.4 and DBLb3 targeting var group A subtypes encoding CIDRα1.4/6/7 (i.e., including DC13) detected high levels of transcripts in the parasites from children with severe malaria, whereas primers targeting DC16, the main subtype of group A genes not encoding CIDRα1, did not. Thus, DC13 appeared to be particularly important; however, when combined, the evidence suggests that there are other group A type genes characterized by carrying CIDRα1 domains that are also associated with development of severe malaria. The alternative transcript profiling approach (DBLα tag sequencing), unlikely to miss many or any particular type of A genes, indicated that genes containing DC13 and DC5 were highly expressed in the three patients analyzed. This suggests that DC5 transcript levels were underestimated by the RT-qPCR analyses of the larger group of patients.
A parasite is thought to express only one species of PfEMP1 on the surface of the infected erythrocytes (46), although this may not always be the case (47). However, in a population of parasites, many different PfEMP1s can be expressed at the same time (48), as was also found in the three patients investigated in detail. To assess to which degree genes coding for DCs associated with severity could be claimed to type the infections, the transcript levels of DC8, DC13, or DC5 were analyzed in individual patients. High transcript levels of these genes were found in by far the majority of the patients with severe disease, less than half of the patients with complicated malaria, and very few of the patients with mild malaria treated at village dispensaries (Fig. 3). This indicates that to a greater extent than those patients with severe malaria, the patients with uncomplicated or mild malaria were infected with parasites expressing PfEMP1s that were less likely to be targeted by the primers. Among patients with severe disease, parasites with high levels of DC8 or DC13 transcripts were prevalent, DC8 typed most infections, and high levels of DC5 transcripts seldom appeared alone. The transcript abundance pattern between parasites from patients with severe anemia and cerebral malaria was comparable, although there was a tendency (not statistically significant) for group A (DC13 and DC5) to be more prominent in cerebral malaria. Thus, it is still possible that some PfEMP1s mediate tissue-specific adhesion phenotypes, but the fact that the majority of children with severe infections had high levels of DC8 transcripts, regardless of symptomatology, indicates that binding of these parasites is not tissue-specific. The particular virulence of DC8-expressing parasites may thus stem from a particular efficient general endothelium binding capacity bestowing relatively high parasite survival rates, a notion supported by the observations made in accompanying papers by Claessens et al. (11) and Avril et al. (12) that DC8-expressing parasites are selected on endothelial cells of different tissue origin.
In conclusion, parasites transcribing var genes coding DC8 are present in a large proportion of children who have severe malaria. High levels of group A var transcripts were also associated with severe disease; among these, genes encoding DC13 were found to be important, but other group A genes might also be involved. VAR2CSA had previously been identified as the main virulence factor for placental malaria. The present data indicate that DC8-containing PfEMP1 constitutes a major virulence factor for severe malaria in children.
Materials and Methods
Patients with Malaria.
The study was conducted in Korogwe District, Tanzania. Korogwe is located in northeastern Tanzania about 100 km from the Indian Ocean. Korogwe District Hospital is located in the western Usambara Mountains, and the altitude of the catchment area varies from 300 to 1,700 meters above sea level (49). Malaria endemicity varies with altitude, and the area has witnessed a considerable drop in malaria transmission during the past 7 years (42). For this study, children admitted to Korogwe District Hospital with malaria symptoms were enrolled after obtaining informed consent from a parent or guardian. Children were immediately subjected to a clinical investigation, and a blood sample was collected for diagnostic and research purposes, after which treatment was instigated according to the national guidelines. Samples were also collected from patients recruited in two study villages during malaria surveys and diagnosed by a rapid diagnostic test. None of these patients had severe symptoms, and they were all treated as outpatients at the village clinic. The study received ethical clearance from the National Institute for Medical Research, Tanzania. The hospital study is part of ongoing monitoring of malaria at the hospital (40, 50). The patient samples included in this study were randomly selected from a database to reflect the main clinical categories of severe malaria after excluding patients with symptoms or signs of other infectious diseases. Parasites from three patients were tested using second-generation sequencing. Patient 1914 was 1.2 y of age and had a Blantyre coma score of 2, a hemoglobin level of 6.9 g/dL, and a parasitemia level of 203,400 parasites/μL. Patient 1965 was 2.4 y of age and had a Blantyre coma score of 5, a hemoglobin level of 4.4 g/dL, and a parasitemia level of 102,100 parasites/μL. Patient 1983 was 2.0 y of age and had a Blantyre coma score of 1, a hemoglobin level of 5.0 g/dL, and a parasitemia level of 79,100 parasites/μL.
Parasite RNA Samples.
Pelleted erythrocytes (50–200 μL) from venous blood samples were completely dissolved in at least 9× volumes of RNA-preserving TRIZOL reagent (Invitrogen) and stored at −80 °C until RNA purification. Total RNA was extracted from thawed samples as recommended by the manufacturer and dissolved in 20 μL of H20. Five microliters of total RNA was dissolved with 5 μL of H20 and treated with DNase1 (Sigma) for 15 min at 37 °C as recommended by the manufacturer. Absence of DNA in RNA samples was confirmed by stable base fluorescence after 30 cycles of real-time PCR with seryl-tRNA synthetase primers (21). Superscript II (Invitrogen) was used to reverse-transcribe DNA-free RNA primed with random hexamer primers as recommended by the manufacturer (25 °C for 10 min and 42 °C for 50 min, followed by 70 °C for 15 min).
var Subtype Quantitative PCR Primers.
Based on nucleotide alignments of DBL and CIDR domains from seven sequenced P. falciparum genomes, 41 degenerate primer pairs targeting loci specific to different DBL and CIDR subclasses (13) were designed (SI Appendix, Fig. S1). In addition, a var2csa-specific primer was used, validated by Sander et al. (51). The 41 primer pairs were validated for use in qPCR analysis by first verifying amplification efficiencies on standard curves generated from qPCR measurements of serial 10-fold dilutions of 3D7, HB3, and FCR3 gDNA. Only primer pairs with PCR efficiency >94% and linear standard curves across a range of six logs of gDNA concentrations were included. PCR reactions were then checked by gel electrophoresis for the presence of amplification of a band of the expected size in 3D7, HB3, and FCR3 gDNA. Finally, the primer pair amplification specificity to and coverage of intended DBL or CIDR subclass domains was determined as follows: PCR fragments generated from 3D7, HB3, or FCR3 gDNA were excised and purified (Qiagen) from electrophoresis gels and then built into sequencing libraries using the Rapid FLX library build kit (Roche) according to the manufacturer’s guidelines. Libraries were subsequently subjected to emulsion PCR and sequenced on a Roche 454 FLX machine. PCR product reads were identified by BLAST against 3D7, HB3, or FCR3 var genes using Bioedit (Ibis Biosciences). The primer pair specificity was determined as reads from targets within the intended DBL or CIDR subclass related to total reads from the PCR (SI Appendix, Fig. S1). The primer pair coverage was determined as the number of intended DBL or CIDR subclass sequences amplified related to the number of said subclasses within the tested genome (SI Appendix, Fig. S1). The actual target amplification observed by sequencing was compared with predicted DBL and CIDR subclass targets defined in seven sequenced genomes (13). Target predictions were made allowing 16% or 10% mismatches to each primer, and the prediction best corresponding to the observed amplifications by sequencing was used to derive a predicted global PCR specificity and coverage. Global specificity was determined as the number of intended DBL and CIDR subclass targets predicted to be amplified from seven genomes vs. the number of different gene targets predicted to be amplified. Global coverage was determined as the number of intended DBL and CIDR subclass targets predicted to be amplified from seven genomes vs. the number of said subclasses found in the seven genomes (SI Appendix, Fig. S1).
RT-qPCR.
RT-qPCR was performed in 20-μL reactions using QuantiTect SYBR Green PCR master mix (Qiagen) with the Rotorgene thermal cycler system (Corbett Research) and primer concentrations of 1 μM. PCR cycling was 95 °C for 15 min, followed by 40 cycles of 95 °C for 30 s, 50 °C for 40 s, and 65 °C for 50 s, with final elongation at 68 °C for 40 s. Data acquisition was done at the end of elongation of each cycle. Specificity of amplifications was assessed by melting-curve [melting temperature (TM)] analysis. The cycle threshold (Ct) was set at 0.025. Nontemplate controls were successfully performed at validations and approximately after every 15th patient sample. Samples were only included for analyses if the mean control gene Ct value ([(Ct seryl-tRNA synthetase + Ct aldolase])/2) was below 25 (i.e., well within the linear amplification range). Quantification was done using Rotorgene software 6.0 (Corbett Research). The mean ± SD of the averaged control gene Ct values was 18.8 ± 2.6. In addition, only measurements with TMs diverging less than 1 °C from the expected TM were included. The abundance of var gene transcripts was determined relative to the averaged transcript abundance of seryl-tRNA synthetase and aldolase (10, 51) (ΔCtvar_primer = Ctvar_primer − Ctaverage_control primers). ΔCtvar_primer values were translated into Tus as follows. ΔCtvar_primer values ≥5 were assigned the value 5. The Tu was then calculated as Tu = 2(5−ΔCt). Thus, var transcript levels with a Ct value of 5 or higher than the mean control gene Ct value were assigned the Tu value of 1, denoting that the transcript level was lower than the detection level of the assay. Increasing Tu levels then indicate increasing transcript levels relative to the average control gene level [i.e., ΔCtvar_primer = 4 corresponds to Tu = 2, ΔCt = 3 ≈ Tu = 4, ΔCt = 2 ≈ Tu = 8, ΔCt = 1 ≈ Tu = 16, ΔCt = 0 ≈ Tu = 32 (corresponding to the mean level of the transcription of control genes), ΔCt = −1 ≈ Tu = 64, ΔCt = −2 ≈ Tu = 128, ΔCt = −3 ≈ Tu = 256]. Thus, an absolute value of transcript level was assigned to parasites from each patient for each primer pair. Transcript levels were only quantitatively compared between patient groups and not between primers within a patient group. Differences in transcript levels between patient groups were determined for each primer by comparing the transcript level in each patient group using a Wilcoxon rank sum test. For semiquantitative identification of highly expressed var types within a patient, Tu > 8 was considered indicative of high transcript levels, based on previous experiments with parasites from pregnant women (24), who are known to transcribe var2csa. This level corresponded to a ΔCt = 2 relative to the mean of the two control genes and approximately ΔCt = 1 relative to seryl-tRNA synthetase. To access whether genes encoding DCs were highly transcribed, parasites were defined to transcribe high levels of DC8-encoding genes if Tu measured by primer CIDRa1.1 or DBLa_CIDRa was >8, to transcribe high levels of DC13-encoding genes if Tu measured by primer DBLa1.7 or CIDRa1.4 was >8, and to transcribe high levels of DC5-encoding genes if Tu measured by primer DBLb7 and 9 or DBLg was >8.
DBLα Tag and Full-Length var Sequencing from Patient Parasite Isolates.
DBLα tag primers (52) were redesigned to varF_dg2 5′-GCAMGMAGTTTYGCNGATATWGG-3′ and brlong2 5′-TCTTCDSYCCATTCVTCRAACCA-3′ by alignment of 366 DBLα sequences from seven P. falciparum genomes. The DBLα tag primer bias was first established by amplification of the ∼350-bp fragments from 3D7, HB3, and gDNA. PCR products were excised and purified (Qiagen) from electrophoresis gels, built into separate Rapid FLX libraries, and sequenced. High-quality (11,000 and 10,000) reads were obtained from 3D7 and HB3 DBLα tag PCRs, respectively. The PCR exhibited no bias against any DBLα subtype but did exhibit amplification bias against DBLα sequences with two or more mismatches to either primer. Thus, the PCR does not amplify DBL1 of VAR2, VAR3, or ∼5% of all other DBLα sequences [estimated from 7 sequenced genomes (13)]. Also, within amplified DBLα sequences, ∼65% of sequences were found at read abundances within twofold of the median read count and ∼90% of sequences were found at read abundances within threefold of the median read count.
PCR assays using DBLα tag primers were performed on cDNA prepared from three patients and sequenced in separate Rapid FLX libraries prepared as described above. The var transcript distribution was determined from DBLα tag read frequency using Usearch v.5.0 (Robert Edgar) (53). The different var transcripts were ranked according to abundance, and those accounting for at least 75% of the sequencing reads were defined as belonging to potentially important var genes in that patient. To characterize the important var genes further, forward primers specific to the DBLα sequence were designed and paired with a universal var exon2 locked nucleic acid (LNA) modified primer 5′-TCTTCATAYTCRCTTTC-3′ (LNA nucleotides in bold italics) in long-range PCR (96 °C for 1 min followed by 7 cycles of 98 °C for 6 s, touch-down annealing from 61 °C (decreasing by 0.5 °C per cycle) for 25 s and 67 °C for 6 min, followed by 33 cycles of 98 °C for 6 s, 55 °C for 15 s, and 67 °C for 7 min and final elongation at 68 °C for 10 min). The PCR assay was performed on genomic DNA purified from frozen patient Buffy coats with the NucleoSpin Blood kit (Macherey–Nagel). DBLα tag PCR as well as long-range PCR was performed with TaKaRa LA Taq polymerase (TAKARA Bio, Inc.) in 25-μL reactions mixed according to the manufacturer’s recommendations, except in long-range PCR, where 0.25 μg of BSA was added. PCR bands with the expected size (range: 5–10 kb) were excised from gels, purified, pooled in equimolar concentrations (20–50 ng/μL), and fragmented using a Bioruptor sonicator (Diagenode S.A.). DNA fragments were purified using a Minelute column (Qiagen) and then built into molecular identifier (MID)-labeled libraries and sequenced as described above. Postsequencing data were sorted by MID using a customized PERL script, and high-quality reads were de novo assembled by Newbler v2.6 (454 Life Sciences). To test if newly identified full-length var genes were biological sequences and not results of chimeric PCR products or false assemblies, all var genes were reamplified from genomic DNA in ∼2,000- to 3000-bp fragments overlapping by 1–300 bp by PCR and correct amplicon sizes were confirmed on electrophoresis gels. Primer pairs combined to span 1–300 bp were validated for use as gene-specific qPCR assays by running qPCR on serial 10-fold dilutions of gel-purified var full-length PCR fragments and used to determine specific transcript abundance levels in cDNA from total RNA from each of the patients. Translated sequences were annotated using VarDom 1.0 Server (http://www.cbs.dtu.dk/services/VarDom/) and ML and neighbor-joining tree analysis (Molecular Evolutionary Genetics Analysis 5.05) following amino acid alignments of single DBL and CIDR domains using MUSCLE (54). Unique var gene sequences were submitted to the GenBank database (accession nos. JQ691636–JQ691659).
Serological Analyses.
Plasma samples were obtained during village surveys as part of ongoing monitoring of malaria endemicity (42). For this study, 543 samples from children aged 6 mo to 3 y were thawed and analyzed for the presence of IgG against 99 different recombinant PfEMP1 proteins (SI Appendix, Fig. S5) and the R2 region of GLURP (55). The recombinant proteins had been produced to reflect the different types and categories of PfEMP1 domains with a bias toward domains from PfEMP1 of group A, which previously had been associated with severe malaria (10, 41, 56). The antibody reactivity was measured in a bead-based Luminex assay as previously described (56). Cutoffs were based on the reactivity of Danish donors never exposed to malaria.
Statistical Analyses.
Children having hemoglobin level <5 g/dL (severe anemia), a Blantyre coma score <3 (cerebral malaria), clinical signs of respiratory distress, and a parasitemia level >200,000 parasites/μL (hyperparasitemia) were considered as having complicated malaria. Children who had none of these signs were considered as having uncomplicated malaria requiring hospital admission, although many of these children were quite sick, having a hemoglobin level from 5–8 g/dL or a Blantyre coma score of 3 or 4. For all patient groups, var gene transcript levels were compared with the children classified as having uncomplicated malaria. In one group comparison, the children classified as having uncomplicated malaria were split into two groups and compared with each other (SI Appendix, Table S2). When an alternative classification for disease severity was used (lactate levels or prostration), the severe group was compared with children classified as having uncomplicated malaria (as defined above) but not having hyperlactatemia or prostration (SI Appendix, Table S2). Var gene transcript levels were compared using the Wilcoxon rank sum test. Because of the nature of the study, many comparisons were made. P values showing moderate levels of statistical difference should therefore be considered with caution. However, in many cases, the results of the statistical testing were consistent with primers targeting similar DCs or across different patient groups. Comparison of serological recognition of different groups of recombinant PfEMP1 proteins was done using ANOVA after log transformation of the data. P values were corrected using the Bonferroni correction. STATA 12 software (StataCorp) was used, although out. Euler diagrams were constructed using the DrawEuler Application developed by Stirling Chow generating area-proportional Euler diagrams (http://apollo.cs.uvic.ca/euler/DrawEuler/index.html).
Supplementary Material
Acknowledgments
We thank the children and parents for participating in the study. The clinical and technical staff of the Joint Malaria Programme at the Korogwe District Hospital and field station is also thanked. We thank Hashim El-Hussein for excellent and diligent technical assistance. We thank the staff of the Danish National High-Throughput DNA Sequencing Center for excellent technical assistance. Drs. Anja T. R. Jensen and Ali Salanti are thanked for donations of recombinant PfEMP1 domains. The study received financial support from the Foundation for the National Institutes of Health through the Grand Challenges in Global Health Initiative, Lundbeck Foundation, Danish International Development Agency, Danish Council for Health Science Research, and University of Copenhagen Program of Excellence.
Footnotes
The authors declare no conflict of interest.
Data deposition: The sequences reported in this paper have been deposited in the Genbank database (accession nos. JQ691636–JQ691659).
This article is a PNAS Direct Submission.
See Author Summary on page 10160 (volume 109, number 26).
See Commentary on page 10130.
This article contains supporting information online at www.pnas.org/lookup/suppl/doi:10.1073/pnas.1120455109/-/DCSupplemental.
References
- 1.WHO World Malaria Report 2010 2010 World Health Organization, Geneva, Switzerland. [Google Scholar]
- 2.Miller LH, Baruch DI, Marsh K, Doumbo OK. The pathogenic basis of malaria. Nature. 2002;415:673–679. doi: 10.1038/415673a. [DOI] [PubMed] [Google Scholar]
- 3.Su XZ, et al. The large diverse gene family var encodes proteins involved in cytoadherence and antigenic variation of Plasmodium falciparum-infected erythrocytes. Cell. 1995;82:89–100. doi: 10.1016/0092-8674(95)90055-1. [DOI] [PubMed] [Google Scholar]
- 4.Baruch DI, et al. Cloning the P. falciparum gene encoding PfEMP1, a malarial variant antigen and adherence receptor on the surface of parasitized human erythrocytes. Cell. 1995;82:77–87. doi: 10.1016/0092-8674(95)90054-3. [DOI] [PubMed] [Google Scholar]
- 5.Smith JD, et al. Switches in expression of Plasmodium falciparum var genes correlate with changes in antigenic and cytoadherent phenotypes of infected erythrocytes. Cell. 1995;82:101–110. doi: 10.1016/0092-8674(95)90056-x. [DOI] [PMC free article] [PubMed] [Google Scholar]
- 6.Rowe JA, Claessens A, Corrigan RA, Arman M. Adhesion of Plasmodium falciparum-infected erythrocytes to human cells: Molecular mechanisms and therapeutic implications. Expert Rev Mol Med. 2009;11:e16. doi: 10.1017/S1462399409001082. [DOI] [PMC free article] [PubMed] [Google Scholar]
- 7.Gardner MJ. The genome of the malaria parasite. Curr Opin Genet Dev. 1999;9:704–708. doi: 10.1016/s0959-437x(99)00032-5. [DOI] [PubMed] [Google Scholar]
- 8.Bull PC, et al. Plasmodium falciparum-infected erythrocytes: Agglutination by diverse Kenyan plasma is associated with severe disease and young host age. J Infect Dis. 2000;182:252–259. doi: 10.1086/315652. [DOI] [PubMed] [Google Scholar]
- 9.Nielsen MA, et al. Plasmodium falciparum variant surface antigen expression varies between isolates causing severe and nonsevere malaria and is modified by acquired immunity. J Immunol. 2002;168:3444–3450. doi: 10.4049/jimmunol.168.7.3444. [DOI] [PubMed] [Google Scholar]
- 10.Jensen AT, et al. Plasmodium falciparum associated with severe childhood malaria preferentially expresses PfEMP1 encoded by group A var genes. J Exp Med. 2004;199:1179–1190. doi: 10.1084/jem.20040274. [DOI] [PMC free article] [PubMed] [Google Scholar]
- 11.Claessens, et al. A subset of group A-like var genes encodes the malaria parasite ligands for binding to human brain endothelial cells. Proc Natl Acad Sci USA. 2012;109:E1772–E1781. doi: 10.1073/pnas.1120461109. [DOI] [PMC free article] [PubMed] [Google Scholar]
- 12.Avril, et al. A restricted subset of var genes mediates adherence of Plasmodium falciparum-infected erythrocytes to brain endothelial cells. Proc Natl Acad Sci USA. 2012;109:E1782–E1790. doi: 10.1073/pnas.1120534109. [DOI] [PMC free article] [PubMed] [Google Scholar]
- 13.Rask TS, et al. Plasmodium falciparum erythrocyte membrane protein 1 diversity in seven genomes—Divide and conquer. PLOS Comput Biol. 2010;6:pii: e1000933. doi: 10.1371/journal.pcbi.1000933. [DOI] [PMC free article] [PubMed] [Google Scholar]
- 14.Singh SK, Hora R, Belrhali H, Chitnis CE, Sharma A. Structural basis for Duffy recognition by the malaria parasite Duffy-binding-like domain. Nature. 2006;439:741–744. doi: 10.1038/nature04443. [DOI] [PubMed] [Google Scholar]
- 15.Tolia NH, Enemark EJ, Sim BK, Joshua-Tor L. Structural basis for the EBA-175 erythrocyte invasion pathway of the malaria parasite Plasmodium falciparum. Cell. 2005;122:183–193. doi: 10.1016/j.cell.2005.05.033. [DOI] [PubMed] [Google Scholar]
- 16.Higgins MK. The structure of a chondroitin sulfate-binding domain important in placental malaria. J Biol Chem. 2008;283:21842–21846. doi: 10.1074/jbc.C800086200. [DOI] [PMC free article] [PubMed] [Google Scholar]
- 17.Juillerat A, et al. Structure of a Plasmodium falciparum PfEMP1 rosetting domain reveals a role for the N-terminal segment in heparin-mediated rosette inhibition. Proc Natl Acad Sci USA. 2011;108:5243–5248. doi: 10.1073/pnas.1018692108. [DOI] [PMC free article] [PubMed] [Google Scholar]
- 18.Lavstsen T, Salanti A, Jensen AT, Arnot DE, Theander TG. Sub-grouping of Plasmodium falciparum 3D7 var genes based on sequence analysis of coding and non-coding regions. Malar J. 2003;2:27. doi: 10.1186/1475-2875-2-27. [DOI] [PMC free article] [PubMed] [Google Scholar]
- 19.Kraemer SM, Smith JD. Evidence for the importance of genetic structuring to the structural and functional specialization of the Plasmodium falciparum var gene family. Mol Microbiol. 2003;50:1527–1538. doi: 10.1046/j.1365-2958.2003.03814.x. [DOI] [PubMed] [Google Scholar]
- 20.Salanti A, et al. A sub-family of common and highly conserved Plasmodium falciparum var genes. Mol Biochem Parasitol. 2002;122:111–115. doi: 10.1016/s0166-6851(02)00080-4. [DOI] [PubMed] [Google Scholar]
- 21.Salanti A, et al. Selective upregulation of a single distinctly structured var gene in chondroitin sulphate A-adhering Plasmodium falciparum involved in pregnancy-associated malaria. Mol Microbiol. 2003;49:179–191. doi: 10.1046/j.1365-2958.2003.03570.x. [DOI] [PubMed] [Google Scholar]
- 22.Trimnell AR, et al. Global genetic diversity and evolution of var genes associated with placental and severe childhood malaria. Mol Biochem Parasitol. 2006;148:169–180. doi: 10.1016/j.molbiopara.2006.03.012. [DOI] [PubMed] [Google Scholar]
- 23.Salanti A, et al. Evidence for the involvement of VAR2CSA in pregnancy-associated malaria. J Exp Med. 2004;200:1197–1203. doi: 10.1084/jem.20041579. [DOI] [PMC free article] [PubMed] [Google Scholar]
- 24.Tuikue NN, et al. Plasmodium falciparum transcriptome analysis reveals pregnancy malaria associated gene expression. PLoS One. 2008;3:e1855. doi: 10.1371/journal.pone.0001855. [DOI] [PMC free article] [PubMed] [Google Scholar]
- 25.Dahlbäck M, et al. The chondroitin sulfate A-binding site of the VAR2CSA protein involves multiple N-terminal domains. J Biol Chem. 2011;286:15908–15917. doi: 10.1074/jbc.M110.191510. [DOI] [PMC free article] [PubMed] [Google Scholar]
- 26.Duffy MF, et al. VAR2CSA is the principal ligand for chondroitin sulfate A in two allogeneic isolates of Plasmodium falciparum. Mol Biochem Parasitol. 2006;148:117–124. doi: 10.1016/j.molbiopara.2006.03.006. [DOI] [PubMed] [Google Scholar]
- 27.Francis SE, et al. Six genes are preferentially transcribed by the circulating and sequestered forms of Plasmodium falciparum parasites that infect pregnant women. Infect Immun. 2007;75:4838–4850. doi: 10.1128/IAI.00635-07. [DOI] [PMC free article] [PubMed] [Google Scholar]
- 28.Gupta S, Snow RW, Donnelly CA, Marsh K, Newbold C. Immunity to non-cerebral severe malaria is acquired after one or two infections. Nat Med. 1999;5:340–343. doi: 10.1038/6560. [DOI] [PubMed] [Google Scholar]
- 29.Rottmann M, et al. Differential expression of var gene groups is associated with morbidity caused by Plasmodium falciparum infection in Tanzanian children. Infect Immun. 2006;74:3904–3911. doi: 10.1128/IAI.02073-05. [DOI] [PMC free article] [PubMed] [Google Scholar]
- 30.Kaestli M, et al. Virulence of malaria is associated with differential expression of Plasmodium falciparum var gene subgroups in a case-control study. J Infect Dis. 2006;193:1567–1574. doi: 10.1086/503776. [DOI] [PMC free article] [PubMed] [Google Scholar]
- 31.Normark J, et al. PfEMP1-DBL1alpha amino acid motifs in severe disease states of Plasmodium falciparum malaria. Proc Natl Acad Sci USA. 2007;104:15835–15840. doi: 10.1073/pnas.0610485104. [DOI] [PMC free article] [PubMed] [Google Scholar]
- 32.Kyriacou HM, et al. Differential var gene transcription in Plasmodium falciparum isolates from patients with cerebral malaria compared to hyperparasitaemia. Mol Biochem Parasitol. 2006;150:211–218. doi: 10.1016/j.molbiopara.2006.08.005. [DOI] [PMC free article] [PubMed] [Google Scholar]
- 33.Falk N, et al. Analysis of Plasmodium falciparum var genes expressed in children from Papua New Guinea. J Infect Dis. 2009;200:347–356. doi: 10.1086/600071. [DOI] [PubMed] [Google Scholar]
- 34.Warimwe GM, et al. Plasmodium falciparum var gene expression is modified by host immunity. Proc Natl Acad Sci USA. 2009;106:21801–21806. doi: 10.1073/pnas.0907590106. [DOI] [PMC free article] [PubMed] [Google Scholar]
- 35.Kalmbach Y, et al. Differential var gene expression in children with malaria and antidromic effects on host gene expression. J Infect Dis. 2010;202:313–317. doi: 10.1086/653586. [DOI] [PubMed] [Google Scholar]
- 36.Bull PC, et al. Plasmodium falciparum antigenic variation. Mapping mosaic var gene sequences onto a network of shared, highly polymorphic sequence blocks. Mol Microbiol. 2008;68:1519–1534. doi: 10.1111/j.1365-2958.2008.06248.x. [DOI] [PMC free article] [PubMed] [Google Scholar]
- 37.Bull PC, et al. An approach to classifying sequence tags sampled from Plasmodium falciparum var genes. Mol Biochem Parasitol. 2007;154:98–102. doi: 10.1016/j.molbiopara.2007.03.011. [DOI] [PMC free article] [PubMed] [Google Scholar]
- 38.Bull PC, et al. Plasmodium falciparum variant surface antigen expression patterns during malaria. PLoS Pathog. 2005;1:e26. doi: 10.1371/journal.ppat.0010026. [DOI] [PMC free article] [PubMed] [Google Scholar]
- 39.Marsh K, et al. Indicators of life-threatening malaria in African children. N Engl J Med. 1995;332:1399–1404. doi: 10.1056/NEJM199505253322102. [DOI] [PubMed] [Google Scholar]
- 40.Agnandji ST, et al. RTS,S Clinical Trials Partnership First results of phase 3 trial of RTS,S/AS01 malaria vaccine in African children. N Engl J Med. 2011;365:1863–1875. doi: 10.1056/NEJMoa1102287. [DOI] [PubMed] [Google Scholar]
- 41.Cham GK, et al. Sequential, ordered acquisition of antibodies to Plasmodium falciparum erythrocyte membrane protein 1 domains. J Immunol. 2009;183:3356–3363. doi: 10.4049/jimmunol.0901331. [DOI] [PubMed] [Google Scholar]
- 42.Mmbando BP, et al. A progressive declining in the burden of malaria in north-eastern Tanzania. Malar J. 2010;9:216. doi: 10.1186/1475-2875-9-216. [DOI] [PMC free article] [PubMed] [Google Scholar]
- 43.Bian Z, Wang G. Antigenic variation and cytoadherence of PfEMP1 of Plasmodium falciparum-infected erythrocyte from malaria patients. Chin Med J (Engl) 2000;113:981–984. [PubMed] [Google Scholar]
- 44.Magistrado P, et al. VAR2CSA expression on the surface of placenta-derived Plasmodium falciparum-infected erythrocytes. J Infect Dis. 2008;198:1071–1074. doi: 10.1086/591502. [DOI] [PubMed] [Google Scholar]
- 45.Dahlbäck M, et al. Epitope mapping and topographic analysis of VAR2CSA DBL3X involved in P. falciparum placental sequestration. PLoS Pathog. 2006;2:e124. doi: 10.1371/journal.ppat.0020124. [DOI] [PMC free article] [PubMed] [Google Scholar]
- 46.Scherf A, et al. Antigenic variation in malaria: In situ switching, relaxed and mutually exclusive transcription of var genes during intra-erythrocytic development in Plasmodium falciparum. EMBO J. 1998;17:5418–5426. doi: 10.1093/emboj/17.18.5418. [DOI] [PMC free article] [PubMed] [Google Scholar]
- 47.Joergensen L, et al. Surface co-expression of two different PfEMP1 antigens on single plasmodium falciparum-infected erythrocytes facilitates binding to ICAM1 and PECAM1. PLoS Pathog. 2010;6:e1001083. doi: 10.1371/journal.ppat.1001083. [DOI] [PMC free article] [PubMed] [Google Scholar]
- 48.Wang CW, et al. The Plasmodium falciparum var gene transcription strategy at the onset of blood stage infection in a human volunteer. Parasitol Int. 2009;58:478–480. doi: 10.1016/j.parint.2009.07.004. [DOI] [PubMed] [Google Scholar]
- 49.Drakeley CJ, et al. Altitude-dependent and -independent variations in Plasmodium falciparum prevalence in northeastern Tanzania. J Infect Dis. 2005;191:1589–1598. doi: 10.1086/429669. [DOI] [PubMed] [Google Scholar]
- 50.Dondorp AM, et al. AQUAMAT group Artesunate versus quinine in the treatment of severe falciparum malaria in African children (AQUAMAT): An open-label, randomised trial. Lancet. 2010;376:1647–1657. doi: 10.1016/S0140-6736(10)61924-1. [DOI] [PMC free article] [PubMed] [Google Scholar]
- 51.Sander AF, et al. Multiple var2csa-type PfEMP1 genes located at different chromosomal loci occur in many Plasmodium falciparum isolates. PLoS ONE. 2009;4:e6667. doi: 10.1371/journal.pone.0006667. [DOI] [PMC free article] [PubMed] [Google Scholar]
- 52.Taylor HM, Kyes SA, Harris D, Kriek N, Newbold CI. A study of var gene transcription in vitro using universal var gene primers. Mol Biochem Parasitol. 2000;105:13–23. doi: 10.1016/s0166-6851(99)00159-0. [DOI] [PubMed] [Google Scholar]
- 53.Edgar RC. Search and clustering orders of magnitude faster than BLAST. Bioinformatics. 2010;26:2460–2461. doi: 10.1093/bioinformatics/btq461. [DOI] [PubMed] [Google Scholar]
- 54.Edgar RC. MUSCLE: Multiple sequence alignment with high accuracy and high throughput. Nucleic Acids Res. 2004;32:1792–1797. doi: 10.1093/nar/gkh340. [DOI] [PMC free article] [PubMed] [Google Scholar]
- 55.Turner L, et al. Antibodies against PfEMP1, RIFIN, MSP3 and GLURP are acquired during controlled Plasmodium falciparum malaria infections in naïve volunteers. PLoS ONE. 2011;6:e29025. doi: 10.1371/journal.pone.0029025. [DOI] [PMC free article] [PubMed] [Google Scholar]
- 56.Cham GK, et al. A semi-automated multiplex high-throughput assay for measuring IgG antibodies against Plasmodium falciparum erythrocyte membrane protein 1 (PfEMP1) domains in small volumes of plasma. Malar J. 2008;7:108. doi: 10.1186/1475-2875-7-108. [DOI] [PMC free article] [PubMed] [Google Scholar]
