Abstract
When driven at sound pressure levels greater than ~110 dB stimulus pressure level, the mammalian middle ear is known to produce subharmonic distortion. In this study, we simultaneously measured subharmonics in the ear canal pressure, intracochlear pressure, and basilar membrane or round window membrane velocity, in gerbil. Our primary objective was to quantify the relationship between the subharmonics measured in the ear canal and their intracochlear counterparts. We had two primary findings: (1) The subharmonics emerged suddenly, with a substantial amplitude in the ear canal and the cochlea; (2) at the stimulus level for which subharmonics emerged, the pressure in scala vestibuli/pressure in the ear canal amplitude relationship was similar for the subharmonic and fundamental components. These findings are important for experiments and clinical conditions in which high sound pressure level stimuli are used and could lead to confounding subharmonic stimulation.
Keywords: tympanic membrane, intracochlear pressure, subharmonics, nonlinearity, hearing aid
Introduction
In a study involving high sound pressure level stimuli in gerbil, we observed that the ear canal (EC) pressure contained subharmonics of the stimulus frequency that were not observed when the stimulus was delivered to a cavity. The largest and most prevalent subharmonics were at a frequency equal to half the stimulus frequency. Middle-ear-derived subharmonics had been studied in the 1950s and 1960s. von Gierke (1950) detected subharmonics radiating from the ears of both human and animal ears upon loud tonal stimulation; the stimulus level required to elicit subharmonics was 140 dB sound pressure level (SPL, defined as 20 log(P/20 μPa)) for humans and 95 dB for guinea pigs. Eldredge (1951) reported that human subjects exposed to loud tones perceived subharmonics when the level was ~140 dB SPL. Subharmonics were also detected in the subjects’ EC pressure. In a theoretical study aimed at understanding subharmonic responses, Pong and Marcaccio (1963) predicted that the asymmetric restoring force of the tympanic membrane (TM) could produce subharmonics for SPLs of ~120 dB or greater (in human). The TM had been shown to have an asymmetric stiffness by Kobrak (1948), and this is not surprising given the TM’s conical anatomy and asymmetric ossicular attachment. More recent measurements have also demonstrated this asymmetric stiffness (Funnell and Decraemer 1996; Gea et al. 2010; von Unge et al. 1993). Subharmonic responses were studied in animals in a series of experiments by Dallos (1966a, b) and Dallos and Linnell (1966a, b, c). One of these studies reported subharmonics in the cochlear microphonic of chinchillas and guinea pigs and noted that the subharmonics emerged suddenly with a substantial amplitude at driving levels above ~110 dB SPL. A second study detected subharmonics in the EC (Dallos and Linnell 1966a) and demonstrated that the even-order subharmonics (with frequency one half or one quarter of the fundamental) remained when the cochlea and stapes were removed, but not when the TM was removed. Further manipulations suggested that the coupling between the TM and the manubrium was necessary for producing the even-order subharmonics. These findings indicated that the TM and its attachments were responsible for the even-order subharmonic nonlinearity and thus were consistent with a mechanism like that proposed by Pong and Marcaccio (1963). More recently, Usanov et al. (2007) observed subharmonics in the TM motion of excised pig temporal bones.
While the results of the studies described above showed that the TM produced even-order subharmonics, they did not rule out any contribution from the cochlea and in fact attributed some types of subharmonics to the inner ear (Dallos 1966a). Intracochlear subharmonics were observed in measurements of the motion of the organ of Corti in guinea pig (Teich et al. 1995) and while recognizing the work of Dallos and colleagues, this study analyzed the subharmonic nonlinearity in terms of a negative stiffness Duffing oscillator that was hypothesized to exist in the organ of Corti’s cellular dynamics. Additional theoretical analyses by Teich and colleagues explored cochlear nonlinearity, including the emergence of subharmonics, due to bilinear stiffness, resistance, and mass (Keilson et al. 1989a, b; Teich et al. 1989). This series of papers notes that subharmonic nonlinearity is part of a rich topic of mathematical physics that includes chaos and active oscillators (Thompson and Stewart 2002). On another physiological-acoustics topic, subharmonics were recently identified as components of complex vocalizations (Fitch et al. 2002; Suthers et al. 2006).
As will be described below, our results are consistent with the conclusion of Dallos and Linnell that prominent even-order subharmonics are produced in the middle ear. Our study extends its predecessors by quantifying the relationship between the fo/2 subharmonic in the EC pressure (PEC) and in the intracochlear pressure in scala vestibuli (PSV) near the stapes. PSV at the stapes is the input to the cochlea and the relationship between a stimulating PEC and the PSV response characterizes middle ear transmission. This relationship is typically measured with pure tone stimulation, and the transfer function characterizing transmission is found at the fundamental (stimulating) frequency. This middle ear transfer function has been described in gerbil (Dong and Olson 2006; Olson 1998) and other animals (Décory et al. 1990; Slama et al. 2010), as well as human temporal bone (Puria 2003). However, the PSV/PEC pressure relationship in the subharmonic represents an entirely different process. In this case both PEC and PSV are produced by a force generated in the TM, transmitted outward to the EC as PEC and inward to the cochlea as PSV. Thus, we have no preconception about what the quantitative relationship between PEC and PSV will be in the subharmonic—there is no a priori reason to believe it will be similar to the PSV/PEC relationship of the fundamental. Characterizing this relationship is necessary to understand cochlear responses to high SPL stimuli in experimental work in which PEC subharmonics are present, such as our own recent study of single unit auditory nerve responses (Huang and Olson 2011). Subharmonics were observed in PEC in all 13 animals of that study. The present study is also needed to better understand the cochlear stimulus produced by high amplification hearing aids, in particular the possibility of signal degradation due to subharmonic generation.
In addition to PSV near the stapes, we measured the basilar membrane or round window membrane velocity (VBM or VRWM) responses in the very basal region near the stapes. At such high SPL, these responses are passive in terms of cochlear mechanics, and our objectives in measuring them was to confirm and extend the PSV measurement and to determine whether the relationship between PSV and VBM or VRWM was similar for the fundamental and the subharmonic.
Methods
The experimental methods are generally similar to those that have been used previously, for example (Dong and Olson 2009).
Animal preparation
Procedures were approved by the Institutional Animal Care and Use Committee of Columbia University. Experiments were performed in anesthetized young adult gerbils, 50–70 g in mass. Ketamine (40 mg/kg) was administered first to sedate the animal. Sodium pentobarbital (60 mg/kg with 10 mg/kg supplements) was used throughout the experiment for maintenance of anesthesia, and the analgesic buprenorphine (20 mg/kg) was administered every 6 h. At the end of the experiment, the animal was sacrificed with sodium pentobarbital. A tracheotomy was performed to maintain a patent airway. The animal core temperature was maintained at ~37 C with a heating blanket. The left bulla was exposed and widely opened with great care to access the cochlea. The dorsal surface of the skull was fixed to a head-holder with dental cement and firmly attached to a small goniometer, which was used to orient the head for simultaneously positioning a pressure sensor in SV and focusing the interferometer laser on the basilar membrane (BM) or round window membrane (RWM). A small hole (diameter ~200 μm) was hand-drilled through the bony wall of SV close to the stapes for sensor insertion. The RWM was left intact.
Stimulus presentation and response measurement
PEC, PSV, and VBM or VRWM were recorded simultaneously. A TDT System 3 was used as the DAC/ADC system and was operated with a sample period of 5 μs. Usually ~1 s of data were collected during each data run. The data were stored after deleting the first 20 ms of the response to avoid the transient and averaging the remaining data in 50 time-locked segments. The stored data were analyzed via Fourier transform, using MATLAB.
Sound stimulus
Acoustic pure tones were delivered one by one to the EC of the gerbil in a closed-field configuration. A plastic T-shaped tube 2 × 1.5 cm with 2 mm inner diameter was coupled to the EC opening, and the connection was reinforced with soft wax. Sound stimuli were delivered to one branch of the T-tube via ~10 cm of flexible tubing. Sound stimuli were produced with a Radio Shack super tweeter (type 40–1310) via the TDT headphone buffer, HB7, or a more powerful auditory amplifier as described below. The SPL was calibrated in the EC within 3 mm of the tympanic membrane using a Bruel & Kjaer half-inch microphone and attached probe tube that was inserted through the long arm of the T-tube. The transfer function of the probe tube was accounted for when setting the sound pressure level and analyzing the data. This microphone also measured PEC during data collection. Acoustic distortion was checked with the same microphone, probe tube, and T-tube in a cavity and subharmonic distortion was never produced, up to the highest levels tested, ~140 dB SPL. With 1 s of signal averaging and moderate stimulus levels the noise level of this system is ~10 dB SPL up to 30 kHz. At high sound pressure levels (120 dB SPL and greater), the noise floor was sometimes elevated, perhaps due to the acoustic driver.
Our initial observation of the subharmonics was made with our usual acoustic configuration, which was capable of delivering sound to ~120 dB SPL over an extensive but nevertheless limited range of frequencies. In order to further explore the subharmonics, we extended the SPL by substituting a National Semiconductor LM3875 audio power amplifier for the TDT HB7. In addition, in order to not overdrive the TDT input from the B&K microphone (the maximum input to the TDT is 10 V), we attenuated the voltage signal from the microphone prior to connecting to the TDT input. With these modifications, we were able to produce and measure a 140-dB SPL tone in a cavity from 1 to 20 kHz, with similar results in the EC. Sound levels of 100 dB SPL were attainable over a 40 kHz range.
Velocity measurement
VBM and VRWM were measured with a laser Doppler vibrometer (LDV; Polytec, OFV-534 and VD-06 decoder), with gain setting at 50 mm s−1 V−1 for the high SPL stimuli. This setting was adequate to provide linear operation through the range of measured velocity. The vibrometer’s helium–neon laser was focused on the preparation with a 5× Mitutoyo lens with 34 mm operating distance. The resolving power reported by the lens manufacturer is 2 μm. By eye the diameter of the spot on the BM was ~20 μm. Figure 1 in Dong and Olson (2009) includes a photo using a 10× lens, which provides a slightly sharper focus than the 5× lens of the present study. VBM was measured through the transparent RWM at a location with BF ~40 kHz without reflecting beads or foils. In experiment wg149, the RWM was not as transparent as usual, and in this case, VRWM was measured instead of VBM. The RWM and BM move similarly in the very base of the passive cochlea (Dong and Olson 2009, supplemental section).
Intracochlear pressure
The intracochlear pressure was measured via specialized fiber optic pressure sensors inserted into the SV through a small hole that was hand-drilled next to the stapes. This procedure and the pressure sensors were described previously (e.g., Olson 1998). The sensors were constructed on a cylindrical glass tube with outer diameter 125 μm. The tube is terminated with a gold coated membrane ~1 μm in thickness, which moves (~1 nm/Pa) in response to pressure. Light from a fiber optic threaded into the capillary reflects from the membrane to interrogate its position. The pressure sensors are calibrated before and after an experiment by submerging them a known distance beneath the surface of a vial of water that is shaken with a known acceleration (Bruel and Kjaer shaker model 4290) up to 50 kHz. The sensor sensitivity is approximately flat (within 3 or 4 dB) up to at least 40 kHz. Changes in sensor sensitivity from day to day, or following an experiment, of up to 10 dB are not uncommon. These changes are flat with frequency, but set a limit on the accuracy of the absolute pressure the sensors measure. The sensors were known to behave linearly to high SPL, but we had not tested them at the pressure levels of the present experiment. Because of the ~25 dB pressure gain through the middle ear, when we apply 130 dB SPL at the EC, this would correspond to ~155 dB SPL in the inner ear, which is ~1,000 Pa. (This calculation takes the middle ear as linear, which is not true at these levels, so the 1,000 Pa value can be considered as an upper bound.) The sensor membrane distends ~1 nm/Pa, so the membrane would be distending ~1 μm. This is likely close to the limit of linearity of the sensors, whose membrane is ~1 μm in thickness, with a 75 μm inner diameter. This potential problem was addressed in the current study by including the additional intracochlear measurements of VBM or VRWM. As described in “Results,” we found that at the fundamental frequency, VBM/PEC, VRWM/PEC, and PSV/PEC became compressively nonlinear in a similar way at the same high SPL. The SPL at which compressive nonlinearity appeared was similar to that for which others had detected compressive nonlinearity in the middle ear (Aerts and Dirckx 2010; Guinan and Peake 1967). Based on the similarity of VRWM, VBM, and PSV, and agreement with previous results from the literature, we conclude that the sensors were behaving linearly or close to linearly throughout the measurement range and the compressive nonlinearity observed was produced in the middle ear.
Results
Three gerbils were used in the study and gave similar results. A subset of the wg148 data were collected just post-mortem with no apparent difference in these results in the post-mortem condition.
Fundamental responses to high SPL stimuli
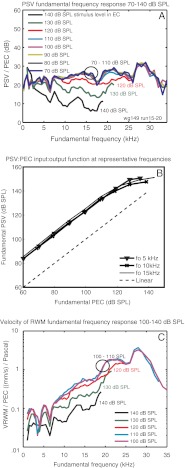
At the fundamental frequency, the relationship between PSV at the stapes and PEC represents middle ear transmission, and the ratio PSV/PEC is the middle ear pressure gain. Figure 1A shows that this relationship was linear through a wide frequency range up to stimulus levels of 110 dB, beyond which the response became compressively nonlinear. In previous studies, the ratio was found to be linear over the full range tested, from 45 to 85 dB SPL Olson (2001) and 60 to 90 dB SPL (Dong and Olson 2009), and the present result extends the region of linearity and finds its limit to be 110–120 dB SPL. The present result is replotted as an input/output function at three representative frequencies in Figure 1B. Figure 1C shows that the simultaneously measured VRWM became compressively nonlinear with the same 120 dB SPL onset as PSV. Because the intracochlear velocity and pressure measurements use independent measurement systems, this result reassures that the high level compressive nonlinearity is arising in the ear and not the measurement systems.
FIG. 1.
A The ratio of PSV measured near the stapes to PEC at the stimulus (fundamental) frequency. The SPL in the EC ranged from 70 to 140 dB SPL in 10 dB steps. B Corresponding input/output function at frequencies of 5, 10, and 15 kHz. C The ratio of VRWM to PEC at the stimulus (fundamental) frequency, with SPLs in the EC ranging from 100 to 140 dB SPL (this velocity measurement was relatively noisy; thus, we do not plot all the levels shown in A) wg149.
The origin of even order subharmonics
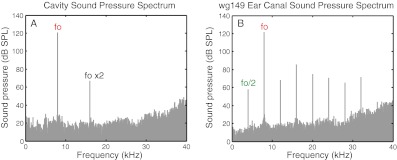
The speaker’s frequency response was measured inside a cavity that was similar in volume to a gerbil EC. Figure 2A shows an example of the pressure spectrum in the cavity with the stimulus tone at 8 kHz and 120 dB SPL. While harmonic distortion is apparent, the speaker did not generate subharmonics. No subharmonics were detected with stimulus tones up to the highest level probed, 140 dB SPL. Figure 2B shows PEC in wg149. In the gerbil EC, the subharmonic fo ×0.5 was large and, as was typical, was accompanied by its harmonics; thus, we also see responses at frequencies fo ×1.5, ×2.5, etc. In this report, we focus on the fo/2 subharmonic unless otherwise noted.
FIG. 2.
Sound pressure spectrum with the speaker driven with an 8 kHz sinusoid calibrated to deliver a 120 dB tone. In a cavity (A), harmonics were observed due to speaker nonlinearity. In the EC of gerbil wg149 (B), subharmonics were also observed.
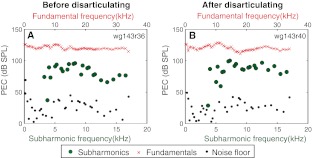
In one animal (wg143), the stapes was disarticulated toward the end of the experiment. PEC fundamental and subharmonic responses before and after disarticulation, with a stimulus level of ~120 dB SPL are shown in Figure 3. While the details of the EC fundamental and subharmonics changed slightly after disarticulation, their overall size was unchanged, confirming Dallos and Linnel’s (1966a) finding that even order subharmonics originated in the middle ear.
FIG. 3.
Fundamental and subharmonic (fo/2) pressure in the EC before (A) and after (B) disarticulating the stapes. The stimulus level was set at 120 dB SPL. Pressure spectra were screened visually for fo/2 subharmonics and identified subharmonics are plotted with green circles. Where no fo/2 subharmonic was found, the level of the noise floor at the fo/2 frequency is plotted as a black dot. Fundamental frequencies (fo) are indicated at the top axis of each panel; the subharmonic frequencies (fo/2) are at the bottom axis.
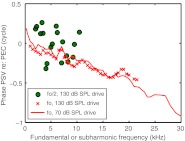
In the fundamental response, the relationship between PSV and PEC has been well characterized in gerbil—a gain of ~20–30 dB (Dong and Olson 2006; Olson 1998) and a delay-like phase, corresponding to a ~30 μs delay when PEC is measured just within the EC. In the subsequent sections, the PSV/PEC subharmonic amplitude ratio will be emphasized. Here, we include a phase plot because the difference between the subharmonic and fundamental phase behavior underscores the fact that while the fundamental can be thought of as a signal passing through the EC on its way to the SV with a time delay, the subharmonic is a signal that originates in the middle ear, at a location between SV and EC. Figure 4 shows the relative phase of the fundamental and subharmonic responses at a stimulus level in the EC of 130 dB SPL. The response to a 70 dB SPL stimulus is included for the fundamental because this extends the frequency range (in this experiment we could not deliver 130 dB SPL above ~20 kHz) and makes the delay-like phase of the fundamental clearer. In the overlapping region, the fundamental phases at 70 and 130 dB SPL were similar. The phase accumulation of the fundamental illustrates its transmission through the middle ear with a delay of ~30 μs. In contrast, for fo/2, the phase relationship is quite random—there is no apparent precedence of PEC or PSV in the subharmonic response. This is consistent with the source of the subharmonics being between the EC and the SV and rules out the possibility that the subharmonics were generated in the speaker.
FIG. 4.
Phase of PSV relative to PEC of the fundamental (at frequency fo) and subharmonic (at frequency fo/2). The fundamental phase accumulates, illustrating the transmission delay through the middle ear. In contrast, the subharmonic phase does not show a systematic accumulation or pattern, which is consistent with the subharmonic being produced at a site between the EC and SV (wg149).
Characteristics of subharmonic responses
Emergence of the subharmonics
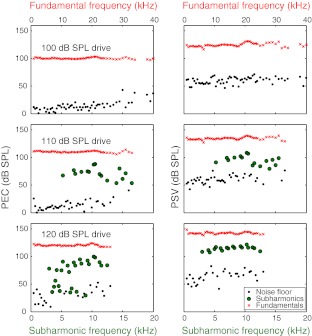
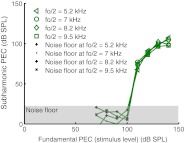
Consistent with the description given by Dallos and Linnell (1966c), subharmonics emerged suddenly with a substantial amplitude at high SPL. In two of the three animals (wg143 and wg148), the subharmonics emerged at 120 dB SPL and in the third (wg149) at 110 dB SPL. (Our level spacing was 10 dB.) The abrupt emergence is illustrated in Figures 5 and 6, from wg149, for which the data are most extensive. Figure 5 shows PEC and PSV plotted versus frequency at three stimulus levels. Subharmonics were absent at 100 dB SPL and emerged abruptly at 110 dB SPL in both PSV and PEC. Referring back to Figure 1, which is from the same set of recordings, the subharmonics began to emerge just below the SPL for which the fundamental became clearly compressively nonlinear. Subharmonics did not occur at every stimulus frequency, and as the SPL increased, they occurred at more stimulus frequencies. At 120 dB, the noise level was elevated in PEC, and several lower-level subharmonics were observed. In PSV, the elevated noise level and low-level subharmonics were not apparent, but their absence might be due to the relatively large intrinsic noise level of the intracochlear pressure sensors. In Figure 6, the sudden onset of the subharmonics is emphasized in a plot of the PEC subharmonic amplitude plotted versus the PEC fundamental at four representative frequencies.
FIG. 5.
PEC (left) and PSV (right) at stimulus levels of 100, 110, and 120 dB SPL. (wg149 runs 16–18). Pressure spectra were screened visually for fo/2 subharmonics, and identified subharmonics are plotted with green circles. Where no subharmonic was found, the level of the noise floor at the fo/2 frequency is plotted. Fundamental frequencies (fo) are shown at the top axis of each panel; the subharmonic frequencies (fo/2) are shown at the bottom axis.
FIG. 6.
Subharmonics emerged abruptly at 110 dB SPL in gerbil (wg149 runs 15–20). Below 110 dB SPL, subharmonics did not emerge from the noise.
PSV/PEC magnitude ratio in subharmonics, compared to fundamental
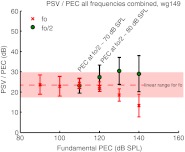
Finding the PSV/PEC magnitude ratio of the subharmonic and comparing it to the PSV/PEC magnitude ratio of the fundamental was the study’s main objective. Figure 7 shows the PSV/PEC ratio for the three animals of this study as a function of frequency. The data of wg148 were collected 20–30 min post-mortem, following inadvertent anesthetic overdose in this animal. For stimulus fundamentals, the PSV/PEC ratio is the pressure gain provided by the middle ear. In gerbils, this gain is on average ~20–30 dB with some of the variance due to sensor calibration uncertainty. In the three animals of the present study, the middle ear gain ranged from ~18 to 25 dB, a range consistent with our previous findings. The PSV/PEC ratios are shown at the stimulus levels for which the subharmonics began to emerge (and 10 dB higher for wg149 in the right panel). Figure 7 shows that at the SPL for which the subharmonics emerged the PSV/PEC magnitude ratio of the subharmonic was similar to that of the fundamental. This similarity of the ratio in the fundamental and subharmonics was not something that could have been predicted and was an important empirical observation. (Note that this finding is immune to uncertainty in the sensor calibration because the subharmonics and fundamentals are measured at the same time with the same sensor, and the sensor calibration and calibration uncertainty are both flat with frequency.) As the stimulus level was increased further, the PSV/PEC magnitude ratio of the subharmonic tended to surpass that of the fundamental. Figure 8 plots the PSV/PEC ratio averaged over all frequencies for the fundamental, and over all frequencies for which a subharmonic (fo/2) was present for the subharmonics, as a function of the stimulus level in the EC. The variation of the PSV/PEC ratio is conveyed in the vertical standard deviation bars. The shaded pink bar indicates the fundamental ratio in the linear regime. At 110 dB SPL—the level where the subharmonics emerged—this combined PSV/PEC ratio was almost exactly the same for the subharmonic and the fundamental. At 120 dB SPL, the ratios were similar but beginning to diverge—the average subharmonic ratio exceeds the fundamental ratio by a few decibels. At 130 dB SPL, the subharmonic ratio has increased and the fundamental decreased, re-illustrating the compressive nonlinearity in the fundamental that was shown in Figure 1. The average subharmonic ratio exceeded the linear fundamental ratio by ~7 dB at this point—not a huge difference on an auditory scale—so it is still reasonable to think of the subharmonic in the EC as roughly a stimulus of that level in order to approximate the intracochlear response. At 140 dB SPL, the subharmonic was also beginning to saturate and its ratio came down slightly; at the same time, the fundamental ratio was reduced further. At 140 dB, the average subharmonic ratio exceeded the linear fundamental ratio by ~6 dB.
FIG. 7.
The ratio of PSV to PEC (PSV/PEC) in animals wg143, wg148, and wg149. Subharmonics (fo/2) appeared at a stimulus level of 120 dB SPL for wg143 and wg148 and at a stimulus level of 110 dB for wg149. PSV/PEC at the subharmonic frequency (fo/2) was measured when the EC was driven at 110 dB SPL for wg149 (open circles) and at 120 dB SPL (solid circles) for all three animals. PSV/PEC at the fundamental frequency (fo) is also shown (crosses). The subharmonics are plotted at their own frequency to allow direct comparison to the fundamentals.
FIG. 8.
Average PSV/PEC ratio for all frequencies (fundamental) and all frequencies for which subharmonics (fo/2) emerged from the noise (subharmonics). The vertical bars indicate the standard deviation.
Subharmonics in intracochlear velocity
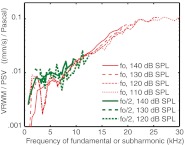
Subharmonics emerged in VBM or VRWM at the same stimulus level as they emerged in PSV and PEC. We were interested in comparing the VBM/PSV ratio in the subharmonic and fundamental; because the subharmonics arose from a mechanical force that originated in the TM and the fundamentals arose from a TM response to a pressure that originated in the EC, it was possible that the motion of the TM and subsequently the stapes might be different for the fundamental and subharmonic. Such a difference could lead to a different VBM/PSV relationship. We tested this possibility by comparing the VBM/PSV relationship of the fundamental and subharmonic responses. At low and moderate SPL, VBM is known to be actively nonlinear, but active nonlinearity is not relevant to the very-high-stimulus level results of this study. In addition, we measured in the very base of the cochlea where activity would be present at frequencies in the vicinity of the ~30–40 kHz best frequency of this region, and this study emphasizes frequencies lower than that. Data from wg149 are plotted because they probed the most extensive frequency and level ranges. In wg149, VRWM was measured instead of VBM because in this animal, the RWM was less transparent than in most cochleae and the BM was thus difficult to focus on. VBM and VRWM are known to be similar in the very basal cochlear region where the RWM lies close to the BM (Dong and Olson 2009). Hence, VRWM can be taken as ~ VBM. The results from wg143 and wg148, in which VBM was measured, were similar to these results, but less extensive. Figure 9 plots VRWM/PSV at fundamental (red, thin lines) and subharmonic (fo/2) frequencies (green, thick lines.) Only frequencies for which subharmonics emerged from the noise are included in the subharmonic results. At 110 dB SPL, VRWM subharmonics were just barely emerging from the relatively high noise level, and thus, subharmonic responses are not shown. The fundamental response at 110 dB SPL is included in the plot in order to extend the fundamental result to within the range where the middle ear response scaled linearly (Fig. 8). Figure 9 demonstrates two findings. (1) The relationship between PSV and VRWM (or VBM) was linear. At some point, passive compressive nonlinearity is expected within the cochlea, but we did not observe it. On this point, however, it is good to recall Figure 1 (which also plots these data, but in a different way, and extends them to lower SPL). Figure 1 shows that the middle ear’s transmission of the fundamental is compressively nonlinear at 120 dB SPL and above; thus, the range of intracochlear stimulation represented in PSV is not as extensive as the range of SPL input to the EC. (2) The VBM/PSV ratio was similar for the subharmonics and the fundamental. This result argues that we can limit ourselves to understanding the PSV/PEC transformation in order to determine how a subharmonic in PEC acts as an intracochlear stimulus.
FIG. 9.
The ratio of VRWM to PSV for stimulus levels of 110, 120, 130 and 140 dB SPL, animal wg149. The ratio is shown at both the fundamental and subharmonic (fo/2) frequencies. Subharmonics were close to the noise floor of the VRWM measurement at 110 dB and therefore are not included.
The emergence of the fo/4 subharmonic
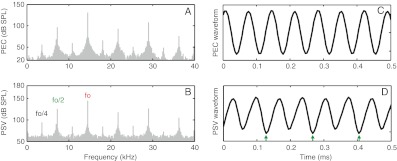
The fo/4 subharmonic sometimes emerged, always at a higher stimulus SPL than that for which the fo/2 subharmonic emerged. This was seen in several spectra, and an example is in Figure 10. Panels A and B show the spectra of PEC and PSV, respectively. The stimulus was a 130 dB SPL 14.5 kHz tone. fo/2 and fo/4 are clearly visible in both spectra, as well as their harmonics. At 120 dB SPL, only fo/2 and its harmonics had been visible. The time waveforms corresponding to the spectra of A and B are in C and D. In the PSV waveform of D, the contribution of the fo/2 component is clearly seen as a period doubling. Its presence is only subtly visible in the PEC waveform of C. The clearer representation of fo/2 in the PSV time waveform as opposed to the PEC time waveform is due to the saturation of the fundamental in PSV (refer to Fig. 1B). The presence of fo/4 is equivalent to period quadrupling, but the fo/4 component was not large enough to make this quadrupling apparent in the time waveforms.
FIG. 10.
Spectra and time waveforms of PEC and PSV with a 130 dB SPL, 14.5 kHz stimulus. A PEC and B PSV spectra showing subharmonics at fo/4 and fo/2 and their harmonics. C, D Corresponding time waveforms. Arrows indicate the period doubling that results from the presence of fo/2, wg143 run 37.
Discussion
In this study, we revisited auditory subharmonics that are generated in the middle ear. Our primary objective was to quantify the relationship between subharmonics in the EC and subharmonics in the cochlea (focusing on the fo/2 subharmonic, which is most prominent), in order to evaluate the intracochlear responses corresponding to the observed EC subharmonics.
Auditory subharmonics had been observed psychoacoustically and in the EC in humans (Eldredge 1951), and Dallos and Linnell studied them in the cochlear microphonic and the EC (Dallos 1966a, b; Dallos and Linnell 1966a, b, c). In this study, we extend the understanding of subharmonics by quantifying the relationship between EC subharmonics and subharmonics in the intracochlear pressure in SV close to the stapes. Because this pressure is the input to the cochlea, this quantification allows one to predict the cochlear stimulus that corresponds to a given, measured EC subharmonic. EC subharmonics are straightforward and noninvasive to measure, and thus, our quantification will be useful to any study or clinical setting in which EC subharmonics are found.
With respect to this quantification, we had two primary findings, illustrated in Figures 6, 7, and 8. Figure 6 shows that the subharmonics emerged suddenly, with a fairly large amplitude in the EC and the cochlea. The second primary finding, shown in Figures 7 and 8, is that at the stimulus level for which they emerge the subharmonic (fo/2) and fundamental PSV/PEC relationship was similar—thus, in terms of their amplitude, the subharmonics in the EC can be considered to be equivalent to the same tone, had it been applied to the EC. [Recall that this correspondence does not apply to the phase (Fig. 4).] At higher levels, the PSV/PEC relationship was ~7 dB larger than the PSV/PEC fundamental relationship when it is in the linear region (Fig. 8). (The linear region is relevant for comparing EC subharmonics to EC fundamentals of the same level, which is the point we are emphasizing.) Thus, the following broad-brush statements can be made: First, if there are no subharmonics in the EC, there are no subharmonics in the cochlea; second, an EC subharmonic can be thought of as a fundamental, in terms of its relationship to intracochlear pressure. (The statement applies to amplitude, not phase.) This correspondence is good when the subharmonics first emerge and is generally correct to ~10 dB at higher SPLs, rounding up from the 7 dB average seen in Figure 8. It should be noted that 10 dB corresponds to a factor of ~ 3 and is a substantial departure from truly equal PSV/PEC ratios for the fundamental and subharmonic responses. The lack of equality serves as a reminder, as does the phase in Figure 4, that the fundamental and subharmonic have very different sources—the fundamental is being delivered by the speaker, whereas the subharmonic is likely radiating from the TM.
Our interest in the subharmonic problem stemmed from a project that explored hair cell excitation via single unit AN responses (Huang and Olson 2011). Based on the results of Ruggero et al. (2000), the frequency region above a unit’s high frequency cut-off appeared to not give rise to AN excitation even when the corresponding BM motion was large enough to elicit excitation when it occurred at a lower frequency. We sought to understand this result and test its limits. We found that supra-cut-off frequencies could be excitatory, but tone levels of ~120 dB were often needed. We had monitored PEC and observed that at these stimulus levels subharmonics were sometimes present. This was an issue for our study because the subharmonics were of a frequency that were closer to the unit’s characteristic frequency and often beneath the high frequency cut-off. Thus, the subharmonic might have been providing the AN excitation. In order to address this possibility, we needed to know the relationship between EC subharmonics and intracochlear subharmonics—this need motivated the present study. Using the findings described in the present paper, we found that, in some cases, the subharmonics would not have been excitatory, although in other cases they would have been. There were also cases in which no subharmonics were present, and coupled with our first primary finding above, we were confident that subharmonics were not responsible for the excitation in those cases.
Very high SPL stimuli was needed for our auditory nerve study, but is of limited interest for normal hearing, where one is not exposed to such loud sounds, of 110, 120 dB, and louder. However, in the case of high power hearing aids, for example, hearing aids available from Phonak, Siemens, Oticon, and Widex, sound levels in the EC of 130–140 dB SPL are possible. When introduced into the EC, sounds at these levels are likely to generate subharmonics that might be perceived by the user and potentially be confusing. Hearing impaired subjects often have a sloping hearing loss with more loss at high frequencies than at lower frequencies. Their hearing aids will generate high outputs at the frequency region of hearing loss—for example, the hearing aid of a person with 65 dB SPL hearing loss would generate a peak sound level of ~92 dB SPL (Moore et al. 2008). For someone with 85 dB hearing loss, requiring a high power hearing aid, the peak sound level would be ~112 dB SPL. This could lead to subharmonic generation. If the subject has a sloping hearing loss, with relatively good hearing at the subharmonic frequency, the subharmonic might be audible and create interference. Based on our results in gerbil, when a subharmonic is present in the cochlea, it is also present in the EC, and EC measurements could be made in high-power hearing aid users to determine if subharmonics are present.
The emergence of fo/4, or period quadrupling, suggests that the middle ear is a mechanical system that might become chaotic at even higher stimulus levels. It would be interesting to understand the middle ear mechanics behind such a response, perhaps by further explorations of the theoretical system proposed by Pong and Marcaccio (1963), informed by modern measurements of asymmetric TM stiffness (Funnell and Decraemer 1996; Gea et al. 2010; von Unge et al. 1993). In order to make a bridge to the past theoretical predictions, it is straightforward to make a rough comparison of the degree of asymmetric stiffness in human and gerbil. For their theoretical analysis, Pong and Marcaccio used the data of Kobrak (1948), which documented the asymmetric stiffness in human TM. Kobrak found that the stiffness remained symmetric for static pressures of +/−100 Pa, and with that pressure the umbo moved ~ 10 μm. At +/−200 Pa, asymmetry was detected, with the stiffness for positive pressure greater than that of negative pressure by a factor of 1.3. At +/−400 Pa, the stiffness difference had increased to a factor of 2. Pong and Marcaccio approximated these stiffness data as a sum of a linear and a quadratic stiffness. In this analytical approximation to the data, the stiffness difference was a factor of 1.15 at 20 Pa; 20 Pa corresponds to 120 dB SPL and was the level at which subharmonics emerged in their theoretical analysis. For a static 20 Pa pressure, the umbo would have been displaced ~2 μm. In the analysis of Gea et al. (2010) in gerbil, their Figure 10 shows displacement over a very wide pressure range (−2,500 to 2,500 Pa). The interpolation to values less than +/−100 Pa is only approximate. Nevertheless, the same basic trends hold as with the Kobrak result, and at 500 Pa of static pressure, the stiffness for positive EC pressure was roughly twice that for negative EC pressure. Thus, to a first approximation, the analysis and conclusions of Pong and Marcaccio for human TM would also hold for gerbil.
With acoustic stimulation the umbo in gerbil moves ~1 mm/s/Pa over a wide frequency range (de La Rochefoucauld et al. 2010). For a 20-Pa stimulus, this corresponds to ~3 μm at 1 kHz and 0.3 μm at 10 kHz. One would predict that subharmonics would be more prevalent at relatively low frequencies where TM motions are larger for the same EC pressure, but this was not observed. For example, in the results of Figure 5, the subharmonics emerged first at frequencies above 5 kHz, and appeared in a seemingly random subset of stimulus frequencies above 5 kHz. As the stimulus level increased, more subharmonics emerged and were extended to lower frequencies. The TM is known to exhibit complex motion at frequencies above a few kilohertz (de La Rochefoucauld and Olson 2010; Decraemer et al. 1989; Rosowski et al. 2009; Tonndorf and Khanna 1972), and we can speculate that these frequency-dependent motions would excite the asymmetric restoring force at different stimulus levels for different frequencies. The complex motions introduce strain in the region of the attachment of the TM to the manubrium (de La Rochefoucauld and Olson 2010), and this anatomical region might be involved in generating subharmonics. This possibility is consistent with the observation of Dallos and Linnell (1966a) that the EC subharmonics disappeared when the malleus was removed from the manubrium.
In summary, middle ear nonlinearity, including subharmonics, appears at stimulus levels of ~110 dB or greater and thus will not affect normal hearing listeners. However, in hearing impaired listeners and for some experimental questions, stimuli >110 dB are used. The primary objective of this study was an experimental quantification of the relationship between the fo/2 subharmonic responses measured in the EC and within the cochlea. Using the results of this study, a subharmonic measured in the EC can be used to estimate its corresponding intracochlear response.
Acknowledgments
We are grateful to the reviewers and JARO editor for their constructive comments and to Willem F. Decraemer for contributing to the discussion on asymmetric stiffness. These studies were supported by a grant from the NIDCD.
References
- Aerts JRM, Dirckx JJJ. Nonlinearity in eardrum vibration as a function of frequency and sound pressure. Hear Res. 2010;263:26–32. doi: 10.1016/j.heares.2009.12.022. [DOI] [PubMed] [Google Scholar]
- Dallos PJ. On the generation of odd-fractional subharmonics. J Acoust Soc Am. 1966;40:1381–1391. doi: 10.1121/1.1910237. [DOI] [Google Scholar]
- Dallos PJ. Subharmonic squelch effect. J Acoust Soc Am. 1966;40:1264–1264. doi: 10.1121/1.1943117. [DOI] [Google Scholar]
- Dallos PJ, Linnell CO. Even-order subharmonics in the peripheral auditory system. J Acoust Soc Am. 1966;40:561–564. doi: 10.1121/1.1910119. [DOI] [PubMed] [Google Scholar]
- Dallos PJ, Linnell CO. Origin of subharmonics in the peripheral auditory system. J Acoust Soc Am. 1966;39:1252. doi: 10.1121/1.1942862. [DOI] [PubMed] [Google Scholar]
- Dallos PJ, Linnell CO. Subharmonic components in cochlear-microphonic potentials. J Acoust Soc Am. 1966;40:4–11. doi: 10.1121/1.1910063. [DOI] [PubMed] [Google Scholar]
- Rochefoucauld O, Olson ES. A sum of simple and complex motions on the eardrum and manubrium in gerbil. Hear Res. 2010;263:9–15. doi: 10.1016/j.heares.2009.10.014. [DOI] [PMC free article] [PubMed] [Google Scholar]
- Rochefoucauld O, Kachroo P, Olson ES. Ossicular motion related to middle ear transmission delay in gerbil. Hear Res. 2010;270:158–172. doi: 10.1016/j.heares.2010.07.010. [DOI] [PMC free article] [PubMed] [Google Scholar]
- Décory L, Franke RB, Dancer AL. Measurement of the middle ear transfer function in cat, chinchilla and guinea pig. The mechanics and biophysics of hearing. Berlin: Springer; 1990. pp. 270–277. [Google Scholar]
- Decraemer WF, Khanna SM, Funnell WRJ. Interferometric measurement of the amplitude and phase of tympanic membrane vibrations in cat. Hear Res. 1989;38:1–17. doi: 10.1016/0378-5955(89)90123-8. [DOI] [PubMed] [Google Scholar]
- Dong W, Olson ES. Middle ear forward and reverse transmission in gerbil. J Neurophysiol. 2006;95:2951–2961. doi: 10.1152/jn.01214.2005. [DOI] [PubMed] [Google Scholar]
- Dong W, Olson ES. In vivo impedance of the gerbil cochlear partition at auditory frequencies. Biophys J. 2009;97:1233–1243. doi: 10.1016/j.bpj.2009.05.057. [DOI] [PMC free article] [PubMed] [Google Scholar]
- Eldredge DH (1951) Some responses of the ear to high frequency sound. Am Soc Exp Biol Fed Proc A 9:37
- Fitch WT, Neubauer J, Herzel H. Calls out of chaos: the adaptive significance of nonlinear phenomena in mammalian vocal production. Anim Behav. 2002;63:407–418. doi: 10.1006/anbe.2001.1912. [DOI] [Google Scholar]
- Funnell WRJ, Decraemer WF. On the incorporation of moiré shape measurements in finite-element models of the cat eardrum. J Acoust Soc Am. 1996;100:925–932. doi: 10.1121/1.416252. [DOI] [PubMed] [Google Scholar]
- Gea SLR, Decraemer WF, Funnell RWJ, Dirckx JJJ, Maier H. Tympanic membrane boundary deformations derived from static displacements observed with computerized tomography in human and gerbil. JARO - J Assoc Res Otolaryngol. 2010;11:1–17. doi: 10.1007/s10162-009-0192-9. [DOI] [PMC free article] [PubMed] [Google Scholar]
- Guinan JJJ, Peake WT. Middle-ear characteristics of anesthetized cats. J Acoust Soc Am. 1967;41:1237–1261. doi: 10.1121/1.1910465. [DOI] [PubMed] [Google Scholar]
- Huang S, Olson E. Auditory nerve excitation via a non-traveling wave mode of basilar membrane motion. JARO—J Assoc Res Otolaryngol. 2011;12:559–575. doi: 10.1007/s10162-011-0272-5. [DOI] [PMC free article] [PubMed] [Google Scholar]
- Keilson SE, Teich MC, Khanna SM. Models of nonlinear vibration. I. Oscillator with bilinear resistance. Acta Otolaryngol Suppl. 1989;467:241–248. doi: 10.3109/00016488909138344. [DOI] [PubMed] [Google Scholar]
- K.eilson SE, Teich MC, Khanna SM (1989b) Models of nonlinear vibration. III. Oscillator with bilinear mass. Acta Otolaryngol Suppl 467:257–264 [DOI] [PubMed]
- Kobrak HG. Construction material of the sound conduction system of the human ear. J Acoust Soc Am. 1948;20:125–130. doi: 10.1121/1.1906353. [DOI] [Google Scholar]
- Moore BCJ, Stone MA, Fullgrabe C, Glasberg BR, Puria S. Spectro-temporal characteristics of speech at high frequencies, and the potential for restoration of audibility to people with mild-to-moderate hearing loss. Ear Hear. 2008;29:907–922. doi: 10.1097/AUD.0b013e31818246f6. [DOI] [PMC free article] [PubMed] [Google Scholar]
- Olson ES. Observing middle and inner ear mechanics with novel intracochlear pressure sensors. J Acoust Soc Am. 1998;103:3445–3463. doi: 10.1121/1.423083. [DOI] [PubMed] [Google Scholar]
- Olson ES. Intracochlear pressure measurements related to cochlear tuning. J Acoust Soc Am. 2001;110:349–367. doi: 10.1121/1.1369098. [DOI] [PubMed] [Google Scholar]
- Pong W, Marcaccio W. Nonlinearity of the middle ear as a possible source of subharmonics. J Acoust Soc Am. 1963;35:679–681. doi: 10.1121/1.1918585. [DOI] [Google Scholar]
- Puria S. Measurements of human middle ear forward and reverse acoustics: implications for otoacoustic emissions. J Acoust Soc Am. 2003;113:2773–2789. doi: 10.1121/1.1564018. [DOI] [PubMed] [Google Scholar]
- Rosowski JJ, Cheng JT, Ravicz ME, Hulli N, Hernandez-Montes M, Harrington E, Furlong C. Computer-assisted time-averaged holograms of the motion of the surface of the mammalian tympanic membrane with sound stimuli of 0.4–25 kHz. Hear Res. 2009;253:83–96. doi: 10.1016/j.heares.2009.03.010. [DOI] [PMC free article] [PubMed] [Google Scholar]
- Ruggero MA, Narayan SS, Temchin AN, Recio A. Mechanical bases of frequency tuning and neural excitation at the base of the cochlea: Comparison of basilar-membrane vibrations and auditory-nerve-fiber responses in chinchilla. Proc Natl Acad Sci U S A. 2000;97:11744–11750. doi: 10.1073/pnas.97.22.11744. [DOI] [PMC free article] [PubMed] [Google Scholar]
- Slama MCC, Ravicz ME, Rosowski JJ. Middle ear function and cochlear input impedance in chinchilla. J Acoust Soc Am. 2010;127:1397–1410. doi: 10.1121/1.3279830. [DOI] [PMC free article] [PubMed] [Google Scholar]
- Suthers RA, Narins PM, Lin W-Y, Schnitzler H-U, Denzinger A, Xu C-H, Feng AS. Voices of the dead: complex nonlinear vocal signals from the larynx of an ultrasonic frog. J Exp Biol. 2006;209:4984–4993. doi: 10.1242/jeb.02594. [DOI] [PubMed] [Google Scholar]
- Teich MC, Keilson SE, Khanna SM. Models of nonlinear vibration. II. Oscillator with bilinear stiffness. Acta Otolaryngol Suppl. 1989;467:249–256. doi: 10.3109/00016488909138345. [DOI] [PubMed] [Google Scholar]
- Teich M, Heneghan C, Khanna S, Flock Å, Ulfendahl M, Brundin L. Investigating routes to chaos in the guinea-pig cochlea using the continuous wavelet transform and the short-time Fourier transform. Ann Biomed Eng. 1995;23:583–607. doi: 10.1007/BF02584458. [DOI] [PubMed] [Google Scholar]
- Thompson JMT, Stewart HB. Nonlinear dynamics and chaos. New York: Wiley; 2002. [Google Scholar]
- Tonndorf J, Khanna SM. Tympanic-membrane vibrations in human cadaver ears studied by time-averaged holography. J Acoust Soc Am. 1972;52:1221–1233. doi: 10.1121/1.1913236. [DOI] [PubMed] [Google Scholar]
- Usanov D, Mareev O, Skripal’ A, Mareev G, Kamyshanskiĭ A. Acoustic pressure induced period-doubling bifurcations in tympanic membrane oscillations. Tech Phys Lett. 2007;33:939–940. doi: 10.1134/S1063785007110144. [DOI] [Google Scholar]
- Gierke HE. Subharmonics generated in human and animal ears by intense sound. J Acoust Soc Am. 1950;22:675–675. doi: 10.1121/1.1917193. [DOI] [Google Scholar]
- Unge M, Decraemer WF, Bagger-Sjöbäck D, Dirckx JJ. Displacement of the gerbil tympanic membrane under static pressure variations measured with a real-time differential moire interferometer. Hear Res. 1993;70:229–242. doi: 10.1016/0378-5955(93)90161-S. [DOI] [PubMed] [Google Scholar]


