Abstract
Purpose
This study aims to apply longitudinal positron emission tomography (PET) imaging with 18F-Annexin V to visualize and evaluate cell death induced by doxorubicin in a human head and neck squamous cell cancer UM-SCC-22B tumor xenograft model.
Procedures
In vitro toxicity of doxorubicin to UM-SCC-22B cells was determined by a colorimetric assay. Recombinant human Annexin V protein was expressed and purified. The protein was labeled with fluorescein isothiocyanate (FITC) for fluorescence staining and 18F for PET imaging. Established UM-SCC-22B tumors in nude mice were treated with two doses of doxorubicin (10 mg/kg each dose) with 1 day interval. Longitudinal 18F-Annexin V PET was performed at 6 h, 24 h, 3 days, and 7 days after the treatment started. Following PET imaging, direct tissue biodistribution study was performed to confirm the accuracy of PET quantification.
Results
Two doses of doxorubicin effectively inhibited the growth of UM-SCC-22B tumors by inducing cell death including apoptosis. The cell death was clearly visualized by 18F-Annexin V PET. The peak tumor uptake, which was observed at day 3 after treatment started, was significantly higher than that in the untreated tumors (1.56 ± 0.23 vs. 0.89 ± 0.31 %ID/g, p < 0.05). Moreover, the tumor uptake could be blocked by co-injection of excess amount of unlabeled Annexin V protein. At day 7 after treatment, the tumor uptake of 18F-Annexin had returned to baseline level.
Conclusions
18F-Annexin V PET imaging is sensitive enough to allow visualization of doxorubicin induced cell death in UM-SCC-22B xenograft model. The longitudinal imaging with 18F-Annexin will be helpful to monitor early response to chemotherapeutic anti-cancer drugs.
Keywords: 18F-Annexin V, doxorubicin, apoptosis, PET, chemotherapy
Introduction
Most of the chemotherapy agents, including the anthracycline antibiotic doxorubicin [1], cause tumor cell death primarily by induction of apoptosis [2]. Traditionally, apoptosis can be characterized in isolated cells by in vitro methods including DNA laddering and terminal deoxynucleotidyl transferase-mediated dUTP nick-end labeling (TUNEL) [3]. Histological methods play an important role in confirming apoptosis if tissue can be removed from the living system by biopsy or surgery. However, the selection bias and lack of ability to monitor the dynamic process of apoptosis limit the utility of such studies in clinical applications [4]. Therefore, there has been growing interest in the use of non-invasive functional and molecular imaging techniques to observe apoptosis [5].
As the cell undergoes apoptosis, there are a number of steps in the process that may be investigated using very different imaging modalities [6]. Among them, phosphatidylserine (PS) exposure occurs very early in the apoptotic chain of events, preceding such hallmark events as nuclear condensation and DNA laddering. Moreover, PS exposure is a near-universal event in apoptosis, and it presents a very abundant target (millions of binding sites per cell) that is readily accessible on the extracellular face of the plasma membrane [7].
Annexin V, an endogenous human protein with molecular weight of 36 kDa, has a high affinity (kd = 7 nM) for PS binding [8]. Due to the high affinity for apoptotic cells, no immunogenicity, and lack of in vivo toxicity, Annexin V is the dominant probe to detect and image apoptosis [9, 10]. Indeed, Annexin V has been labeled with 125I, 123I, 111In and 99mTc for single-photon emission computed tomography (SPECT) imaging [11, 12]. Clinical trials among patients with various tumor types demonstrated that Annexin V imaging is a promising technique to confirm the onset of apoptosis induced by chemotherapy and radiation therapy [13–15]. For example, 99mTc-Annexin V scintigraphy applied to human tumors after the first course of chemotherapy showed increased tumor uptake proving that apoptosis had been initiated [16].
Compared with SPECT, positron emission tomography (PET) has the advantage that it is more sensitive and quantitative [17]. Annexin V has been labeled with positron emission radioisotopes including 124I [18], 68Ga [19] and 18F [20, 21] for PET imaging. It has been found that apoptosis induced by radiation therapy or chemotherapy could be distinguished with either in vivo imaging or ex vivo autoradiography [19, 20] using these agents. However, in most of the studies, only one time point imaging was performed. We hypothesized here that a longitudinal imaging at multiple time points would be helpful to reflect the dynamic nature of drug induced apoptosis.
In our previous study, we genetically engineered UM-SCC-22B human head and neck squamous cancer cells with a cyclic luciferase, an endogenous apoptosis marker. The apoptosis induced by Doxil was confirmed with multiple imaging strategies including bioluminescence imaging (BLI) and diffusion-weighted magnetic resonance imaging (DW-MRI) [22]. In this study, we applied longitudinal PET imaging to monitor the dynamics of cell death induced by doxorubicin using 18F-Annexin V as imaging agent.
Materials and Methods
Cell line and MTT assay
Human head and neck squamous cell line UM-SCC-22B was acquired from the University of Michigan [23] and cultured in Dulbecco’s modified medium supplemented with 10% (v/v) heat-inactivated FBS, 100 unit/ml penicillin, and 100 µg/ml streptomycin at 37°C in an atmosphere of 5% (v/v) CO2.
The toxicity of doxorubicin to UM-SCC-22B cells was determined by a colorimetric assay with 3-(4, 5-dimethylthiazol-2-yl)-2, 5-diphenyl tetrazolium bromide (MTT; Sigma). All studies were performed with triplicate samples and repeated at least three times. Briefly, cells were harvested by trypsinization, resuspended in DMEM medium, and plated in a 96-well plate at 4,000 or 2,000 cells per well. After treatment with different doses of doxorubicin (ranging from 0.1 nM to 0.5 µM) for 48 h, the culture medium was then replaced and 50 µl of 1.0 mg/ml sterile filtered MTT was added to each well. The unreacted dye was removed after 4 h incubation and the insoluble formazan crystals were dissolved in 150 µl of DMSO. The absorbance at 570 nm (reference wavelength: 630 nm) was measured with a Synergy II multimode microplate reader (BioTech Instruments, VT).
Purification and conjugation of Annexin V protein
Annexin V expressing plasmid was kindly provided by Dr. Seamus J. Martin (The Smurfit Institute, Trinity College, Dublin, Ireland) and Annexin V protein was expressed and purified according to the protocol previously reported [24]. Fluorescein isothiocyanate (FITC, Sigma-Aldrich) was dissolved in anhydrous DMSO immediately before use (3 µl at 10 mg/ml) and then added into Annexin V (500 µg) with a molar ratio of 5:1 in 500 µL borate buffer (20 mM, pH 8.5). The mixture was incubated and rotated at room temperature for 60 min for covalent conjugation. The unreacted dye molecules were removed by PD-10 column (GE Healthcare).
In vitro apoptotic staining
Cells were seed in 24 well plates and treated with doxorubicin (10 µM) for 24 h. After rinsing twice with PBS, the cells were incubated with FITC-Annexin V for 15 min at room temperature. For blocking, 200 µg/ml of unlabeled Annexin V was added 5 min before FITC-Annexin V was added. Then Hoechst 33342 was added to the solution and incubated for another 15 min at room temperature. The cells were rinsed three times and immediately observed with a fluorescence microscope (X81, Olympus).
Synthesis of radioactive materials
2-deoxy-2-[18F]fluoro-D-glucose (18F-FDG) was purchased from the Nuclear Pharmacy of Cardinal Health, and reconstituted with sterile saline. The average radiochemical purity of the product was 98.5% and specific activity was >1,000 Ci/mmol.
N-succinimidyl 4-18F-fluorobenzoate (18F-SFB) was synthesized with a modular system (Eckert & Ziegler Eurotope GmbH) as previously reported [25]. 18F-SFB was redissolved in 10 µl of acetonitrile and an Annexin V (100 µg) solution in 0.1 M NaHCO3 buffer was added. The reaction was incubated at room temperature for 30 min. The reaction mixture was purified with a NAP-5 size exclusion column (GE Healthcare) according to the manufacture’s procedure. The component was eluted with saline to give a fraction containing 18F-Annexin V after the void volume of about 0.75 ml. 18F-Annexin V was assayed by radio-TLC for the presence of small molecule impurities (Rf of 18F-SFB, 0.9; Rf of 18F-Annexin V, 0.09). The specific activity of 18F-Annexin V at the end of synthesis was 1.53 ± 0.66 mCi/nmol (n = 5).
Animal model and treatment plan
All animal studies were conducted in accordance with the principles and procedures outlined in the NRC Guide for the Care and Use of Laboratory Animals and were approved by the Institutional Animal Care and Use Committee (IACUC) of the Clinical Center, National Institutes of Health. The UM-SCC-22B tumor model was generated by subcutaneous injection of 5×10⁶ cells into the right shoulder of female athymic nude mice (Harlan Laboratories). Tumor size was monitored with digital caliper and tumor volume was calculated as vol = ab2/2, where a is the longest diameter and b is the shortest diameter. Two weeks after inoculation, 10 mice each with a volume around 300 mm3 were randomized into two groups. One group (n = 5) received 2 doses of 10 mg/kg of doxorubicin (ALZA Corporation, USA) through intravenous administration with an interval of 1 day. The control group (n = 5) received PBS only. The acute liver apoptosis model was induced by tail vein injection of 10 mg/kg of cycloheximide (Sigma-Aldrich) [26]. Three hours later, PET scans were performed with 18F-Annexin V.
PET imaging
At day 0, 6 hours, day 1, 3, and 7 after treatment initiation, PET scans were performed with the tumor-bearing mice using 18F-Annexin V. Each UM-SCC-22B tumor-bearing mouse, under isoflurane anesthesia, was injected via a tail vein with 3.7 MBq (100 µCi) of 18F-Annexin V. Ten-minute static scans were acquired at 0.5, 1 and 2 h after injection, respectively (n = 5/group). For blocking experiments, 500 µg of unlabeled Annexin V was coinjected with 3.7 MBq (100 µCi, around 3 µg) of 18F-Annexin V, and 10-min static PET images were acquired at 60 min after injection (n = 3) with a dedicated small animal Inveon PET scanner (Preclinical Solution, Siemens). For 18F-FDG scan, mice were maintained under isoflurane anesthesia during the injection, accumulation, and scanning periods and were fasted for 6 h before tracer injection. Body temperature was maintained before and during imaging using a thermostat controlled circulating warm water pad. The images were reconstructed using a two-dimensional ordered-subset expectation maximization (2D OSEM) algorithm without correction for attenuation or scattering. For each scan, regions of interest (ROIs) were drawn over the tumor and major organs using vendor software (ASI Pro 5.2.4.0) on decay-corrected whole-body coronal images. The radioactivity concentrations (accumulation) within the tumors, muscle, liver, and kidneys were obtained from mean pixel values within the multiple ROI volume and then converted to MBq/ml/min using the calibration factor determined for the Inveon PET system. These values were then divided by the administered activity to obtain (assuming a tissue density of 1 g/ml) an image-ROI-derived percent injected dose per gram (%ID/g).
Biodistribution study
Immediately after PET imaging, the tumor-bearing mice were sacrificed and dissected. Blood, tumor, major organs, and tissues were collected and wet-weighed. The radioactivity in the wet whole tissue was measured with a γ-counter (1480 Wizard 3 gamma counter, Perkin–Elmer). The results were expressed as percentage of injected dose per gram of tissue (%ID/g). Values were expressed as mean ± SD for a group of four animals.
Histological staining
Tumor samples were collected and sectioned after the animals were sacrificed. DNA fragmentation was analyzed by terminal deoxynucleotidyl transferase mediated dUTP nick end labeling (TUNEL) assay using a commercial kit (Maxin-Bio) according to the manufacturer's protocol. For the staining of Ki-67, frozen tumor tissue slices were fixed with cold acetone for 20 min and dried in the air for 30 min at room temperature. After blocking with 1% bovine serum albumin for 30 min, slices were incubated with rabbit anti-mouse Ki-67 antibody (1:200; BD Biosciences) and then incubated with Dylight488-conjugated goat anti-rabbit secondary antibody (1:300; Jackson ImmunoResearch Laboratories). After being washed 3 times with PBS, the slices were mounted with 4'-6-diamidino-2-phenylindole (DAPI)-containing mounting medium and observed under an epifluorescence microscope (X81; Olympus). Each experiment was performed in pairs, and the pairs were then repeated twice.
Statistical analysis
The data were described as means ± standard deviation. Student’s t test was applied to compare the statistical difference among groups. P value < 0.05 was considered statistically significant.
Results
Doxorubicin treatment induces apoptosis
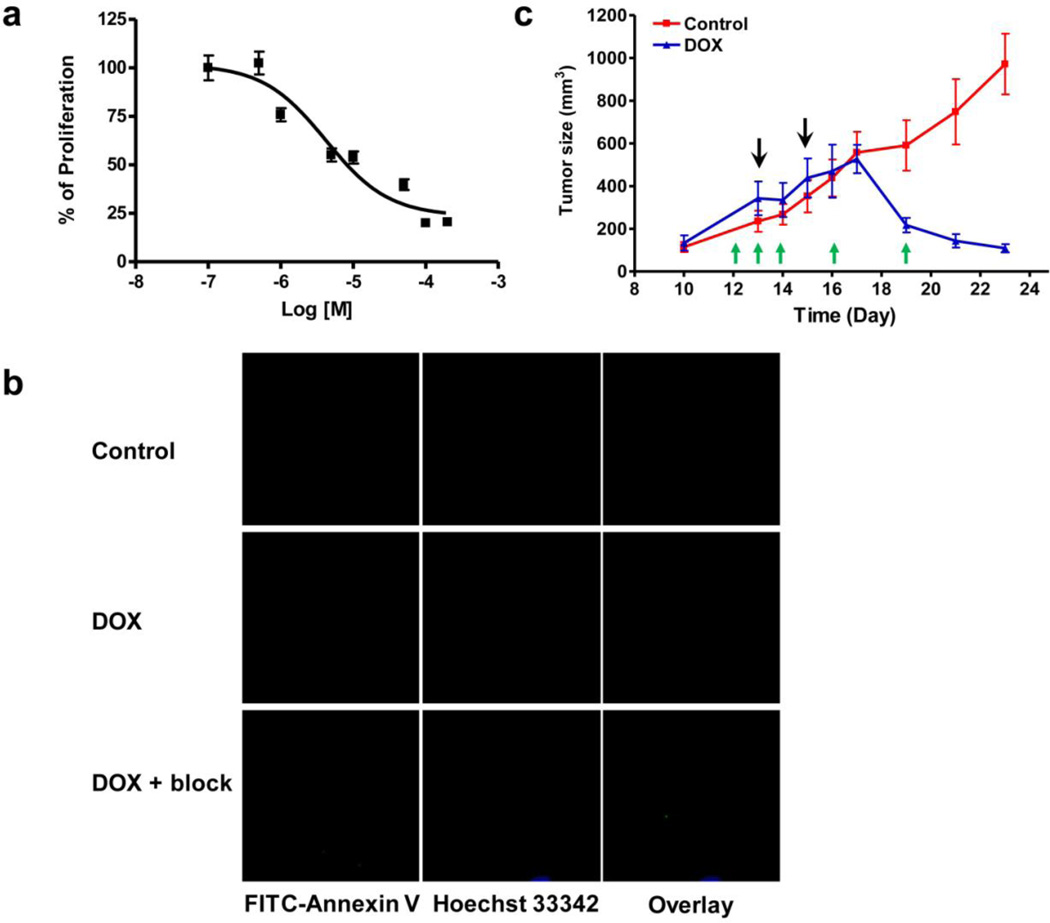
Consistent with our previous study, UM-SCC-22B cells are sensitive to doxorubicin treatment [22]. The IC50 value of doxorubicin to the cells is 10 µM after 24 h incubation (Fig. 1a). Doxorubicin also effectively inhibited the growth of the established UM-SCC-22B tumors in nude mice. After being treated with doxorubicin for 24 h, UM-SCC-22B cells were stained with FITC-Annexin V. The strong green fluorescence signal was identified on the cell membrane of the treated cells but not on the untreated cells (Fig. 1b), indicating doxorubicin treatment induced PS externalization. Besides, the fluorescent signal was effectively blocked by co-incubation with excess amount of unlabeled Annexin V. As shown in Fig.1c, at day 7 with two doses of 10 mg/kg of doxorubicin treatment, the tumor size in the treated group was significantly smaller than that in control group (p < 0.01). Some tumors in the treated group were completely cured. It has been demonstrated previously that the tumor growth inhibition was apoptosis related [22].
Fig. 1.
Doxorubicin treatment induces apoptosis in UM-SCVC-22B cells ant tumors. a Cytotoxicty of doxorubicin on UM-SCC-22B cells determined by MTT assay. The IC50 is determined as 10 µM after 24 hr incubation. b Fluorescence staining of UM-SCC-22B cells with FITC-Annexin V (green) after treatment with doxorubicin for 24 hr. The cells were co-stained with Hoechst 33342 (blue) for nuclei presentation. c The growth of UM-SCC-22B tumors was effectively inhibited by doxorubicin. The black arrows indicate the time for the two doses of doxorubicin (10 mg/kg for each dose). The green arrows indicate the time for PET imaging studies using 18F-Annexin V.
18F-Annexin V PET imaging
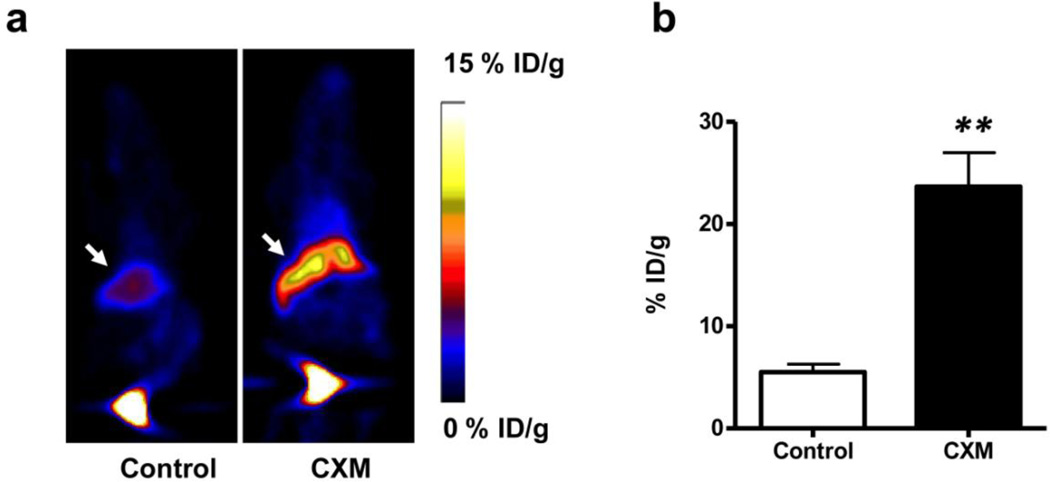
After radiolabeling of Annexin V protein with 18F, we first applied the tracer in a well-established acute liver apoptosis model [21]. Three mice were injected with cycloheximide (10 mg/kg) to induce apoptosis in the liver before imaging. Three hours later, about 3.7 MBq of 18F-Annexin V was administered via tail vein for PET imaging. As shown in Fig. 2, significantly higher uptake of 18F-Annexin V was observed in the treated liver than in the liver of the untreated control animals. The liver of the control mice showed a tracer uptake of 5.51 ± 0.77 % ID/g while the liver of the treated mice showed a tracer uptake of 23.66 ± 3.33 %ID/g (p < 0.001). A 4.29-fold increase was observed, which is consistent with previously reported data [27].
Fig. 2.
Small animal PET imaging of liver apoptosis. a Typical decay-corrected whole-body coronal images are shown with liver indicated by white arrows. The acute liver apoptosis model was established by i.v. injection of cycloheximide (CXM, 10 mg/kg). b Liver uptake of 18F-Annexin V was quantified from PET scans (n = 3). CXM treated mice show significantly higher liver uptake of 18F-Annexin V than untreated mice (p < 0.001).
It is well-known that apoptosis is a dynamic process, especially in the tumor environment [6]. With the UM-SCC-22B model, we performed PET imaging at different time points following the initiation of treatment. PET images demonstrated that 18F-Annexin V was excreted from both hepatic and renal urinary routes, reflected by both high liver and kidney accumulations of the radioactivity. As shown in Table 1, within 2 hrs, the kidney uptake was decreased from 19.2 ± 10.2 %ID/g to 2.57 ± 0.32 %ID/g and liver uptake from 10.4 ± 3.50 %ID/g to 2.43 ± 0.49 % ID/g. Based on the major organs uptake and ratios of tumor/non-tumor, we selected 1 h time point for the quantification of longitudinal PET images.
Table 1.
Decay-corrected in vivo distribution of 18F-Annexin V in UM-SCC-22B tumor bearing mice quantified by PET imaging (n = 9).
| Organ | 30 min | 60 min | 120 min |
|---|---|---|---|
| Kidneys | 19.2 ± 10.2 | 7.57 ± 3.08 | 2.57 ± 0.32 |
| Liver | 10.4 ± 3.50 | 5.23 ± 2.37 | 2.43 ± 0.49 |
| Blood* | 2.98 ± 0.56 | 1.77 ± 0.46 | 0.85 ± 0.12 |
| Tumor | 1.52 ± 0.31 | 1.04 ± 0.26 | 0.59 ± 0.08 |
| Muscle | 0.69 ± 0.17 | 0.52 ± 0.24 | 0.23 ± 0.06 |
| T/K | 0.09 ± 0.03 | 0.15 ± 0.03 | 0.23 ± 0.04 |
| T/L | 0.15 ± 0.04 | 0.19 ± 0.01 | 0.25 ± 0.07 |
| T/B | 0.51 ± 0.08 | 0.59 ± 0.06 | 0.71 ± 0.14 |
| T/M | 2.27 ± 0.53 | 2.20 ± 0.67 | 2.76 ± 0.82 |
The results were presented as mean ± SD (n = 9). Uptake is expressed in %ID/g tissue. Tumor/non-tumor ratios are unitless.
Radioactivity in blood was determined by ROI over heart.
T, tumor; K, Kidneys; L, Liver; B, Blood; M, Muscle.
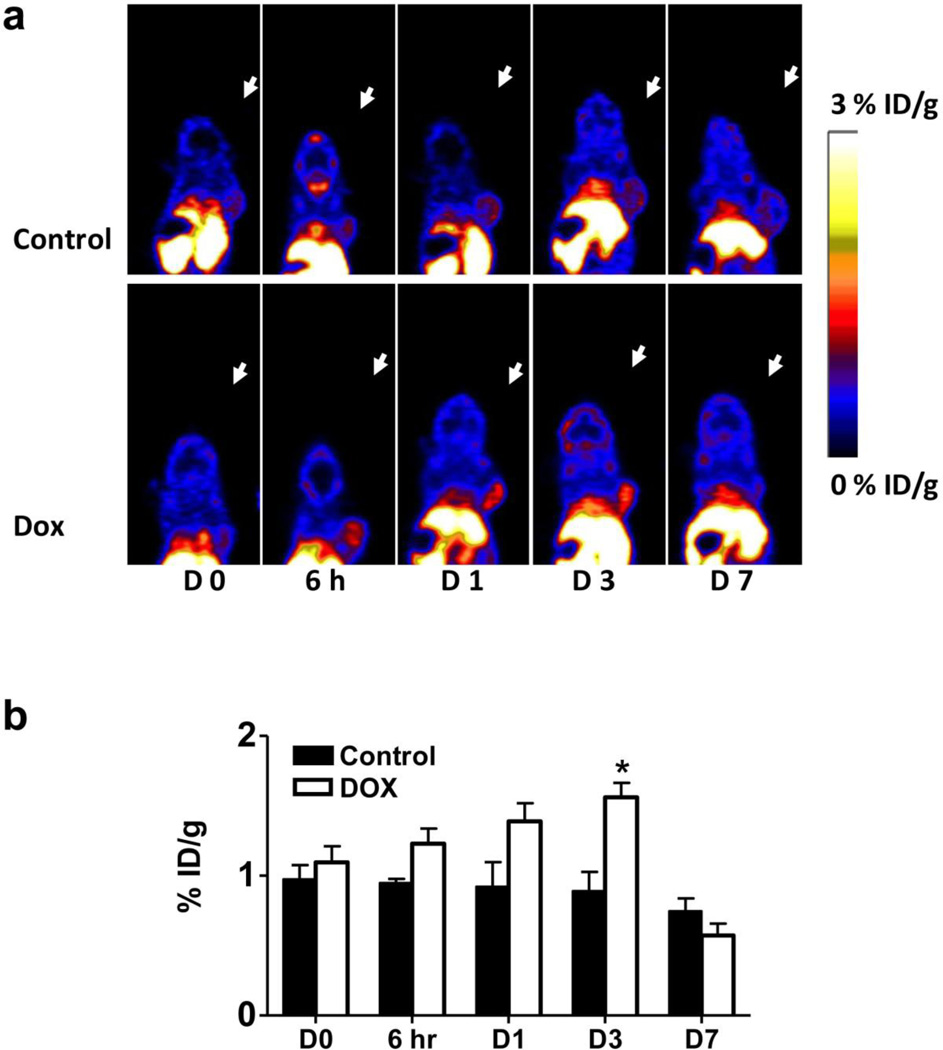
The tumor uptake in the control group barely exceeded the background, primarily due to the high perfusion and permeability of the tumor vasculature. At baseline, the tumors showed a tracer uptake of 0.97 ± 0.23 %ID/g (day 0). After treatment with doxorubicin, the tumor uptake of 18F-Annexin V increased with time. As early as 6 hr after therapy, a trend of increased tumor uptake was already observed in the treated group which failed to meet our requirement for statistical significance (p = 0.057). At day 3, the treated tumors showed a tracer uptake of 1.56 ± 0.23 % ID/g, which was significantly higher than control tumors (0.89 ± 0.31 %ID/g. p < 0.05). At day 7 after treatment, the difference between the two groups disappeared (Fig. 3).
Fig. 3.
18F-Annexin V PET imaging of UM-SCC-22B tumor bearing mice with or without doxorubicin treatment. a Representative decay corrected whole body coronal PET images at different time points after treatment started are shown. 18F-Annexin V (3.7 MBq, 100 µCi) was injected via tail vein and ten-minute static scans were acquired at 1 h after injection. Tumors are indicated by arrows. b Tumor uptake of 18F-Annexin V was quantified from PET scans (n=5). After doxorubicin treatment, tumor uptake increased to a peak at day 3 after treatment started (p < 0.05).
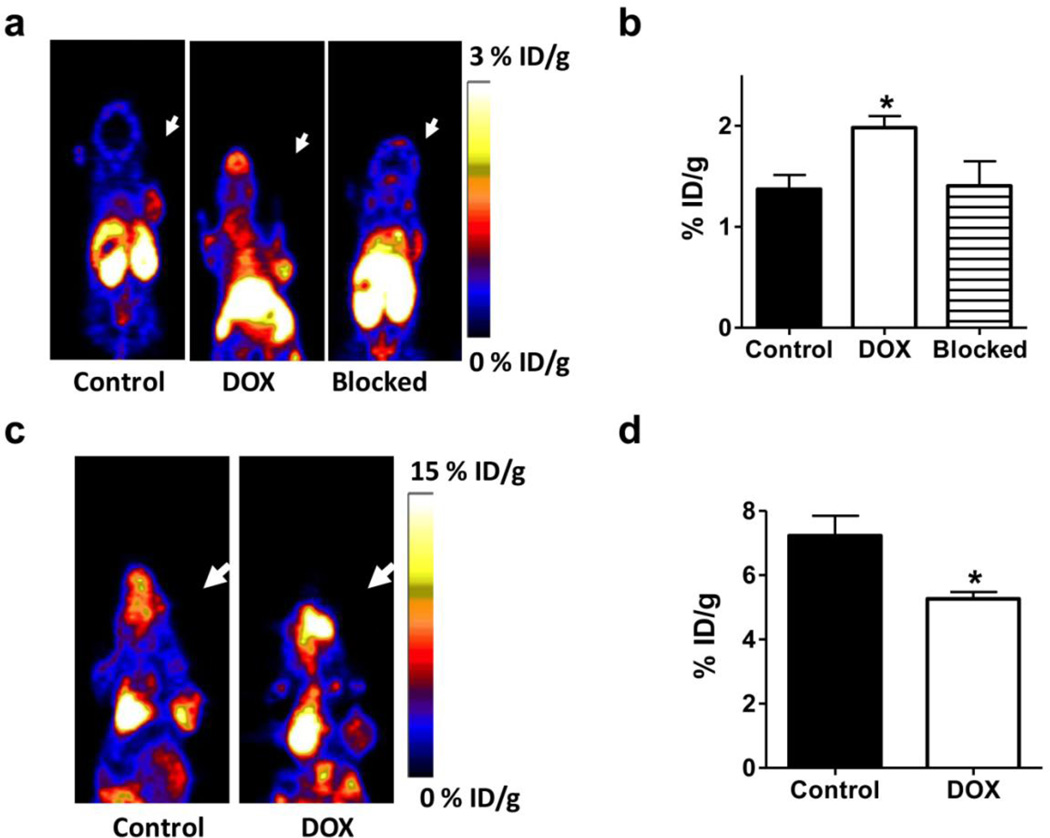
In order to confirm the specificity of tumor uptake of 18F-Annexin V, another set of mice were treated with doxorubicin with the same dose and time interval. At day 3 after treatment, animals underwent PET imaging using 18F-Annexin V with or without a blocking dose of unlableled Annexin V (500 µg per mouse). The tumor uptake of 18F-Annexin V was partially blocked with extra amount of unlabeled protein (1.98 ± 0.26 vs. 1.41 ± 0.54 % ID/g, p < 0.05) (Fig. 4a & b).
Fig. 4.
a Representative decay corrected whole body coronal PET images at day 3 after treatment started. 18F-Annexin V (3.7 MBq, 100 µCi, around 3 µg) was injected via tail vein and ten-minute static scans were acquired at 1 h after injection (n=5). For blocking experiments, 500 µg of unlabeled Annexin V was coinjected with 3.7 MBq (100 µCi) of 18F-Annexin V (n = 3). Tumors were indicated with arrows. b Tumor uptake of 18F-Annexin V was quantified by PET images. With excess unlabeled Annexin V, the tumor uptake of 18F-Annexin V could be blocked (p < 0.05). c & d PET imaging of doxorubicin treated UM-SCC-22B tumor bearing mice at day 3 after treatment started using 18F-FDG. The mice were maintained under isoflurane anesthesia during the injection, accumulation, and scanning periods and were fasted for 6 h before tracer injection. 18F-FDG uptake in doxorubicin treated tumors was significantly lower than that in control tumors (n =5, p< 0.05).
18F-FDG PET imaging
We also performed PET imaging using 18F-FDG to evaluate tumor metabolism changes after doxorubicin treatment [28]. The tumors were clearly visualized on PET images and the uptake of 18F-FDG of control tumors was 7.23 ± 1.88 %ID/g (Fig. 4c & d). At day 3 after doxorubicin treatment, 18F-FDG uptake decreased significantly to 5.26 ± 0.46 %ID/g (p < 0.05).
Biodistribution of 18F-Annexin V
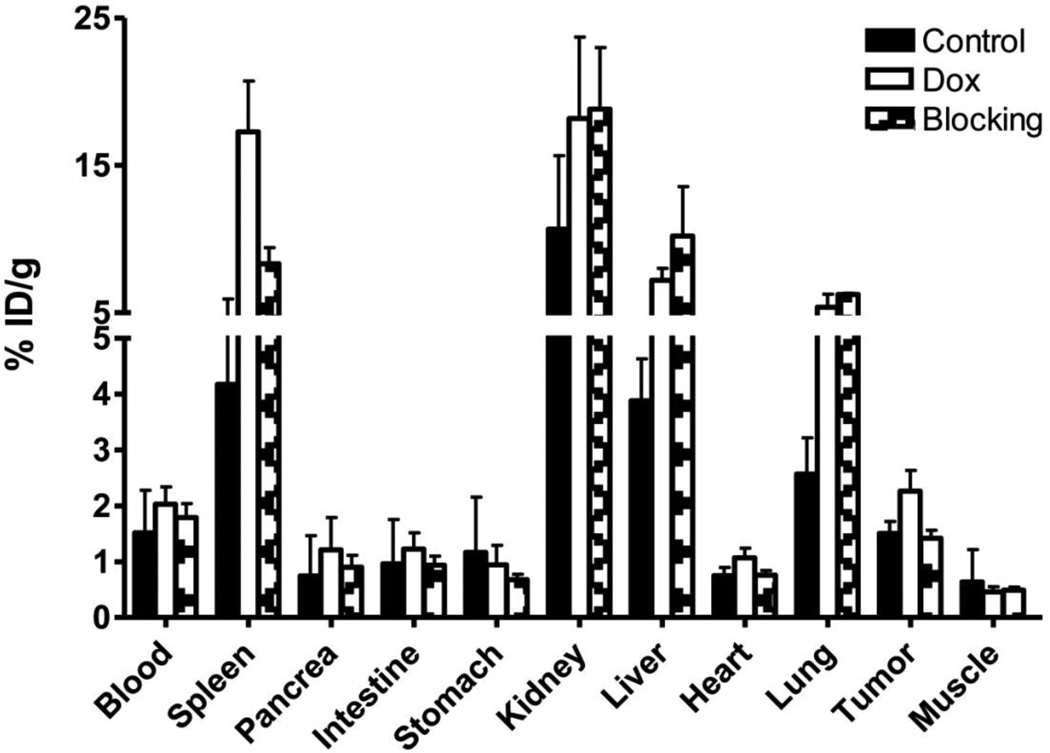
In order to further confirm the PET imaging quantification, the biodistribution of 18F-Annexin V was evaluated in tumor-bearing nude mice immediately after PET imaging. As shown in Fig. 5, the tumor uptakes were 1.51 ± 0.21, 2.26 ± 0.37 and 1.42 ± 0.25 %ID/g in the control, treated and blocked group, respectively. As shown on PET images, both liver and kidneys showed high radioactivity uptake. It is worth noting that the tracer uptake in spleen increased dramatically from 4.17 ± 1.53 %ID/g in the control group to 17.28 ± 3.45 %ID/g in the treatment group. After blocking, the spleen uptake decreased to 8.32 ± 1.90 %ID/g. At 1 hr after tracer injection, the radioactivity in blood circulation remained relative high, with %ID/g value around 3 in all groups.
Fig. 5.
Biodistribution of 18F-Annexin V at 1 hr after injection in UM-SCC-22B tumor bearing nude mice. The mice have been treated with 2 doses of doxorubicin with 10 mg/kg for each dose. At day 3 after treatment started, mice were injected intravenously with 3.7 MBq (100 µCi) of 18F-Annexin V alone (n=5) or with 500 µg of unlabeled Annexin V (n=3). Data are presented as mean %ID/g ± SD.
Histological staining
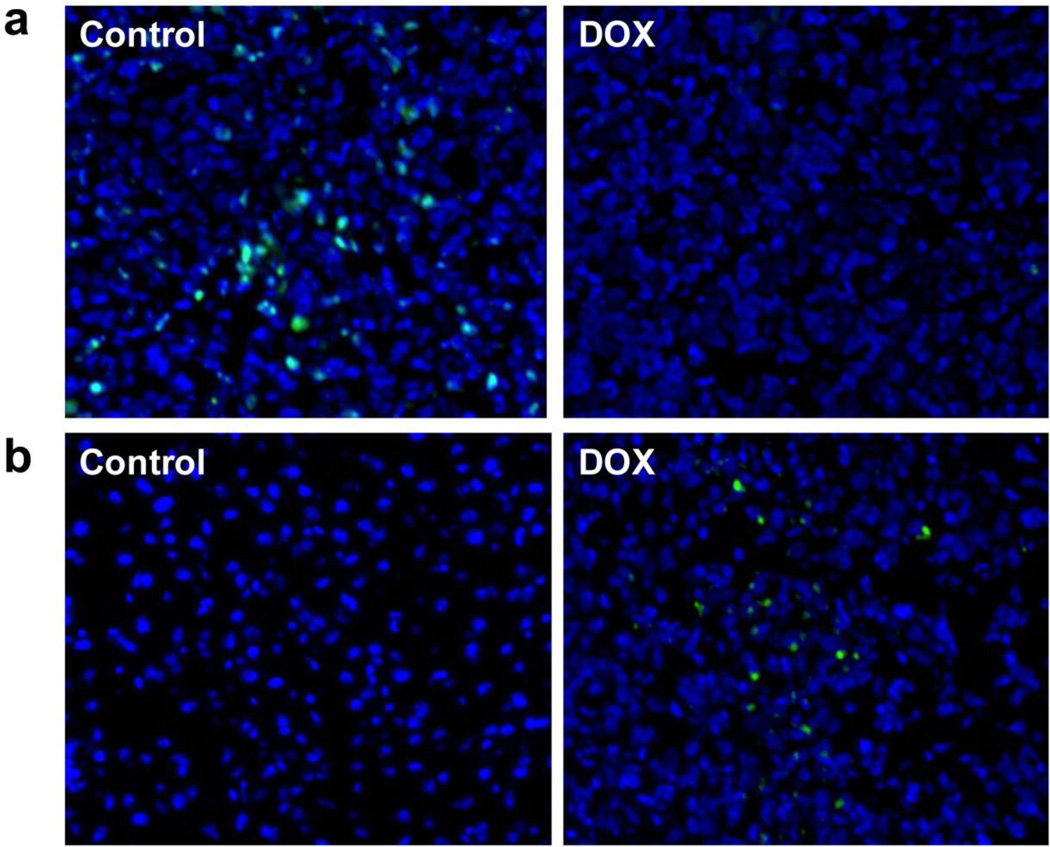
At day 3 after treatment started, the treated tumors showed significant increased uptake of 18F-Annexin V, although the tumor size showed no apparent change. We collected tumor samples and performed Ki-67 staining to evaluate tumor proliferation and TUNEL staining to determine the DNA damage. As shown in Fig. 6a, in the control tumor sections, a relatively high percentage of cells were stained positively for Ki-67. Significantly reduced cell proliferation was observed in the doxorubicin treated tumor. A TUNEL assay is one of the traditional in vitro methods to characterize cell apoptosis, and TUNEL-positive nuclei confirm DNA fragmentation. Compared to the control group, the group that received 2 doses of doxorubicin treatment showed significantly more cell apoptosis (Fig. 6b).
Fig. 6.
Histologic analyis of tumor response to doxorubicin. a Proliferation of UM-SCC-22B tumor cells at day 3 after doxorubicin treatment as assessed by Ki-67 immunofluorescence staining. Ki-67 are shown in green. Normal cell nuclei are shown in blue, stained by DAPI. b TUNEL staining of UM-SCC-22B tumor section after treatment with doxorubicin. Apoptotic nuclei are shown in green. Normal cell nuclei are shown in blue, stained by DAPI.
Discussion
The early assessment of tumor response is of tremendous, but substantially unmet, need to assist oncologists to manage the quality of patient life versus intensive chemotherapy [29, 30]. Owing to high binding affinity with PS, Annexin V has been widely used as an imaging probe for non-invasive molecular imaging of apoptosis. However, an optimal imaging time frame following initiation of treatment still needs to be determined due to the dynamic nature of apoptosis. In this preclinical study with an established tumor apoptosis model, we determined the optimal imaging time point to reflect tumor early response of tumors to doxorubicin with longitudinal PET imaging using 18F-Annexin V.
Annexin V could be conjugated with an average of two mole equivalents of fluorobenzoate (FBA) without decreasing its affinity for red blood cells with exposed PS. However, an average conjugation of 7.7 decreased the binding by 3-fold [31]. In this study, we used 18F-SFB as the prosthetic group for Annexin V labeling and the average specific activity of 18F-Annexin V was 1.53 ± 0.66 mCi/nmol (n=5). Thus, on average only one FB group was present on each Annexin V protein, which will not affect its binding affinity.
The treatment and imaging schedule was presented in Fig. 1B. We treated the UM-SCC-22B tumors with two doses of doxorubicin at one day interval and imaged the mice at day 0, 6 hr, day 1, 3 and 7 after treatment started. The results showed tumor uptake of 18F-Annexin V increased as early as at 6 hour after therapy and peaked at day 3. It is interesting to note that the tumor size showed no significant change at day 3 after therapy started, indicating the increase of 18F-Annexin V uptake in tumors precedes the size change. Moreover, the cell toxicity also has been confirmed by Ki-67 staining and TUNEL staining.
It has been pointed out that Annexin V uptake by tumor cells heavily depends on the exact time after the start of chemotherapy and there might be two peaks of Annexin V uptake. One occurs early within several hours and another probably appears in 24–72 hours after the treatment [32]. However, our data demonstrated that the cell death induced by doxorubicin occurred in a different pattern. It appears that cell death in doxorubicin treated UM-SCC-22B tumors occurs very soon after treatment begins and persists for several days. Tumor growth curves showed complete eradication of several tumors by day 7.
Using apoptosis reporter gene BLI imaging, we observed strong caspase 3 activity in Doxil treated tumors at day 5 after therapy initiation [22]. Thus, we speculate that at least in the current model, the ratio of apoptotic cells among the tumor kept increasing with time within the first several days. At day 7, the treated tumor showed decreased Annexin V uptake, partially due to the removal of the majority of apoptotic and necrotic cells. However, we cannot exclude the possibility that disruption of the tumor vasculature affected the delivery of the tracer to tumor region.
When untreated, even if the tumors grow to a size around 600 to 800 mm3, there is no apparent apoptosis or necrosis, which is confirmed by both optical and PET imaging [22] (Fig. 3). It is worthy of note that UM-SCC-22B tumors are highly vascularized with high permeability [33, 34]. Consequently, 18F-Annexin V showed a tumor uptake of 1.04 ± 0.26 %ID/g in untreated tumors, which is mostly likely attributed to the non-specific accumulation of 18F-Annexin V. Thus, further studies will expand to more tumor models with various vascularization and receiving different therapeutic interventions.
Besides tumors, we found that the tracer uptake in spleen increased dramatically in treated group compared with that in the control group (17.28 ± 3.45 vs. 4.17 ± 1.53 %ID/g, p < 0.01), which reflected the toxicity of doxorubicin. Increased spleen and bone marrow uptake of Annexin V has been observed in a rat model treated with cyclophosphamide [35]. One possible explanation is that doxorubicin exerted toxic effect on bone marrow and hematopoietic progenitor cells. Consequently, damaged blood cells were captured by spleen. Specific binding of 18F-Annexin V to those cells resulted in high radioactivity uptake in spleen. The spleen uptake could be blocked by an excess amount of unlabeled Annexin V protein, further confirming the specific binding of 18F-Annexin V to apoptotic cells.
Decreased 18F-FDG uptake in tumor at day 3 after treatment reflected the decreased tumor metabolism and growth inhibition, which was confirmed by the tumor growth curve retrospectively (Fig. 1b). With a different drug and different tumor model, we have observed different 18F-FDG PET imaging results. For example, contrary to these results, we have observed that 18F-FDG uptake increased at day 3 after paclitaxel therapy in a MDA-MB-435 tumor model resulting from inflammation and white blood cell infiltration [28].
Conclusion
18F-Annexin V PET imaging allows sensitive visualization of cell death induced by doxorubicin treatment. The longitudinal imaging with 18F-Annexin will be helpful to monitor tumor response to chemotherapy at early stage when used alone or combined with other molecular imaging modalities.
Acknowledgment
This project was supported by the Intramural Research Program of the National Institute of Biomedical Imaging and Bioengineering (NIBIB), National Institutes of Health (NIH) and the International Cooperative Program of the National Science Foundation of China (NSFC) (81028009).
Footnotes
Conflict of Interest
The authors declare they have no conflicts of interest.
References
- 1.Young RC, Ozols RF, Myers CE. The anthracycline antineoplastic drugs. N Engl J Med. 1981;305:139–153. doi: 10.1056/NEJM198107163050305. [DOI] [PubMed] [Google Scholar]
- 2.Evan GI, Vousden KH. Proliferation, cell cycle and apoptosis in cancer. Nature. 2001;411:342–348. doi: 10.1038/35077213. [DOI] [PubMed] [Google Scholar]
- 3.Otsuki Y, Li Z, Shibata MA. Apoptotic detection methods--from morphology to gene. Prog Histochem Cytochem. 2003;38:275–339. doi: 10.1016/s0079-6336(03)80002-5. [DOI] [PubMed] [Google Scholar]
- 4.Massoud TF, Gambhir SS. Integrating noninvasive molecular imaging into molecular medicine: an evolving paradigm. Trends Mol Med. 2007;13:183–191. doi: 10.1016/j.molmed.2007.03.003. [DOI] [PubMed] [Google Scholar]
- 5.Seddon BM, Workman P. The role of functional and molecular imaging in cancer drug discovery and development. Br J Radiol. 2003;76(Spec No 2):S128–S138. doi: 10.1259/bjr/27373639. [DOI] [PubMed] [Google Scholar]
- 6.Niu G, Chen X. Apoptosis imaging: beyond annexin V. J Nucl Med. 2010;51:1659–1662. doi: 10.2967/jnumed.110.078584. [DOI] [PubMed] [Google Scholar]
- 7.Blankenberg FG, Katsikis PD, Tait JF, et al. In vivo detection and imaging of phosphatidylserine expression during programmed cell death. Proc Natl Acad Sci U S A. 1998;95:6349–6354. doi: 10.1073/pnas.95.11.6349. [DOI] [PMC free article] [PubMed] [Google Scholar]
- 8.Tait JF, Cerqueira MD, Dewhurst TA, et al. Evaluation of annexin V as a platelet-directed thrombus targeting agent. Thromb Res. 1994;75:491–501. doi: 10.1016/0049-3848(94)90224-0. [DOI] [PubMed] [Google Scholar]
- 9.Blankenberg FG, Katsikis PD, Tait JF, et al. Imaging of apoptosis (programmed cell death) with 99mTc annexin V. J Nucl Med. 1999;40:184–191. [PubMed] [Google Scholar]
- 10.Lahorte CM, Vanderheyden JL, Steinmetz N, et al. Apoptosis-detecting radioligands: current state of the art and future perspectives. Eur J Nucl Med Mol Imaging. 2004;31:887–919. doi: 10.1007/s00259-004-1555-4. [DOI] [PubMed] [Google Scholar]
- 11.Ohtsuki K, Akashi K, Aoka Y, et al. Technetium-99m HYNIC-annexin V: a potential radiopharmaceutical for the in-vivo detection of apoptosis. Eur J Nucl Med. 1999;26:1251–1258. doi: 10.1007/s002590050580. [DOI] [PubMed] [Google Scholar]
- 12.Ke S, Wen X, Wu QP, et al. Imaging taxane-induced tumor apoptosis using PEGylated: 111In-labeled annexin V. J Nucl Med. 2004;45:108–115. [PubMed] [Google Scholar]
- 13.Haas RL, de Jong D, Valdes Olmos RA, et al. In vivo imaging of radiation-induced apoptosis in follicular lymphoma patients. Int J Radiat Oncol Biol Phys. 2004;59:782–787. doi: 10.1016/j.ijrobp.2003.11.017. [DOI] [PubMed] [Google Scholar]
- 14.Kurihara H, Yang DJ, Cristofanilli M, et al. Imaging and dosimetry of 99mTc EC annexin V: preliminary clinical study targeting apoptosis in breast tumors. Appl Radiat Isot. 2008;66:1175–1182. doi: 10.1016/j.apradiso.2008.01.012. [DOI] [PMC free article] [PubMed] [Google Scholar]
- 15.Kartachova M, Haas RL, Olmos RA, et al. In vivo imaging of apoptosis by 99mTc-Annexin V scintigraphy: visual analysis in relation to treatment response. Radiother Oncol. 2004;72:333–339. doi: 10.1016/j.radonc.2004.07.008. [DOI] [PubMed] [Google Scholar]
- 16.Belhocine T, Steinmetz N, Hustinx R, et al. Increased uptake of the apoptosis-imaging agent (99m)Tc recombinant human Annexin V in human tumors after one course of chemotherapy as a predictor of tumor response and patient prognosis. Clin Cancer Res. 2002;8:2766–2774. [PubMed] [Google Scholar]
- 17.Niu G, Cai W, Chen X. Molecular imaging of human epidermal growth factor receptor 2 (HER-2) expression. Front Biosci. 2008;13:790–805. doi: 10.2741/2720. [DOI] [PubMed] [Google Scholar]
- 18.Glaser M, Collingridge DR, Aboagye EO, et al. Iodine-124 labelled annexin-V as a potential radiotracer to study apoptosis using positron emission tomography. Appl Radiat Isot. 2003;58:55–62. doi: 10.1016/s0969-8043(02)00239-7. [DOI] [PubMed] [Google Scholar]
- 19.Bauwens M, De Saint-Hubert M, Devos E, et al. Site-specific 68Ga-labeled Annexin A5 as a PET imaging agent for apoptosis. Nucl Med Biol. 2011;38:381–392. doi: 10.1016/j.nucmedbio.2010.09.008. [DOI] [PubMed] [Google Scholar]
- 20.Murakami Y, Takamatsu H, Taki J, et al. 18F-labelled annexin V: a PET tracer for apoptosis imaging. Eur J Nucl Med Mol Imaging. 2004;31:469–474. doi: 10.1007/s00259-003-1378-8. [DOI] [PubMed] [Google Scholar]
- 21.Yagle KJ, Eary JF, Tait JF, et al. Evaluation of 18F-annexin V as a PET imaging agent in an animal model of apoptosis. J Nucl Med. 2005;46:658–666. [PubMed] [Google Scholar]
- 22.Zhang F, Zhu L, Liu G, et al. Multimodality imaging of tumor response to doxil. Theranostics. 2011;1:302–309. doi: 10.7150/thno/v01p0302. [DOI] [PMC free article] [PubMed] [Google Scholar]
- 23.Carey TE, Van Dyke DL, Worsham MJ, et al. Characterization of human laryngeal primary and metastatic squamous cell carcinoma cell lines UM-SCC-17A and UM-SCC-17B. Cancer Res. 1989;49:6098–6107. [PubMed] [Google Scholar]
- 24.Logue SE, Elgendy M, Martin SJ. Expression, purification and use of recombinant annexin V for the detection of apoptotic cells. Nat Protoc. 2009;4:1383–1395. doi: 10.1038/nprot.2009.143. [DOI] [PubMed] [Google Scholar]
- 25.Jacobson O, Weiss ID, Kiesewetter DO, et al. PET of tumor CXCR4 expression with 4-18F-T140. J Nucl Med. 2010;51:1796–1804. doi: 10.2967/jnumed.110.079418. [DOI] [PMC free article] [PubMed] [Google Scholar]
- 26.Beer AJ, Kessler H, Wester HJ, et al. PET imaging of integrin alphavbeta3 expression. Theranostics. 2011;1:48–57. doi: 10.7150/thno/v01p0048. [DOI] [PMC free article] [PubMed] [Google Scholar]
- 27.De Saint-Hubert M, Mottaghy FM, Vunckx K, et al. Site-specific labeling of 'second generation' annexin V with 99mTc(CO)3 for improved imaging of apoptosis in vivo. Bioorg Med Chem. 2010;18:1356–1363. doi: 10.1016/j.bmc.2009.12.021. [DOI] [PubMed] [Google Scholar]
- 28.Sun X, Yan Y, Liu S, et al. 18F-FPPRGD2 and 18F-FDG PET of response to Abraxane therapy. J Nucl Med. 2010;52:140–146. doi: 10.2967/jnumed.110.080606. [DOI] [PubMed] [Google Scholar]
- 29.Therasse P, Arbuck SG, Eisenhauer EA, et al. New guidelines to evaluate the response to treatment in solid tumors. European Organization for Research and Treatment of Cancer, National Cancer Institute of the United States, National Cancer Institute of Canada. J Natl Cancer Inst. 2000;92:205–216. doi: 10.1093/jnci/92.3.205. [DOI] [PubMed] [Google Scholar]
- 30.Green AM, Steinmetz ND. Monitoring apoptosis in real time. Cancer J. 2002;8:82–92. doi: 10.1097/00130404-200203000-00002. [DOI] [PubMed] [Google Scholar]
- 31.Grierson JR, Yagle KJ, Eary JF, et al. Production of [F-18]fluoroannexin for imaging apoptosis with PET. Bioconjug Chem. 2004;15:373–379. doi: 10.1021/bc0300394. [DOI] [PubMed] [Google Scholar]
- 32.Blankenberg F. To scan or not to scan, it is a question of timing: technetium-99m-annexin V radionuclide imaging assessment of treatment efficacy after one course of chemotherapy. Clin Cancer Res. 2002;8:2757–2758. [PubMed] [Google Scholar]
- 33.Niu G, Li Z, Xie J, et al. PET of EGFR antibody distribution in head and neck squamous cell carcinoma models. J Nucl Med. 2009;50:1116–1123. doi: 10.2967/jnumed.109.061820. [DOI] [PMC free article] [PubMed] [Google Scholar]
- 34.Niu G, Sun X, Cao Q, et al. Cetuximab-based immunotherapy and radioimmunotherapy of head and neck squamous cell carcinoma. Clin Cancer Res. 2010;16:2095–2105. doi: 10.1158/1078-0432.CCR-09-2495. [DOI] [PMC free article] [PubMed] [Google Scholar]
- 35.Blankenberg FG, Naumovski L, Tait JF, et al. Imaging cyclophosphamide-induced intramedullary apoptosis in rats using 99mTc-radiolabeled annexin V. J Nucl Med. 2001;42:309–316. [PubMed] [Google Scholar]


