

Abstract
Background
Prior studies have suggested using a panel of biomarkers that measure diverse biological processes as a prognostic tool in chronic heart failure. Whether this approach improves risk prediction beyond clinical evaluation is unknown.
Methods and Results
In a multi-center cohort of 1513 chronic systolic heart failure patients, we measured a contemporary biomarker panel consisting of: high-sensitivity C-reactive protein (hsCRP), myeloperoxidase (MPO), B-type natriuretic peptide (BNP), soluble fms-like tyrosine kinase receptor-1 (sFlt-1), troponin I (TnI), soluble toll-like receptor-2 (ST2), creatinine, and uric acid. From this panel, we calculated a parsimonious multimarker score and assessed its performance in predicting risk of death, cardiac transplantation, or ventricular assist device (VAD) placement in comparison to an established clinical risk score, the Seattle Heart Failure Model (SHFM). During a median followup of 2.5 years, there were a total of 317 outcomes: 187 patients died; 99 were transplanted; and 31 had a VAD placed. In unadjusted Cox models, patients in the highest tertile of the multimarker score had a 13.7-fold increased risk of adverse outcomes compared to the lowest tertile (95%CI 8.75-21.5). These effects were independent of the SHFM (adjusted HR 6.80,95%CI 4.18-11.1). Addition of the multimarker score to the SHFM led to a significantly improved AUC of 0.803 versus 0.756 (p=0.003) and appropriately reclassified a significant number of patients who experienced the outcome into a higher risk category (NRI 25.2%,95%CI 14.2-36.2%,p<0.001).
Conclusions
In ambulatory chronic heart failure patients, a score derived from multiple biomarkers integrating diverse biologic pathways substantially improves prediction of adverse events beyond current metrics.
Keywords: biomarkers, chronic heart failure
Heart failure is a major public health burden that accounts for at least 290,000 deaths in the US alone each year.1 There is substantial variation in the severity and prognosis of heart failure, ranging from mild disease that is easily managed with neurohormonal blockade to advanced illness requiring therapy with mechanical support or heart transplantation.2 Accurate assessment of prognosis is critical to guide clinical management, and to identify high risk patients who should be considered for advanced therapy. Although established predictors such as the New York Heart Association (NYHA) Class, left ventricular ejection fraction (LVEF), natriuretic peptide levels, and risk scores such as the Seattle Heart Failure Model (SHFM) exist, they do not fully explain the risk of adverse outcomes in ambulatory chronic heart failure patients.2
The progression of heart failure is complex and is driven by multiple biologic processes, including inflammation, oxidative stress, neurohormonal activation, vascular remodeling, myocyte injury, and renal impairment.3 As such, there has been growing interest in the measurement of a diverse biomarker profile, reflective of the underlying biology of heart failure, as a means to risk-stratify patients and improve our understanding of the underlying pathophysiology.4 We therefore evaluated the predictive utility of 8 biomarkers, reflective of diverse biologic pathways in heart failure: high-sensitivity C-reactive protein (hsCRP) (inflammation), uric acid and myeloperoxidase (MPO) (oxidative stress), B-type natriuretic peptide (BNP) (neurohormonal activation), soluble fms-like tyrosine kinase receptor-1 (sFlt-1) (vascular remodeling), troponinI (TnI) (myocyte injury), soluble toll-like receptor-2 (ST2) (myocyte stress), and creatinine (renal function) in a multi-center cohort of 1513 ambulatory chronic heart failure patients. We hypothesized that a biomarker score summarizing the activity of multiple pathways implicated in heart failure would improve our ability to classify risk of adverse outcomes (cardiac transplantation, ventricular assist device [VAD] placement, or death) compared to a validated clinical risk prediction algorithm, the Seattle Heart Failure Model.
Methods
Study Population
The Penn Heart Failure Study (PHFS) is an NHLBI-sponsored multi-center cohort study of outpatients with chronic heart failure (HF) recruited from referral centers at the University of Pennsylvania (Philadelphia, PA), Case Western University (Cleveland, OH), and the University of Wisconsin (Madison, WI).5, 6 The primary inclusion criterion is a clinical diagnosis of heart failure as determined by a heart failure specialist. The resultant cohort spans a full spectrum of heart failure severity ranging from mild disease to severe disease requiring advanced therapies.5, 6 Participants are excluded if they have a non-cardiac condition resulting in an expected mortality of less than 6 months as judged by the treating physician, or if they were unable to provide consent.
At time of study entry, detailed clinical data were obtained using standardized questionnaires administered to the patient and physician, with verification via medical records. Blood samples were obtained at enrollment, processed, and stored at -80°C until time of assay. Follow-up events including all-cause mortality and cardiac transplantation were prospectively ascertained every 6 months via patient contact and verified through death certificates, medical records, or contact with patients’ families by research personnel.
All participants provided written, informed consent, and the PHFS protocol was approved by participating Institutional Review Boards.
Laboratory Analyses
All biomarkers were measured from banked plasma obtained at the time of study entry. sFlt-1 and MPO were measured using prototype ARCHITECT® chemiluminescent microparticle-based immunoassays (Abbott Laboratories, Abbott Park, IL). BNP, TnI, hsCRP, uric acid, and creatinine were measured using standard ARCHITECT immunoassays (Abbott Laboratories, Abbott Park, IL). ST2 was measured via a high sensitivity sandwich monoclonal immunoassay (Presage™ ST2 assay, Critical Diagnostics, New York, New York).7 Full details are provided in the Supplemental File.
Seattle Heart Failure Model
The Seattle Heart Failure Model (SHFM) is a multivariable risk prediction scoring system that has been validated in multiple heart failure populations as a predictor of mortality, urgent cardiac transplantation, or VAD placement.8 The version of the score used in this study was the SHFM-D, abbreviated as SHFM for simplicity, and is based upon clinically assessed variables including demographics, heart failure characteristics, laboratory values, and medications. The derivation and validation of the SHFM has been previously described.9
Statistical Analysis
Baseline characteristics were summarized for the entire cohort using standard descriptive statistics. A log (base 2) transformation was applied to each biomarker to normalize its distribution. Spearman correlations were calculated between each biomarker pair. Cox regression models were used to determine the unadjusted association between each individual biomarker and time to the combined outcome of all-cause death, cardiac transplantation, or VAD placement. For TnI, variables that indicated a detectable value and the log-transformed continuous value were included to estimate the risk associated with a detectable value and the risk associated with the absolute value if detectable. The proportional hazards assumption was evaluated using weighted residuals.
All biomarkers were included in a multivariable Cox model, and a parsimonious set of biomarkers was selected using a stepwise procedure based on the Akaike information criterion (AIC), in which a biomarker that reduced the AIC was retained. To estimate a multimarker score, a leave-one-out-jackknife approach was used such that the multimarker score for each individual was calculated as a weighted combination of his/her biomarker levels, with weights determined by regression coefficients, which were estimated from the parsimonious Cox model that fit the data for all other individuals. The jackknife approach ameliorates the potential for bias when applying a predictive score to the same dataset from which it was derived, and avoids arbitrarily splitting the data into derivation and validation cohorts.10
In primary analyses, we compared the multimarker score to the clinically used SHFM score. To ensure a fair comparison between the multimarker score and the SHFM, we used estimates of the baseline hazard function to recalibrate the SHFM within our cohort. Kaplan-Meier curves were used to contrast the survival distribution across tertiles of the multimarker and SHFM score. Hazard ratios were estimated from an unadjusted Cox regression model and a model that adjusted for the SHFM.
To evaluate the multimarker score as a discriminator of individual risk, time-dependent receiver operating characteristic (ROC) curves were used to compare the ability of the multimarker score and the SHFM to classify patients with regard to adverse event at 1 year.11 Differences in the area under the ROC curve (AUC) were used to quantify improvements in predictive accuracy. The incremental value of the multimarker score compared to the SHFM in predicting outcomes at 1 year was determined using net reclassification improvement (NRI),12, 13 which represents the difference in the number of patients moving up or down clinical risk groups, stratified according to outcome. Here, clinically meaningful risk categories of 0%-<10%, 10%-<20%, 20%-<50%, and ≥50% risk were defined a priori.7 Cox regression models were used to predict risk at 1 year. Because some subjects were censored before 1 year, the number of events and nonevents at 1 year was estimated from the Kaplan-Meier survival estimator.14
Bootstrap resampling was used to compute standard error estimates upon which to base confidence intervals for the AUC and the NRI, as well as the Wald p values to test whether the difference between two AUCs and the NRI were equal to 0.10 Estimates of the AUC, the difference between two AUCs, and the NRI were obtained for each resampled dataset, and the standard deviation of the estimates across 1000 resampled datasets was used as the standard error.
In a secondary analysis, we re-derived the SHFM in our cohort. We entered the component variables into a Cox regression model and used a leave-one-out jackknife approach to re-derive the SHFM. We then compared the multi-marker score to the re-derived SHFM. In addition, because the SHFM-D score has been validated only for mortality, we performed a sensitivity analysis in which we used all-cause mortality alone as the outcome, and compared the multimarker score to both the SHFM and its component variables. Calibration for the SHFM was assessed using the Grønnesby and Borgan statistic. All statistical analyses were completed using R 2.12.0, including the survival, survivalROC, and pec extension packages.
Results
Baseline characteristics of the 1513 patients in the study cohort are shown in Table 1. The mean age of patients at time of enrollment was 56±15 years. Sixty-six percent of the cohort were male, 74% were Caucasian, and 22% were African American. Over a maximum follow-up period of 5 years (median 2.5 years, interquartile range 1.4 to 4.0 years), there were a total of 317 outcomes: 187 deaths, 99 cardiac transplantations, and 31 VAD implantations.
Table 1.
Baseline characteristics of study participants*
| All participants N = 1513 |
|
|---|---|
| Demographic Characteristics | |
| Age, mean (SD), yr | 56 (15) |
| Male | 1000 (66) |
| Race | |
| Caucasian | 1114 (74) |
| African American | 330 (22) |
| Other | 69 (4) |
| Medical History and Risk Factors | |
| History of hypertension | 877 (58) |
| History of diabetes | 426 (28) |
| Tobacco use | |
| Current | 138 (9) |
| Former | 806 (54) |
| Hypercholesterolemia | 752 (50) |
| Heart Failure Characteristics | |
| NYHA classification | |
| I | 258 (17) |
| II | 690 (46) |
| III | 444 (29) |
| IV | 114 (8) |
| Ischemic heart failure | 455 (30) |
| Systolic heart failure | 1305 (86) |
| Cardiac resynchronization therapy | 381 (25) |
| Defibrillator | 636 (42) |
| Medication Use | |
| ACE inhibitors or ARBs | 1314 (87) |
| Aldosterone antagonists | 511 (34) |
| Aspirin | 825 (55) |
| Beta-blockers | 1328 (88) |
| Digoxin | 586 (39) |
| Diuretics | 1185 (78) |
| HMG CoA reductase inhibitors | 756 (50) |
| Inotrope | 50 (3) |
| Clinical Measures | Mean (standard deviation) |
| Body mass index, kg/m2 | 30 (7.3) |
| Systolic blood pressure, mmHg | 114 (20) |
| Diastolic blood pressure, mmHg | 70 (12) |
| Estimated Glomerular Filtration Rate, ml/min/1.73 m2 | 84 (32) |
| Sodium –meq/L | 139 (3.4) |
| Ejection fraction – % | 34 (17) |
| Seattle Heart Failure Model score | -0.07 (1.0) |
| Biomarkers or Clinical Risk Scores | Median (interquartile range) |
| BNP – pg/ml | 171 (47, 576) |
| sFlt-1 – pg/ml | 308 (260, 381) |
| hsCRP – mg/l | 0.35 (0.14, 0.89) |
| MPO – pmol/l | 138 (95, 227) |
| ST2 – ng/ml | 27.5 (19.9, 40.8) |
| TnI | |
| Detectable, no. (%) | 973 (64) |
| TnI – ng/ml | 0.02 (0.01, 0.04) |
| Uric acid – mg/dl | 7.0 (5.7, 8.8) |
| Creatinine – mg/dl | 0.92 (0.76, 1.25) |
Abbreviations: ACE, Angiotensin-converting enzyme; ARBs, Angiotensin receptor blocker; BNP, B-type natriuretic peptide; sFlt-1, soluble fms-like tyrosine kinase receptor-1; hsCRP, high-sensitivity C-reactive protein; MPO, myeloperoxidase; ST2, soluble toll-like receptor-2; TnI, troponinI.
Values are expressed as number (percentage) unless otherwise noted
Median biomarker levels are provided in Table 1. Among the 8 biomarkers, there were moderate correlations between BNP and sFlt-1 (R=0.54), BNP and ST2 (R=0.40), and BNP and TnI (R=0.55) (Supplementary Figure 1). There were also moderate correlations between sFlt-1 and TnI (R=0.43) and between creatinine and uric acid (R=0.51) (p<0.001 for all comparisons).
Consistent with previously published studies, each of the 8 biomarkers was individually associated with the combined risk of all-cause death, cardiac transplantation, or VAD implantation. Creatinine and uric acid showed nonlinear associations with outcome (Supplementary Figure 2) and were modeled using quadratic terms. A multivariable Cox model including all biomarkers together was fit, and a parsimonious set was selected based on a stepwise model selection procedure (Supplementary Table 1). The following 7 markers remained in the multimarker score: BNP, sFlt-1, hsCRP, ST2, TnI (detectable versus not), uric acid, and creatinine (Table 2).
Table 2.
Association of multimarker score with risk of all-cause death, cardiac transplantation, or VAD placement
| Kaplan-Meier 1-year risk | Unadjusted | Adjusted* | |
|---|---|---|---|
| Risk category† | Estimate (95% CI) | Hazard Ratio (95% CI); P value | Hazard Ratio (95% CI); P value |
| Low | 1.6% (0.5%, 2.7%) | Referent | Referent |
| <–0.51‡ | |||
| Moderate | 6.4% (4.3%, 8.6%) | 4.69 (2.92, 7.54); | 3.50 (2.17, 5.67); |
| –0.51 to <0.52‡ | < 0.001 | < 0.001 | |
| High | 26% (22%, 30%) | 13.7 (8.75, 21.5); | 6.80 (4.18, 11.1); |
| ≥0.52 ‡ | < 0.001 | < 0.001 |
Abbreviation: CI, confidence interval
Adjusted for SHFM score
Bottom tertile of multimarker score defined as low risk, middle tertile defined as moderate risk, and top tertile defined as high risk
Multimarker score calculated as 0.210 × log2 BNP (pg/ml) + 0.176 × log2 sFlt-1 (pg/ml) + 0.067 ×log2 hsCRP (mg/l) + 0.274 × log2 ST2 (ng/ml) + 0.772 × detectable TnI (vs. not) – 1.718 × log2 uric acid (mg/dl) + 0.298 × (log2 uric acid)2 + 0.267 × log2 creatinine (mg/dl) – 0.138 (log2 creatinine)2, where log2 denotes log (base 2) transformation
Figure 1 displays the risk of transplant or VAD-free survival according to tertiles of the multimarker or SHFM score. In unadjusted models, patients in the middle tertile of multimarker score had a 4.69-fold increased risk of adverse outcomes, and those in the highest tertile had a 13.7-fold elevated risk. These findings remained robust after adjustment for the SHFM (Table 2). Hazard ratios were similar in subgroups defined by systolic (n =1305) or diastolic (n=198) heart failure, but our power to detect subtle differences between these subgroups was limited.
Figure 1. Event-free survival according to multimarker score category and tertiles of SHFM*.
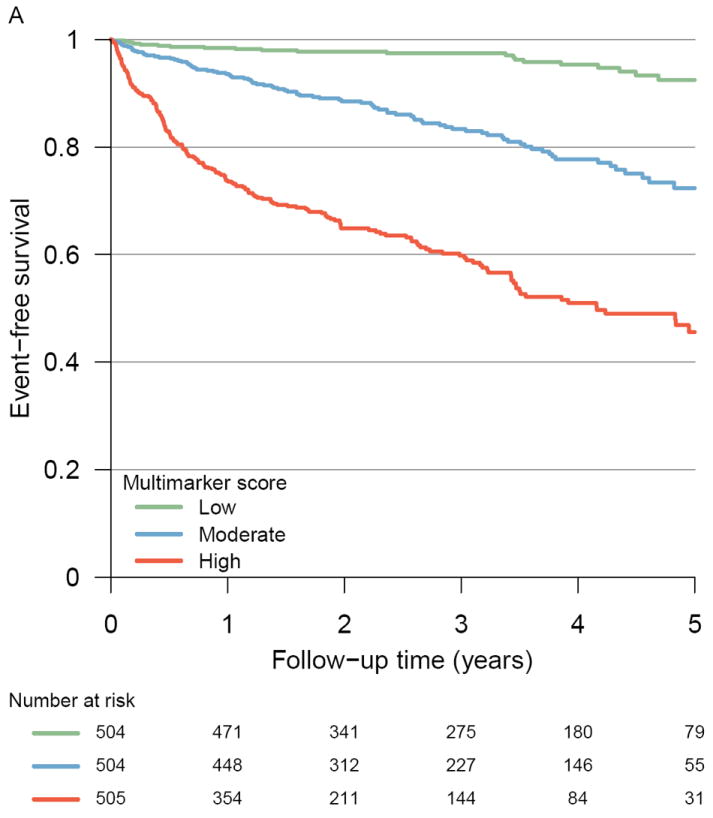
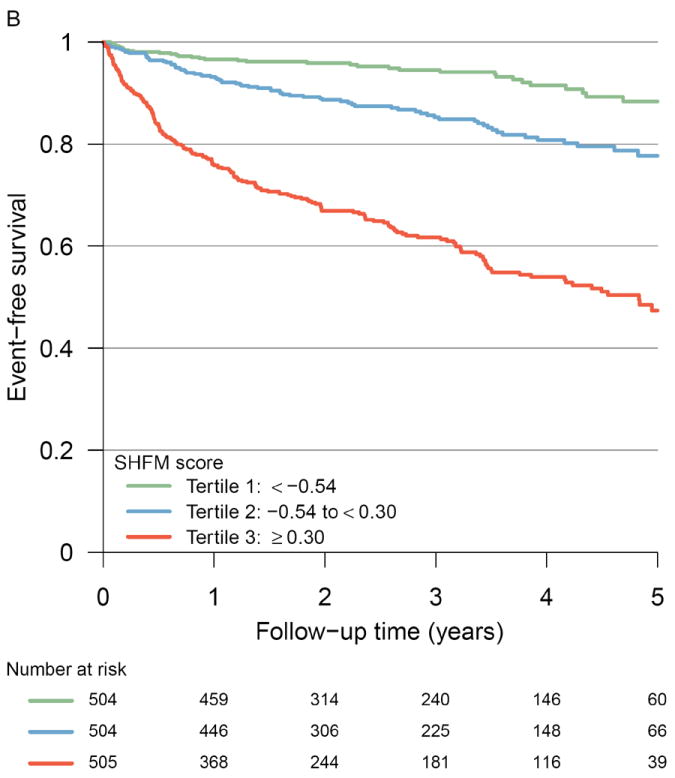
Kaplan-Meier curves illustrating the incidence of all-cause death, cardiac transplantation, or VAD placement among Penn Heart Failure Study participants according to (A) multimarker score category tertiles (P < 0.001 by log rank test) and (B) Seattle Heart Failure Model score tertiles (P < 0.001 by log rank test)
*Multimarker score calculated as described in Table 2
The AUC for the multimarker score was 0.798 at 1 year (95% CI 0.763-0.833), which indicated a strong ability to discriminate individual risk, and which was superior to that of the SHFM (AUC 0.756, 95% CI 0.717-0.795). As shown in Figure 2, addition of the multimarker score to the SHFM significantly improved predictive accuracy compared to the SHFM (AUC 0.803, 95% CI 0.769-0.837, p=0.003). Risk reclassification analyses revealed that use of the multimarker score in combination with the SHFM significantly improved classification of 1-year risk compared to the SHFM (NRI 24.1%, 95% CI 11.6%-36.7%, p<0.001) (Table 3). The improvement was limited to patients who experienced an adverse event (NRI 25.2%, 95% CI 14.2%-36.2%, p<0.001), signifying a better ability to classify patients at higher risk.
Figure 2. ROC curves for events at 1 year.
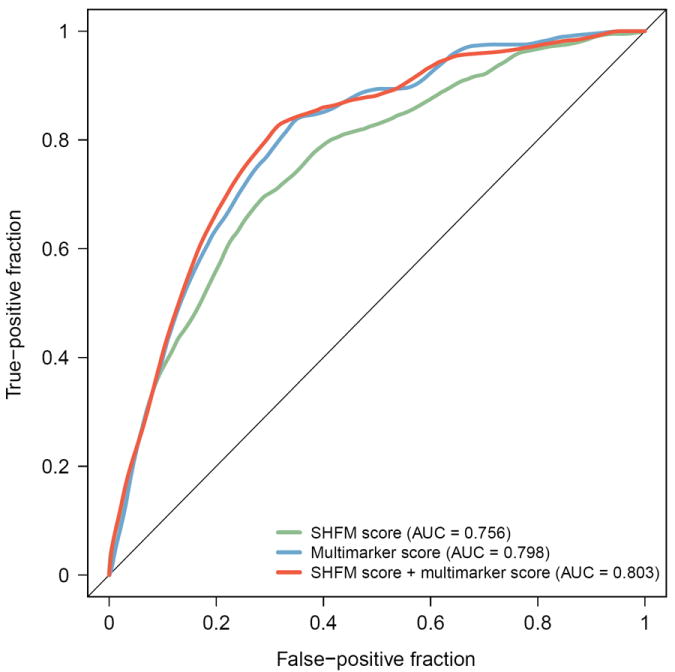
ROC curves comparing the ability of the SHFM and the multimarker score to correctly classify patients who died, required cardiac transplantation, or VAD placement by 1 year of followup*
*Multimarker score calculated as described in Table 2
Table 3.
Reclassification of 1-year risk of all-cause death, cardiac transplantation, or VAD placement with the addition of multimarker score to SHFM score*
| Reclassification | ||||
|---|---|---|---|---|
| SHFM score plus multimarker score | ||||
| SHFM score | 0%-<10% | ≥10%-<20% | ≥20%-<50% | ≥50%-100% |
| Events, no. (row %)† | ||||
| 0%-<10% | 22 (50%) | 19 (43%) | 3 (7%) | 0 |
| ≥10%-<20% | 4 (7%) | 30 (51%) | 26 (43%) | 0 |
| ≥20%-<50% | 0 | 6 (11%) | 41 (74%) | 8 (14%) |
| 50%-100% | 0 | 0 | 2 (19%) | 11 (84%) |
| Non-events, no. (row %)† | ||||
| 0%-<10% | 764 (88%) | 93 (11) | 15 (2%) | 0 |
| ≥10%-<20% | 121 (36%) | 154 (46%) | 60 (18%) | 1 (<1%) |
| ≥20%-<50% | 11 (9%) | 29 (23%) | 78 (62%) | 8 (6%) |
| ≥50%-100% | 0 | 0 | 2 (22%) | 5 (73%) |
| Net reclassification | |||||
| Up | Down | NRI | 95% CI | P value | |
|
| |||||
| Events† | 56 | 12 | 25.2% | (14.2%, 36.2%) | < 0.001 |
| Non-events† | 177 | 163 | -1.1% | (-5.6%, 3.4%) | 0.64 |
| Total | 24.1% | (11.6%, 36.7%) | < 0.001 | ||
Abbreviations: SHFM, Seattle Heart Failure Model score; CI, confidence interval; NRI, net reclassification index
Multimarker score calculated as described in Table 2
Number of events and non-events estimated from 1-year Kaplan-Meier risk estimates; row percentages may not sum to 100% due to estimation
We obtained similar results in secondary analyses comparing the multimarker score to the SHFM components. The AUC for the SHFM components was 0.776 (95% CI 0.735-0.818) at 1 year (Supplementary Figure 3). Addition of the multimarker score to the SHFM components significantly improved predictive accuracy compared to the SHFM components (AUC 0.811, 95% CI 0.771-0.850, p=0.019). In addition, the multimarker score and SHFM components in combination significantly improved classification of 1-year risk compared to the SHFM components (NRI 12.2%, 95% CI 0.6%-23.8%, p=0.039) (Supplementary Table 2).
We also obtained similar results with all-cause mortality as the outcome. The SHFM was well-calibrated in this cohort for the outcome of all-cause mortality with a predicted versus observed 1-year survival of 93.7% versus 94.0% (p=0.21). The AUC for the multimarker score was 0.808 (95% CI 0.762-0.854); for the SHFM, 0.761 (95% CI 0.708-0.813); and for SHFM components, 0.749 (95% CI 0.690-0.808). Addition of the multimarker score improved predictive accuracy compared to the SHFM (AUC 0.809, 95% CI 0.763-0.854, p=0.038) and compared to the SHFM components (AUC 0.790, 95% CI 0.735-0.846, p=0.065). The multimarker score also improved classification of 1-year risk of all-cause mortality in combination with the SHFM (NRI 18.0, 95% CI 2.4%-33.6%, p=0.023) and in combination with the SHFM components (NRI 13.7%, 95% CI -3.7%-31.1%, p=0.12). Although point estimates were similar, power was reduced in our sensitivity analysis due to the decreased event rate for all-cause mortality compared to the combined outcome of mortality, transplantation, and VAD implantation.
Discussion
In 2008, Braunwald classified circulating biomarkers into categories based upon their pathophysiologic effects in heart failure, and hypothesized that multiple biomarkers in combination would provide a valuable means for risk stratification.3 Our findings strongly support this hypothesis. In a multi-center cohort of 1513 ambulatory heart failure patients, we found that a multimarker score comprised of 7 biomarkers, reflective of diverse biologic axes, was a strong predictor of risk and significantly improved the prediction of outcomes compared to the most commonly used clinical risk score in heart failure, the SHFM. Patients in the highest multimarker tertile had a nearly 14-fold unadjusted risk of death, transplant, or VAD placement compared to the lowest tertile, and this risk remained nearly 7-fold after adjustment for the SHFM. The multimarker score showed a substantial ability to discriminate individual patient risk at 1 year (AUC 0.798) that was again superior to the SHFM. Addition of the multimarker score to the SHFM appropriately reclassified a large proportion (24.1%) of patients as higher risk. These findings support the usefulness of multiple biomarkers as part of an algorithm for assessing prognosis in heart failure.
Assessing risk of future adverse events is a fundamental task in clinical medicine. Research in community-based cohorts has led to the development of clinical scores that estimate the risk of new onset cardiovascular disease, the most widely used being the Framingham risk score.15 These scores are simple, easily calculated, and have been a major advance for preventive medicine. Attempts to improve risk prediction by adding a diverse panel of biomarkers and genetic variants to clinical risk scores is an active area of research, with mixed results depending upon the study population.16-21
Once cardiovascular disease is established, however, approaches to assessing risk of adverse events (i.e. prognosis) are less well defined, although still critically important as an objective means to guide treatment strategy. The SHFM is the most widely validated clinical risk score to predict prognosis in chronic heart failure,8 and is easily calculated from readily available clinical data and well-calibrated in our cohort, but has been shown to underestimate risk and overestimate survival.22 Biomarkers can improve upon the use of primarily clinical data (i.e. SHFM) and offer advantages of rapid availability (within minutes to hours), reproducibility, and quantitative insight into the underlying disease mechanisms. A number of previous studies have investigated the prognostic utility of one or two biomarkers in chronic heart failure. Several of these have demonstrated associations with outcome,23-25 but their clinical value remains a matter of debate.26 As recently reviewed,27,28 one explanation for the slow translation of biomarkers to clinical use relates to overly optimistic risk estimates in initial publications. An alternative explanation is that individual biomarkers may be insufficient to assess multi-system disorders. By contrast, our findings demonstrate that a diverse multimarker panel, which provides a more comprehensive signature of the underlying pathophysiology, offers substantial ability to determine individual patient prognosis.
These findings support the concept of a multimarker tool for prognosis, but identifying an ‘optimal’ panel of biomarkers for assessing heart failure, or any other disease, is a formidable task. We chose biomarkers that quantify known biological abnormalities in heart failure that affect outcome, including myocyte injury (TnI29-31), neurohormonal activation (BNP32), myocyte stress (ST233), vascular growth and remodeling (sFlt-134), inflammation (CRP32), oxidative stress (uric acid35, MPO36, 37), and renal dysfunction (creatinine). There are certainly other biomarkers that were not included, such as galectin-3, adrenomedullin, adiponectin, GDF-15, or high sensitivity TnI,24,38,39 and inclusion of these could improve our score. We also found substantial correlations among many of the biomarkers measured, strongly suggesting that there is no single ‘optimal panel.’ Rather, there are probably a number of biomarker panels that may perform equivalently, and choosing which to deploy in clinical practice will depend on factors such as cost, ease of assay, and potential therapeutic implications. As technology for proteomic and metabolomic profiling continues to advance, unbiased biomarker screens will undoubtedly reveal a large number of candidates for risk assessment in heart failure, and this challenge will be magnified.
We acknowledge the strengths and limitations of our study. First, our population was recruited from heart failure referral centers with broad inclusion criteria. As a result, the study cohort has a high prevalence of comorbid conditions and a broad spectrum of heart failure. The high burden of comorbidity parallels the complexity of heart failure patients in clinical practice, and stands in contrast to biomarker studies in clinical trial populations, which typically have fewer comorbid conditions. Furthermore, the broad spectrum of heart failure enabled biomarker assessment over the full range of disease, from mild to severe. Second, the multimarker score was derived within our dataset, and as such, there is a potential to have results appear more optimistic for this score. To address this concern, we performed rigorous analyses that included the implementation of a leave-one-out jackknife estimation approach, which avoids self-influence, arbitrary splitting of the data, and provides a highly robust measure to assess the validity of our findings. Our supplemental analyses using the SFHM and its components and using death as the primary outcome yielded qualitatively similar findings. Although we recalibrated the SHFM for our composite endpoint for risk reclassification analyses, recalibration did not affect estimation of the AUC (discrimination). Finally, our NRI estimates may be sensitive to the number and selection of cutpoints.
We caution that the most rigorous comparison is to assess both the biomarker score and the SHFM in completely independent cohorts, emphasizing the need for future research.27 We focused on a select panel of markers, but it is certainly plausible that there remain additional markers that could have further improved prognosis. The optimal panel of markers, the change in these markers over time, and how these changes might help guide therapeutic interventions remain to be defined, as does the cost-effectiveness of such an approach are necessary studies before its clinical application.
In summary, we demonstrate that a multimarker score comprised of seven circulating biomarkers showed a substantial ability to predict risk in chronic heart failure, and out-performed the most widely validated clinical risk score in heart failure, the SHFM. These findings strongly support ongoing efforts to use unbiased proteomic and metabolomic technologies to develop signatures of heart failure progression.
Supplementary Material
Clinical Perspective.
The progression of heart failure is complex and is driven by multiple biologic processes. We hypothesized that a biomarker score summarizing the activity of multiple heart failure associated pathways would improve our ability to estimate prognosis. In a multi-center cohort of 1513 chronic systolic heart failure patients, we measured a contemporary biomarker panel consisting of: high-sensitivity C-reactive protein (hsCRP), myeloperoxidase (MPO), B-type natriuretic peptide (BNP), soluble fms-like tyrosine kinase receptor-1 (sFlt-1), troponin I (TnI), soluble toll-like receptor-2 (ST2), creatinine, and uric acid. From this panel, we calculated a parsimonious multimarker score and assessed its performance in predicting risk of death, cardiac transplantation, or ventricular assist device (VAD) placement. Over a median followup of 2.5 years, we determined that the multimarker score was strongly associated with a risk of adverse outcomes, and this effect was independent of the Seattle Heart Failure Model (SHFM). Furthermore, addition of the multimarker score to the SHFM significantly improved discriminative ability and reclassified 25% of the patients into more appropriate, higher risk categories. These findings strongly support the concept of a multimarker tool for prognosis in chronic human heart failure.
Acknowledgments
Sources of Funding
Dr Ky was supported by the NIH/Clinical and Translational Science Award KL1 RR024132, NIH K23 HL095661-01, and the Heart Failure Society of America Research Fellowship Award. This work was also supported by NIH HL088577 (Dr. Cappola). Assay support was provided by Abbott Diagnostics and Critical Diagnostics. Neither the funding organizations, Abbott Diagnostics, nor Critical Diagnostics had any role in the design or the conduct of the study; collection, management, analysis, or interpretation of the data; or preparation, review, or approval of the manuscript.
Footnotes
Disclosures
Dr. Cappola reports receiving research support from Abbott Diagnostics. Drs. Ky and Cappola are co-inventors on a pending patent application for the use of sFlt-1 as a biomarker in heart failure. Dr. Levy received research support for the SHFM from NIH, General Electric, Epocrates, and HeartWare and honoraria from Glaxo SmithKline.
References
- 1.Lloyd-Jones D, Adams R, Carnethon M, De Simone G, Ferguson TB, Flegal K, Ford E, Furie K, Go A, Greenlund K, Haase N, Hailpern S, Ho M, Howard V, Kissela B, Kittner S, Lackland D, Lisabeth L, Marelli A, McDermott M, Meigs J, Mozaffarian D, Nichol G, O’Donnell C, Roger V, Rosamond W, Sacco R, Sorlie P, Stafford R, Steinberger J, Thom T, Wasserthiel-Smoller S, Wong N, Wylie-Rosett J, Hong Y. American Heart Association Statistics Committee and Stroke Statistics Subcommittee. Heart disease and stroke statistics--2009 update: a report from the American Heart Association Statistics Committee and Stroke Statistics Subcommittee. Circulation. 2009;119:480–486. doi: 10.1161/CIRCULATIONAHA.108.191259. [DOI] [PubMed] [Google Scholar]
- 2.Jessup M, Abraham WT, Casey DE, Feldman AM, Francis GS, Ganiats TG, Konstam MA, Mancini DM, Rahko PS, Silver MA, Stevenson LW, Yancy CW. 2009 focused update: ACCF/AHA Guidelines for the Diagnosis and Management of Heart Failure in Adults: a report of the American College of Cardiology Foundation/American Heart Association Task Force on Practice Guidelines: developed in collaboration with the International Society for Heart and Lung Transplantation. Circulation. 2009;119:1977–2016. doi: 10.1161/CIRCULATIONAHA.109.192064. [DOI] [PubMed] [Google Scholar]
- 3.Braunwald E. Biomarkers in heart failure. N Engl J Med. 2008;358:2148–2159. doi: 10.1056/NEJMra0800239. [DOI] [PubMed] [Google Scholar]
- 4.Richards AM. What we may expect from biomarkers in heart failure. Heart Fail Clin. 2009;5:463–470. doi: 10.1016/j.hfc.2009.04.011. [DOI] [PubMed] [Google Scholar]
- 5.Cappola TP, Matkovich SJ, Wang W, van Booven D, Li M, Wang X, Qu L, Sweitzer NK, Fang JC, Reilly MP, Hakonarson H, Nerbonne JM, Dorn GW., 2nd Loss-of-function DNA sequence variant in the CLCNKA chloride channel implicates the cardio-renal axis in interindividual heart failure risk variation. Proc Natl Acad Sci U S A. 2011;108:2456–2461. doi: 10.1073/pnas.1017494108. [DOI] [PMC free article] [PubMed] [Google Scholar]
- 6.Ky B, Kimmel SE, Safa RN, Putt ME, Sweitzer NK, Fang JC, Sawyer DB, Cappola TP. Neuregulin-1beta is Associated with Disease Severity and Adverse Outcomes in Chronic Heart Failure. Circulation. 2009;120:310–317. doi: 10.1161/CIRCULATIONAHA.109.856310. [DOI] [PMC free article] [PubMed] [Google Scholar]
- 7.Ky B, French B, McCloskey K, Rame JE, McIntosh E, Shahi P, Dries D, Tang WH, Wu AH, Fang JC, Boxer R, Sweitzer NK, Levy W, Goldberg L, Jessup M, Cappola TP. High-Sensitivity ST2 for Prediction of Adverse Outcomes in Chronic Heart Failure. Circ Heart Fail. 2011;4:180–187. doi: 10.1161/CIRCHEARTFAILURE.110.958223. [DOI] [PMC free article] [PubMed] [Google Scholar]
- 8.Levy WC, Mozaffarian D, Linker DT, Sutradhar SC, Anker SD, Cropp AB, Anand I, Maggioni A, Burton P, Sullivan MD, Pitt B, Poole-Wilson PA, Mann DL, Packer M. The Seattle Heart Failure Model: prediction of survival in heart failure. Circulation. 2006;113:1424–1433. doi: 10.1161/CIRCULATIONAHA.105.584102. [DOI] [PubMed] [Google Scholar]
- 9.Levy WC, Lee KL, Hellkamp AS, Poole JE, Mozaffarian D, Linker DT, Maggioni AP, Anand I, Poole-Wilson PA, Fishbein DP, Johnson G, Anderson J, Mark DB, Bardy GH. Maximizing survival benefit with primary prevention implantable cardioverter-defibrillator therapy in a heart failure population. Circulation. 2009;120:835–842. doi: 10.1161/CIRCULATIONAHA.108.816884. [DOI] [PMC free article] [PubMed] [Google Scholar]
- 10.Efron B, Tibshirani RJ. An Introduction to Bootstrap. New York: Chapman and Hall; 1993. [Google Scholar]
- 11.Heagerty PJ, Lumley T, Pepe MS. Time-dependent ROC curves for censored survival data and a diagnostic marker. Biometrics. 2000;56:337–344. doi: 10.1111/j.0006-341x.2000.00337.x. [DOI] [PubMed] [Google Scholar]
- 12.Cook NR, Ridker PM. Advances in measuring the effect of individual predictors of cardiovascular risk: the role of reclassification measures. Ann Intern Med. 2009;150:795–802. doi: 10.7326/0003-4819-150-11-200906020-00007. [DOI] [PMC free article] [PubMed] [Google Scholar]
- 13.Pencina MJ, D’Agostino RBS, D’Agostino RB, Jr, Vasan RS. Evaluating the added predictive ability of a new marker: from area under the ROC curve to reclassification and beyond. Stat Med. 2008;27:157–72. doi: 10.1002/sim.2929. discussion 207-12. [DOI] [PubMed] [Google Scholar]
- 14.Steyerberg EW, Pencina MJ. Reclassification calculations for persons with incomplete follow-up. Ann Intern Med. 2010;152:195–6. doi: 10.7326/0003-4819-152-3-201002020-00019. [DOI] [PubMed] [Google Scholar]
- 15.D’Agostino RBS, Vasan RS, Pencina MJ, Wolf PA, Cobain M, Massaro JM, Kannel WB. General cardiovascular risk profile for use in primary care: the Framingham Heart Study. Circulation. 2008;117:743–753. doi: 10.1161/CIRCULATIONAHA.107.699579. [DOI] [PubMed] [Google Scholar]
- 16.Velagaleti RS, Gona P, Larson MG, Wang TJ, Levy D, Benjamin EJ, Selhub J, Jacques PF, Meigs JB, Tofler GH, Vasan RS. Multimarker approach for the prediction of heart failure incidence in the community. Circulation. 2010;122:1700–1706. doi: 10.1161/CIRCULATIONAHA.109.929661. [DOI] [PMC free article] [PubMed] [Google Scholar]
- 17.Wang TJ, Gona P, Larson MG, Tofler GH, Levy D, Newton-Cheh C, Jacques PF, Rifai N, Selhub J, Robins SJ, Benjamin EJ, D’Agostino RB, Vasan RS. Multiple biomarkers for the prediction of first major cardiovascular events and death. N Engl J Med. 2006;355:2631–2639. doi: 10.1056/NEJMoa055373. [DOI] [PubMed] [Google Scholar]
- 18.Zethelius B, Berglund L, Sundstrom J, Ingelsson E, Basu S, Larsson A, Venge P, Arnlov J. Use of multiple biomarkers to improve the prediction of death from cardiovascular causes. N Engl J Med. 2008;358:2107–2116. doi: 10.1056/NEJMoa0707064. [DOI] [PubMed] [Google Scholar]
- 19.Melander O, Newton-Cheh C, Almgren P, Hedblad B, Berglund G, Engstrom G, Persson M, Smith JG, Magnusson M, Christensson A, Struck J, Morgenthaler NG, Bergmann A, Pencina MJ, Wang TJ. Novel and conventional biomarkers for prediction of incident cardiovascular events in the community. JAMA. 2009;302:49–57. doi: 10.1001/jama.2009.943. [DOI] [PMC free article] [PubMed] [Google Scholar]
- 20.Ripatti S, Tikkanen E, Orho-Melander M, Havulinna AS, Silander K, Sharma A, Guiducci C, Perola M, Jula A, Sinisalo J, Lokki ML, Nieminen MS, Melander O, Salomaa V, Peltonen L, Kathiresan S. A multilocus genetic risk score for coronary heart disease: case-control and prospective cohort analyses. Lancet. 2010;376:1393–1400. doi: 10.1016/S0140-6736(10)61267-6. [DOI] [PMC free article] [PubMed] [Google Scholar]
- 21.Sabatine MS, Morrow DA, de Lemos JA, Gibson CM, Murphy SA, Rifai N, McCabe C, Antman EM, Cannon CP, Braunwald E. Multimarker approach to risk stratification in non-ST elevation acute coronary syndromes: simultaneous assessment of troponin I, C-reactive protein, and B-type natriuretic peptide. Circulation. 2002;105:1760–1763. doi: 10.1161/01.cir.0000015464.18023.0a. [DOI] [PubMed] [Google Scholar]
- 22.Kalogeropoulos AP, Georgiopoulou VV, Giamouzis G, Smith AL, Agha SA, Waheed S, Laskar S, Puskas J, Dunbar S, Vega D, Levy WC, Butler J. Utility of the Seattle Heart Failure Model in patients with advanced heart failure. J Am Coll Cardiol. 2009;53:334–342. doi: 10.1016/j.jacc.2008.10.023. [DOI] [PubMed] [Google Scholar]
- 23.Berger R, Huelsman M, Strecker K, Bojic A, Moser P, Stanek B, Pacher R. B-type natriuretic peptide predicts sudden death in patients with chronic heart failure. Circulation. 2002;105:2392–2397. doi: 10.1161/01.cir.0000016642.15031.34. [DOI] [PubMed] [Google Scholar]
- 24.von Haehling S, Filippatos GS, Papassotiriou J, Cicoira M, Jankowska EA, Doehner W, Rozentryt P, Vassanelli C, Struck J, Banasiak W, Ponikowski P, Kremastinos D, Bergmann A, Morgenthaler NG, Anker SD. Mid-regional pro-adrenomedullin as a novel predictor of mortality in patients with chronic heart failure. Eur J Heart Fail. 2010;12:484–491. doi: 10.1093/eurjhf/hfq031. [DOI] [PubMed] [Google Scholar]
- 25.Neuhold S, Huelsmann M, Strunk G, Stoiser B, Struck J, Morgenthaler NG, Bergmann A, Moertl D, Berger R, Pacher R. Comparison of copeptin, B-type natriuretic peptide, and amino-terminal pro-B-type natriuretic peptide in patients with chronic heart failure: prediction of death at different stages of the disease. J Am Coll Cardiol. 2008;52:266–272. doi: 10.1016/j.jacc.2008.03.050. [DOI] [PubMed] [Google Scholar]
- 26.Cohn JN. Detecting the patient at risk of heart failure. J Am Coll Cardiol. 2010;55:2138–2139. doi: 10.1016/j.jacc.2010.01.035. [DOI] [PubMed] [Google Scholar]
- 27.Ioannidis JPA, Panagiotou OA. Comparison of Effect Sizes Associated With Biomarkers Reported in Highly Cited Individual Articles and in Subsequent Meta-analyses. JAMA: The Journal of the American Medical Association. 2011;305:2200–2210. doi: 10.1001/jama.2011.713. [DOI] [PubMed] [Google Scholar]
- 28.Bossuyt PM. The thin line between hope and hype in biomarker research. JAMA. 2011;305:2229–2230. doi: 10.1001/jama.2011.729. [DOI] [PubMed] [Google Scholar]
- 29.Kociol RD, Pang PS, Gheorghiade M, Fonarow GC, O’Connor CM, Felker GM. Troponin elevation in heart failure prevalence, mechanisms, and clinical implications. J Am Coll Cardiol. 2010;56:1071–1078. doi: 10.1016/j.jacc.2010.06.016. [DOI] [PubMed] [Google Scholar]
- 30.Peacock WF, 4th, De Marco T, Fonarow GC, Diercks D, Wynne J, Apple FS, Wu AH ADHERE Investigators. Cardiac troponin and outcome in acute heart failure. N Engl J Med. 2008;358:2117–2126. doi: 10.1056/NEJMoa0706824. [DOI] [PubMed] [Google Scholar]
- 31.Reichlin T, Hochholzer W, Bassetti S, Steuer S, Stelzig C, Hartwiger S, Biedert S, Schaub N, Buerge C, Potocki M, Noveanu M, Breidthardt T, Twerenbold R, Winkler K, Bingisser R, Mueller C. Early diagnosis of myocardial infarction with sensitive cardiac troponin assays. N Engl J Med. 2009;361:858–867. doi: 10.1056/NEJMoa0900428. [DOI] [PubMed] [Google Scholar]
- 32.Araujo JP, Lourenco P, Azevedo A, Frioes F, Rocha-Goncalves F, Ferreira A, Bettencourt P. Prognostic value of high-sensitivity C-reactive protein in heart failure: a systematic review. J Card Fail. 2009;15:256–266. doi: 10.1016/j.cardfail.2008.10.030. [DOI] [PubMed] [Google Scholar]
- 33.Kakkar R, Lee RT. The IL-33/ST2 pathway: therapeutic target and novel biomarker. Nat Rev Drug Discov. 2008;7:827–840. doi: 10.1038/nrd2660. [DOI] [PMC free article] [PubMed] [Google Scholar]
- 34.Ky B, French B, Ruparel K, Sweitzer NK, Fang JC, Levy WC, Sawyer DB, Cappola TP. The Vascular Marker Soluble Fms-like Tyrosine Kinase 1 is Associated with Disease Severity and Adverse Outcomes in Chronic Heart Failure. J Am Coll Cardiol. 2011;58:386–394. doi: 10.1016/j.jacc.2011.03.032. [DOI] [PMC free article] [PubMed] [Google Scholar]
- 35.Tamariz L, Harzand A, Palacio A, Verma S, Jones J, Hare J. Uric acid as a predictor of all-cause mortality in heart failure: a meta-analysis. Congest Heart Fail. 2011;17:25–30. doi: 10.1111/j.1751-7133.2011.00200.x. [DOI] [PubMed] [Google Scholar]
- 36.Tang WH, Brennan ML, Philip K, Tong W, Mann S, Van Lente F, Hazen SL. Plasma myeloperoxidase levels in patients with chronic heart failure. Am J Cardiol. 2006;98:796–799. doi: 10.1016/j.amjcard.2006.04.018. [DOI] [PubMed] [Google Scholar]
- 37.Baldus S, Heeschen C, Meinertz T, Zeiher AM, Eiserich JP, Munzel T, Simoons ML, Hamm CW CAPTURE Investigators. Myeloperoxidase serum levels predict risk in patients with acute coronary syndromes. Circulation. 2003;108:1440–1445. doi: 10.1161/01.CIR.0000090690.67322.51. [DOI] [PubMed] [Google Scholar]
- 38.de Boer RA, Voors AA, Muntendam P, van Gilst WH, van Veldhuisen DJ. Galectin-3: a novel mediator of heart failure development and progression. Eur J Heart Fail. 2009;11:811–817. doi: 10.1093/eurjhf/hfp097. [DOI] [PubMed] [Google Scholar]
- 39.Gupta S, Drazner MH, de Lemos JA. Newer biomarkers in heart failure. Heart Fail Clin. 2009;5:579–588. doi: 10.1016/j.hfc.2009.04.004. [DOI] [PubMed] [Google Scholar]
Associated Data
This section collects any data citations, data availability statements, or supplementary materials included in this article.