

Abstract
Background
Colonoscopy outcomes, such as polyp detection or complication rates, may differ by procedure indication.
Objectives
To develop methods to classify colonoscopy indications from administrative data, facilitating study of colonoscopy quality and outcomes.
Research Design
We linked 14,844 colonoscopy reports from the Clinical Outcomes Research Initiative, a national repository of endoscopic reports, to the corresponding Medicare Carrier and Outpatient File claims. Colonoscopy indication was determined from the procedure reports. We developed algorithms using classification and regression trees and linear discriminant analysis to classify colonoscopy indication. Predictor variables included ICD-9CM and CPT/HCPCS codes present on the colonoscopy claim or in the 12 months prior, patient demographics, and site of colonoscopy service. Algorithms were developed on a training set of 7,515 procedures, then validated using a test set of 7,329 procedures.
Results
Sensitivity was lowest for identifying average risk screening colonoscopies, varying between 55% and 86% for the different algorithms, but specificity for this indication was consistently over 95%. Sensitivity for diagnostic colonoscopy varied between 77% and 89%, with specificity between 55% and 87%. Algorithms with classification and regression trees with 7 variables or linear discriminant analysis with 10 variables had similar overall accuracy, and generally lower accuracy than the algorithm using linear discriminant analysis with 30 variables.
Conclusions
Algorithms using Medicare claims data have moderate sensitivity and specificity for colonoscopy indication, and will be useful for studying colonoscopy quality in this population. Further validation may be needed before use in alternative populations.
Keywords: Colonoscopy, Health Services Research, Electronic Health Records, Algorithms
Introduction
Because of the high volume and cost of colonoscopy in the United States, measuring the quality and outcomes for this procedure is vital 1,2. Although electronic health records are increasingly common, their use for quality measurement may be limited because the data format may differ across platforms; they usually cover circumscribed care settings; and they may cover fewer patients than claims data. Therefore, utilizing claims data is attractive as these data are readily available, have broad coverage, and are coded using standard administrative codes.
However, an important first step to using administrative data in quality measurement is to establish the validity and accuracy of the coding. In this context, developing methods to identify the original reason, or indication, for the colonoscopy is important, as diagnostic colonoscopies may have higher rates of biopsy, polypectomy, complications or incomplete exams than colorectal cancer screening colonoscopies. Therefore, understanding the indication for colonoscopy is important for accurately measuring these quality parameters. Such methods might assist policy makers in monitoring colorectal cancer screening and surveillance rates in the Medicare population and in studying quality and outcomes of screening and surveillance colonoscopy. For example, one Medicare quality measure is the use of appropriate surveillance intervals in patients with prior adenomatous polyps 3. To implement this measure, it is important to determine that a colonoscopy is being performed for surveillance and not diagnostic indications. In addition, retrospective studies assessing the impact of colonoscopy on colorectal cancer incidence and mortality require accurate classification of colonoscopy indications 4,5. Therefore, the aim of this study was to develop and validate methods that distinguish screening, surveillance, and diagnostic colonoscopy indications using claims-based data.
Methods
This study was approved by the Institutional Review Board of the University of Washington. The Oregon Health and Science University Institutional Review Board approved the creation and ongoing use of the Clinical Outcomes Research Initiative (CORI) data repository. We obtained a waiver of consent for HIPAA authorization.
Data sources
Clinical Outcomes Research Initiative (CORI)
The CORI data warehouse includes data from the medical records of gastrointestinal endoscopy procedures from participating sites 6-8, which broadly represent current endoscopic practice and are chosen according to size, location, and type (academic vs. Veterans Administration vs. community-based). Participating CORI sites use specialized software to generate all procedure reports and all information entered into the colonoscopy report is available in the data warehouse except as specified below. Because personal health information is removed from CORI data to comply with HIPAA regulations, exact date of birth is not available, but age is available to 1/100th year. All colonoscopy reports contain standard data elements, including the indications for the procedure, findings, diagnoses, and additional procedures performed, such as biopsy or polypectomy. Most data are entered in a check-box format or from pull-down lists; options for free text data entry are also available. Procedure indication is a mandatory field, and endoscopists must choose a primary indication if more than one indication is checked.
We excluded endoscopists whose practices no longer participated in CORI in 2009 and endoscopists from Veterans’ Administration or military sites, which generally do not submit claims to Medicare. The 270 eligible endoscopists were mailed informational materials about the study and given the opportunity to opt out of participating. We obtained consent from 190 endoscopists in 55 practices for use of their data for this study. Eighty-five percent of endoscopists were community-based, and 15% were in academic practice. Participating practices were located in 20 states nationally. CORI endoscopists were matched to their Unique Physician Identification Numbers (UPINs) to allow identification of corresponding Medicare colonoscopy claims.
Medicare Claims
CORI-participating physicians’ UPINs were submitted to the Centers for Medicare & Medicaid Services (CMS). Claims for colonoscopies performed by these physicians in 2006 and all claims in the prior 12 months for these patients were extracted from the Medicare Carrier and Outpatient files through the Chronic Conditions Warehouse (CCW) 9 using Current Procedural Terminology (CPT) and Healthcare Common Procedures Coding System (HCPCS) codes (Table 1). The Carrier File contains claims for inpatient and outpatient physician services and ambulatory surgery centers; the Outpatient File contains claims from hospital outpatient departments. Each claim includes the date of service, performing provider UPIN, procedures performed (CPT/HCPCS codes), and associated diagnoses (International Classification of Diseases-9 [ICD-9CM] codes). We used the CCW Beneficiary Summary File to obtain patient age and gender.
Table 1.
CPT and HCPCS codes to identify colonoscopy claims in Medicare data
| CPT code | HCPCS code | |
|---|---|---|
| Average risk screening colonoscopy | G0121 | |
| High risk screening colonoscopy | G0105 | |
| Diagnostic colonoscopy | 44388, 45378 | |
| Colonoscopy with biopsy | 44389, 45380 | |
| Colonoscopy with hot biopsy of polyp | 44392, 45384 | |
| Colonoscopy with snare polypectomy | 44393, 44394, 45383, 45385 | |
| Colonoscopy with submucosal injection | 45381 | |
| Colonoscopy with hemorrhage control | 45382, 44391 | |
| Colonoscopy with balloon dilation | 45386 | |
| Colonoscopy with stent placement | 45391, 44397 | |
| Colonoscopy with foreign body removal | 45379 |
Linkage of data sources
We obtained CORI procedure reports and Medicare claims for patients ages 65 and older who underwent colonoscopy by CORI physicians in 2006. We used four matching criteria to link the CORI procedure reports to the corresponding Medicare claims: date of service, performing provider UPIN, patient gender, and patient age. To define the colonoscopy claim date of service, we used the variables Line First Expense Date and Line Last Expense Date in the Carrier file, which identify the first and last dates of service for the line item in the claim. If the first and last dates of service differed, the date of service in the CORI record could match to any date within the range of service dates, +/-1 day. Patient age in the claims was calculated from the date of service and beneficiary birth date. We required exact matching for performing provider UPIN and patient gender, and matched patient age to 1/100th of a year.
Eighty-one CORI records matched to more than one claim in the Carrier or Outpatient CCW Files because a single colonoscopy can result in multiple Medicare claims (e.g., physician and facility claims). In these instances, we used CPT/HCPCS and ICD9-CM codes from all available claims in the Carrier and Outpatient Files in our analysis. Conversely, in 21 instances, one Medicare colonoscopy claim appeared to match to more than one CORI colonoscopy record. In these cases, we could not be certain which CORI record truly matched the colonoscopy claim, and we excluded the claim from analysis. After these matching criteria and exclusions, we had 15,168 claims for further analysis (Figure 1).
Figure 1.
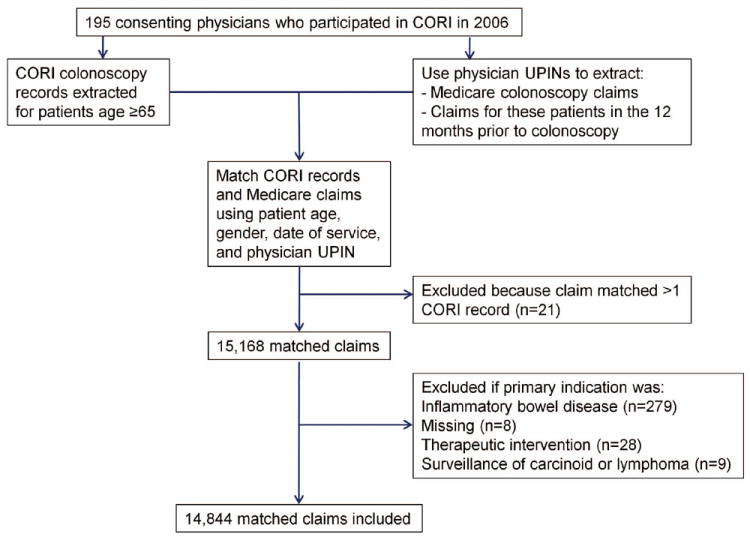
Selection and matching of CORI records and Medicare claims
Determination of colonoscopy indication
We used the CORI data as the gold standard and reviewed the check-box and free-text data in the colonoscopy report to determine procedure indications, which were categorized as average risk colorectal cancer screening, high risk colorectal cancer screening (family history of colorectal cancer or polyps), surveillance of prior colorectal polyps or cancer, or diagnostic. Diagnostic exams were performed for investigation of clinical signs or symptoms, such as anemia, gastrointestinal bleeding, or diarrhea.
Because 1,854 (12.2%) patients had more than one indication entered in the CORI report, two gastroenterologists (CK, JD) and one family physician (LMB) examined all available check-box and free-text data and used a pre-defined hierarchy to determine the final indication classification. In this hierarchy, diagnostic indications took precedence over surveillance indications, followed by high risk screening indications, and lastly average risk screening indications. For example, if a patient had both average risk screening and diagnostic indications listed, the indication was classified as diagnostic. We excluded patients with indications of inflammatory bowel disease (ulcerative colitis or Crohn’s disease, N=279), because of difficulty distinguishing whether these exams were performed for diagnostic or surveillance indications. We also excluded colonoscopies where indications were missing (N=8), the primary indication was a therapeutic intervention (N=28), or where the indication was surveillance of prior carcinoid tumors or lymphoma (N=9), leaving 14,844 procedures for analysis (Figure 1). Overall, the indication for colonoscopy was average risk screening in 24%, high risk screening in 5%, surveillance in 30%, and diagnostic in 42%.
Statistical analysis
Predictor variables
We used groups of CPT/HCPCS and ICD-9CM diagnostic codes from both the colonoscopy claim itself and from claims during the 12 prior months to determine indications (Tables 1 and 2). We did not use ICD-9CM diagnosis codes for colorectal polyp (211.3, 211.4), colorectal cancer (153.x), diverticulosis (562.1x), or hemorrhoids (455.x) if they were on the colonoscopy claim itself, as these codes could represent procedure findings rather than indications. However, these codes were considered if they were present prior to the day of colonoscopy. We also grouped codes with similar clinical meanings into a single dichotomous variable (Table 2). For example, all ICD9-CM codes for anemia were grouped into one dichotomous variable for analysis.
Table 2.
ICD-9CM and CPT code groupings used for algorithm development
| ICD Code Group | ICD code(s) included |
|---|---|
| Abdominal pain | 789.0, 789.00, 789.01, 789.02, 789.03, 789.04, 789.05, 789.06, 789.07, 789.09, 789.60, 789.61, 789.62, 789.63, 789.64, 789.65, 789.66, 789.67, 789.69 |
| Abdominal swelling | 789.3, 789.30, 789.31, 789.32, 789.33, 789.34, 789.35, 789.36, 789.37, 789.39 |
| Abnormal feces | 787.7 |
| Anemia | 280.0, 280.1, 280.8, 280.9, 281.0, 281.9, 285.1, 285.8, 285.9 |
| Angiodysplasia | 569.84, 569.85 |
| Anorectal finding | 565.0, 565.1, 566, 569.1, 569.2, 569.49 |
| Anorectal symptom | 569.42 |
| Average risk screening | V76.41, V76.49, V76.50, V76.51 |
| Other colitis | 558.1, 558.2, 558.9 |
| Colostomy | 569.62, 569.69 |
| Constipation | 560.30, 560.39, 564.0, 564.00, 564.01, 564.02, 564.09 |
| Diarrhea | 845, 90, 91, 92, 93, 564.4, 564.5, 787.91, 990 |
| Diverticulosis | 562.1, 562.10, 562.11, 562.12 |
| Family history unspecified digestive diseases | V18.51 |
| Family history unspecified malignant neoplasm | V16.9 |
| Hemorrhoids | 455.0, 455.1, 455.2, 455.3, 455.4, 455.5, 455.6 |
| Inflammatory bowel disease | 555.0, 555.1, 555.2, 555.9, 556.0, 556.1, 556.2, 556.3, 556.4, 556.5, 556.6, 556.8, 556.9, 556 |
| Personal history of other cancer | V10.09 |
| Fecal incontinence | 787.6 |
| Anorectal fistula | 569.81 |
| Foreign body | 936, 937 |
| Functional disorders of intestine | 564.1, 564.89, 564.9, 787.3 |
| Gastrointestinal bleeding | 569.3, 578, 578.1, 578.9, 772.4, 792.1, 9981.1 |
| Gastrointestinal complications | 997.4 |
| Family history of gastrointestinal neoplasm or polyp | V16.0, V16.8, V18.5 |
| Ileus | 560.1 |
| Intestinal bypass | V45.3 |
| Intestinal ischemia | 557.0, 557.1, 557.9 |
| Intestinal obstruction | 560.81, 560.89, 560.9 |
| Other abnormal finding | 793.4, 793.6 |
| Other gastrointestinal disorders | 569.89, 569.9 |
| Change in bowel habits | 787.99 |
| General medical examination or screening for other neoplasms | V70.0, V70.9, V71.1, V72.85, V76.52, V76.89, V76.9, V82.89, V82.9 |
| Other gastrointestinal symptoms | 560.0, 560.2, 564.2, 564.3, 564.6, 564.7, 568.0, 569.5, 569.83, 596.1, 618.04, 751.5 |
| Personal history of colorectal cancer or polyps | V10.00, V10.05, V10.06, V12.70, V12.72, V12.79, V19.8 |
| Anorectal ulcer | 569.41, 569.82 |
| Weight loss | 783.2, 783.21, 783.22 |
| Family history of gastrointestinal neoplasm or polyp (2) | V16.0, V18.5 |
| Infectious colitis | 008.45, 009.0, 009.1, 009.2, 009.3 |
| Colorectal cancer | 153, 153.0, 153.1, 153.2, 153.3, 153.4, 153.5, 153.6, 153.7, 153.8, 153.9, 154.0, 154.1 |
| Anal cancer | 154.2, 154.3, 154.8 |
| Carcinoma in-situ or neoplasm of uncertain behavior – colon and rectum | 230.3, 235.2, 239.0 |
| Iron deficiency anemia | 280.0, 280.1, 280.8, 280.9, 281.0, 281.9 |
| Other anemias | 285.1, 285.8, 285.9 |
| Hemorrhoids | 455.0, 455.1, 455.2, 455.3, 455.4, 455.5, 455.6 |
| Crohn’s disease | 555.0, 555.1, 555.2, 555.9 |
| Ulcerative colitis | 556.0, 556.1, 556.2, 556.3, 556.4, 556.5, 556.6, 556.8, 556.9 |
| Intestinal ischemia | 557.0, 557.1, 557.9 |
| Radiation colitis | 558.1, 990 |
| Paralytic ileus | 560.1, 560.89, 560.9, 560.2 |
| Constipation (2) | 564.00, 564.02, 564.09 |
| Functional intestinal disorders | 564.1, 564.89, 564.9 |
| Anorectal fissure or abscess | 565.0, 565.1, 566 |
| Anorectal stenosis, prolapsed, ulcer, or pain | 569.1, 569.2, 569.49, 569.41 |
| Abdominal pain (2) | 789.00, 789.01 |
| Foreign body | 936, 937 |
| Gastrointestinal complications | 998.11, 997.4 |
| Personal history of colorectal neoplasm | V10.00, V10.05, V10.06 |
| Personal history of other digestive diseases | V12.70, V12.79 |
| Screening for colorectal malignancy | V76.41, V76.51 |
| Screening for other neoplasms | V76.52, V76.89, V76.9, V82.89, V82.9 |
| ICD codes used only from claims prior to colonoscopy | ICD code(s) included |
| Colorectal cancer | 153, 153.0, 153.1, 153.2, 153.3, 153.4, 153.5, 153.6, 153.7, 153.8, 153.9, 154.0, 154.1, 154.2, 154.3, 154.8 |
| Colorectal polyp | 569.0, 211.3, 211.4 |
| Neoplasm of uncertain behavior | 230.3, 235.2, 239.0 |
| CPT/HCPCS code group | CPT code(s) included |
| Average risk screening colonoscopy | G0121 |
| High risk screening colonoscopy | G0105 |
| Diagnostic colonoscopy | 44388, 45378, 44388 |
| Colonoscopy with biopsy | 44389, 45380 |
| Colonoscopy with hot biopsy | 44392, 45384 |
| Colonoscopy with polypectomy | 44394, 45385 |
| Flexible sigmoidoscopy | 45330, 45331, 45333, 45335, 45338, 45339 |
| Colonoscopy with removal of foreign body, hemorrhage control, submucosal injection, balloon dilation, or stent placement | 45379, 45381, 45382, 45383, 45386, 45387 |
| Barium enema | 74270, 74280, 74283 |
The following covariates also served as potential predictors: age, gender, race, region, state, university facility (yes/no) and service site (outpatient hospital, inpatient hospital, ambulatory surgery center, office, and emergency room). All categorical variables were used as indicator variables. Indicator variables were eliminated if the number of positive or negative responses was less than 10 in either the training or the test set. If pairs of highly correlated predictors were found (Pearson correlation >0.99), only one of the two variables was retained.
Outcomes
Because the type of algorithm to discriminate colonoscopy indications may differ according to the research question at hand, we developed algorithms using 4 different groupings of indications.
Four-level grouping: diagnostic, average risk screening, high risk screening, and surveillance
Three-level grouping: diagnostic, average risk screening, and high risk screening/surveillance combined
Diagnostic vs. all other indications combined
Average-risk screening vs. all other indications combined
Training and test sets
We divided the overall sample into training and test sets. Because individual practices may have different coding patterns, we randomly divided the procedures by practice site rather than by the individual procedures to improve generalizability of our algorithms. Practice sites were paired by the mean number of HCPCS per procedure, number of procedures per facility, facility type (hospital, ambulatory center, office), proportion with each colonoscopy indication, and geographical region. One member of each pair of practice sites was randomly allocated to the training set, and the other to the test set to ensure a roughly equal distribution of these variables in the two sets. The training set comprised 27 practice sites and 7,515 colonoscopies, while the test set contained 28 practice sites and 7,329 colonoscopies.
Model building
To be robust in our search for the best model, we used 2 different modeling approaches: linear discriminant analysis (LDA, a parametric method)10 and classification and regression trees (CART, a non-parametric method)11. As a parametric method, LDA was able to utilize the scale of continuous variables such as age, whereas CART was not. However, the presence of outliers in continuous variables may cause poor model construction and prediction for LDA but not for CART. CART is generally more adept at detecting interactions than LDA. In the model building process, we also initially considered three other approaches: multinomial logistic regression, random forests, and conditional inference trees. The choice of predictor variables and the internal cross-validation results for these three additional models were very similar to the results for LDA and CART. We eliminated these three approaches from subsequent use because we wanted to explore a relatively succinct set of models, avoid overfitting, and find models that were not overly complicated.
LDA models were built using the recursive feature selection algorithm 12. To prevent over-fitting of LDA models, we used 10-fold cross-validation to determine the number of variables to be used in the model-building 13. The CART model already includes cross-validation in its model-building algorithm. The classification algorithms were built to result in the best possible (cross-validated) accuracy in the training set.
We built separate models starting with different two sets of candidate predictor variables: 1) all variables, including both individual and grouped ICD-9 or CPT codes (242 variables) and 2) all variables except the individual ICD-9 codes (127 variables). The rationale for the second set of predictor variables was to determine if good prediction could be achieved by starting with a much smaller set of variables – an approach that can reduce over-fitting.
The best-performing algorithms were then validated in the test set. Other performance characteristics (kappa values, area under the curve, sensitivity and specificity) were calculated, and confidence intervals for these statistics were based on the non-parametric bootstrap, using the practice site as the unit of resampling.
All calculations were carried out in R: A Language and Environment for Statistical Computing (R Foundation for Statistical Computing, Vienna, Austria) version 2.12.0. The package caret in R was used to implement all model-building procedures.
Results
We identified 3 algorithms which performed well in identifying colonoscopy indications, one developed using CART and two using linear discriminant analysis. Linear discriminant models were built with up to 100 predictor variables. The accuracy (i.e. percent correctly classified) by the LDA model in the training set increased by 5% when the number of predictors increased from 10 to 30, but only by 1% when the number of predictors increased from 30 to 50. There was no appreciable improvement with inclusion of more than 50 predictor variables. The model with 10 variables had cross-validated accuracy of 72% in the training set, while models with more variables had accuracy up to 78%. We chose two LDA algorithms, a simpler one with 10 predictor variables and a more complex and more accurate one with 30 predictor variables (LDA10 or LDA30, respectively). The parameters of the LDA models (LDA scaling matrix and group means) are tabulated in the Supplemental Digital Content Appendix Tables 1-4, along with a formula to calculate predicted probabilities for new observations from these models (Supplemental Digital Content 1, Description of Linear Discriminant Analysis Models). The CART models are presented as decision trees; the total sample size and accuracy in the test set are shown at each leaf of the tree.
Variables used in the CART algorithm for the 4-level classification include ICD-9CM codes for average risk screening, personal history of colorectal polyps or cancer, family history of colorectal polyps or cancer, gastrointestinal bleeding, and the total number of prior ICD-9CM codes present from the codes in the second column of Table 2 (Figure 2). The test set accuracy of this CART algorithm was 71% (95% confidence interval (CI) 66-74%) (Table 3). For the 4-level CART algorithm, the area under the curve (AUC), an alternative method for evaluating prediction performance, was 0.87 for average risk screening indications (Table 3). An AUC of 1 represents perfect classification, while AUC between 0.80 and 0.90 represents good to excellent classification. Cohen’s kappa, which evaluates the extent of agreement with the gold standard over that expected by chance, varied between 0.52 and 0.60 in the 4-level classification, indicating moderate agreement with the CORI records. In the four-level classification, sensitivity for individual indications varied from 45% for high risk screening to 80% for surveillance. Specificity for individual indications varied from 79% for surveillance to 99% for high risk screening. As an example, these results mean that 79% of colonoscopies not performed for surveillance were predicted to have non-surveillance indications by this algorithm. Positive predictive values varied between 61% and 80%. The overall accuracy of LDA10 algorithm was similar to the CART algorithm, but with somewhat higher sensitivity for diagnostic and high risk indications and lower sensitivity for surveillance indications. The overall accuracy of the LDA30 algorithms was 3-5% better than the CART and LDA10 algorithms.
Figure 2.

Classification and regression tree algorithm for 4-level grouping* of colonoscopy indication
*Four-level classification = diagnostic, average risk screening, surveillance, and high risk. The number of prior ICD codes is defined as the total count of prior ICD-9CM codes present from the list of codes in the second column of Table 2. Algorithm developed in training set of 7,515 colonoscopies, and validated in test set of 7,329 colonoscopies.
Table 3.
Performance characteristics of algorithms for classification of colonoscopy indication.
| Classification and regression tree – 7 variables (95% confidence interval) | Linear discriminant analysis – 30 variables (95% confidence interval) | Linear discriminant analysis – 10 variables (95% confidence interval) | |
|---|---|---|---|
| Four-level classification of indications* | |||
| Overall accuracy (%) | 71 (66-74) | 73 (68-77) | 68 (61-74) |
| Kappa, vs. CORI records | 0.57 (0.50-0.62) | 0.60 (0.53-0.66) | 0.52 (0.41-0.61) |
| Average risk screening | |||
| Sensitivity (%) | 56 (44-67) | 58 (46-68) | 56 (44-67) |
| Specificity (%) | 95 (94-97) | 96 (95-97) | 96 (95-98) |
| PPV** (%) | 80 (74-85) | 83 (77-88) | 84 (79-90) |
| NPV** (%) | 87 (83-91) | 87 (84-91) | 87 (83-91) |
| Area under the curve | 0.87 (0.84-0.90) | 0.91 (0.88-0.93) | 0.89 (0.86-0.92) |
| High risk screening | |||
| Sensitivity (%) | 45 (33-0.53) | 65 (53-77) | 65 (53-76) |
| Specificity (%) | 99 (99-1.00) | 98 (97-99) | 98 (97-99) |
| PPV** (%) | 73 (62-0.83) | 68 (60-78) | 68 (59-78) |
| NPV** (%) | 97 (96-0.97) | 98 (97-99) | 98 (97-99) |
| Area under the curve | 0.84 (0.78-0.88) | 0.93 (0.90-0.95) | 0.91 (0.85-0.95) |
| Surveillance | |||
| Sensitivity (%) | 80 (71-86) | 74 (66-80) | 52 (38-65) |
| Specificity (%) | 79 (75-82) | 89 (86-92) | 97 (96-98) |
| PPV** (%) | 61 (58-65) | 74 (70-79) | 88 (85-92) |
| NPV** (%) | 90 (86-93) | 89 (86-92) | 83 (79-87) |
| Area under the curve | 0.86 (0.81-0.89) | 0.90 (0.88-0.92) | 0.87 (0.82-0.89) |
| Diagnostic | |||
| Sensitivity (%) | 77 (73-82) | 83 (80-87) | 88 (84-93) |
| Specificity(%) | 83 (76-88) | 76 (66-82) | 58 (45-70) |
| PPV** (%) | 75 (68-82) | 69 (60-77) | 58 (49-69) |
| NPV** (%) | 84 (80-88) | 87 (83-91) | 88 (84-92) |
| Area under the curve | 0.83 (0.80-0.86) | 0.88 (0.86-0.90) | 0.86 (0.82-0.89) |
| Three-level classification of indications* | |||
| Overall accuracy (%) | 72 (68-76) | 76 (72-79) | 72 (66-76) |
| Kappa, vs. CORI records | 0.57 (0.50-0.62) | 0.63 (0.56-0.68) | 0.63 (0.56-0.68) |
| Average risk screening | |||
| Sensitivity (%) | 56 (44-67) | 57 (44-68) | 56 (44-67) |
| Specificity (%) | 95 (94-97) | 96 (95-98) | 96 (95-98) |
| PPV** (%) | 80 (74-84) | 83 (78-89) | 83 (77-89) |
| NPV** (%) | 87 (83-91) | 87 (83-91) | 87 (83-90) |
| Area under the curve | 0.88 (0.84-0.90) | 0.91 (0.88-0.93) | 0.90 (0.86-0.92) |
| High risk screening or surveillance | |||
| Sensitivity (%) | 79 (70-86) | 85 (79-89) | 69 (57-77) |
| Specificity (%) | 78 (74-82) | 79 (74-84) | 85 (82-89) |
| PPV** (%) | 66 (62-70) | 69 (65-74) | 72 (67-76) |
| NPV** (%) | 87 (83-91) | 91 (87-93) | 83 (79-88) |
| Area under the curve | 0.85 (0.81-0.88) | 0.91 (0.88-0.93) | 0.87 (0.84-0.90) |
| Diagnostic | |||
| Sensitivity (%) | 76 (72-81) | 80 (77-84) | 84 (81-89) |
| Specificity (%) | 83 (75-89) | 87 (82-91) | 74 (64-81) |
| PPV** (%) | 75 (68-82) | 81 (74-86) | 68 (61-76) |
| NPV** (%) | 84 (80-88) | 87 (83-90) | 88 (84-91) |
| Area under the curve | 0.84 (0.81-0.87) | 0.90 (0.88-0.92) | 0.87 (0.83-0.89) |
| Two-level classifications of indications | |||
| Diagnostic vs. all other indications | |||
| Overall accuracy (%) | 85 (81-87) | 85 (82-88) | 79 (75-83) |
| Kappa, vs. with CORI records | 0.67 (0.61-0.72) | 0.68 (0.62-0.73) | 0.56 (0.47-0.62) |
| Sensitivity (%) | 77 (71-82) | 72 (65-77) | 68 (64-72) |
| Specificity (%) | 90 (86-92) | 94 (91-96) | 87 (80-91) |
| PPV** (%) | 83 (79-86) | 89 (86-91) | 77 (69-84) |
| NPV** (%) | 86 (82-88) | 84 (80-87) | 80 (75-85) |
| Area under the curve | 0.87 (0.83-0.89) | 0.91 (0.89-0.93) | 0.87 (0.83-0.89) |
| Average risk screening vs. all other indications | |||
| Overall accuracy (%) | 86 (84-89) | 86 (83-88) | 86 (83-88) |
| Kappa, vs. with CORI records | 0.59 (0.49-0.66) | 0.58 (0.48-0.65) | 0.57 (0.49-0.65) |
| Sensitivity (%) | 56 (43-67) | 56 (45-67) | 56 (44-67) |
| Specificity (%) | 97 (95-98) | 96 (94-97) | 95 (94-97) |
| PPV** (%) | 84 (78-90) | 81 (75-86) | 81 (75-85) |
| NPV** (%) | 87 (83-91) | 87 (83-91) | 87 (83-91) |
| Area under the curve | 0.76 (0.70-0.81) | 0.90 (0.87-0.92) | 0.88 (0.85-0.91) |
Algorithms developed in training set of 7,515 colonoscopies, and validated in test set of 7,329 colonoscopies. Results presented from test set.
Four-level classification = diagnostic, average risk screening, high risk screening, and surveillance. Three-level classification = diagnostic, surveillance/high risk screening combined, and average risk screening
PPV = positive predictive value, NPV = negative predictive value, assuming the same prevalence of indications as in the test set.
The accuracy of the CART algorithm slightly improved from 71% in the 4-group classification to 72% (95%CI 68%-76%) in the 3-group classification (average risk screening, surveillance/high risk, diagnostic) (see Table 3 and Supplemental Digital Content Figure 1, which shows the CART algorithm). Sensitivity for average risk screening or diagnostic indications remained similar, while specificity for average risk screening indications remained high at 96%.
Accuracy of the CART algorithm was highest (85%-86%) when we used two-group classifications of indication (diagnostic or average risk screening vs. all other indications) (Table 3). The CART algorithm for diagnostic indication had a sensitivity of 77% (95%CI 71%-82%) and specificity of 90% (95%CI 86%-92%) (see Supplemental Digital Content Figure 2, which shows the CART algorithm). For example, this would mean that 90% of colonoscopies performed for screening or surveillance indications were appropriately predicted not to be diagnostic. The CART algorithm for average risk screening indications had a sensitivity of 56% and a specificity of 97% (see Supplemental Digital Content Figure 3, which shows the CART algorithm). As expected with fewer predictor variables, LDA10 algorithms had generally lower accuracy, sensitivity, and specificity than LDA30 algorithms.
We examined characteristics of the average risk screening colonoscopies that were or were not correctly identified by our algorithms. When compared to those that were misclassified, a lower proportion of average risk screening colonoscopies that were correctly classified by the CART algorithm had polyps identified (52% vs. 21%), biopsies performed (29% vs. 12%), or polypectomies performed (31% vs. 11%). We found similar results for the LDA10 and LDA30 algorithms (data not shown). Thus, average risk screening colonoscopies where polyps are identified or removed may be particularly difficult to identify with claims data.
Discussion
We have developed several algorithms with sufficient accuracy to identify colonoscopy indications from Medicare claims data. We present algorithm variations that may be useful for different purposes, depending on the specificity needed and the complexity of implementation. For example, researchers wishing to study trends in screening rates could use algorithms to identify average risk screening colonoscopies, which have high specificity but relatively low sensitivity. With this choice, researchers can be confident that they are finding and excluding surveillance and diagnostic colonoscopies, but some average risk screening colonoscopies may also be excluded. Others may wish to study outcomes for screening or surveillance colonoscopy. By using an algorithm to identify diagnostic indications, a large proportion of such exams can be excluded from further analysis. The final choice of algorithm will likely depend on the needs of the specific study. Although there are no a priori rules for determining if the accuracy of algorithms is sufficient, we suggest that researchers consider the positive and negative predictive values of the algorithms in the context of their research questions. Sensitivity analyses could be performed to determine the effect of different classification methods (as presented here) upon study results in relevant subsets of the study data. Further considerations of accuracy and other performance characteristics, methodologic complexity of the classification method, and computational requirements will determine the final algorithm choice.
Our algorithms are consistent with clinical indications for diagnostic or screening colonoscopy. For example, in the 4-group CART algorithm (Figure 2), ICD9-CM codes for gastrointestinal bleeding on the colonoscopy claim were key in identifying diagnostic indications. In the 4-group LDA30 algorithm, ICD-9CM codes for anemia, gastrointestinal bleeding, abdominal pain, and diarrhea on the claim were predictive of diagnostic indications, while ICD-9CM codes for family history of colon cancer or polyps were predictive of high risk screening indications. This consistency with clinical practice gives our algorithms face validity.
Average risk screening colonoscopies were consistently the most difficult to identify accurately, likely due to Medicare coding guidelines. These guidelines require that claims for average risk screening colonoscopy without biopsy or polypectomy be submitted using HCPCS code G0121 (average risk screening colonoscopy). If a biopsy or polypectomy is performed, CPT codes 45380 (colonoscopy with biopsy) or 45383 (colonoscopy with polypectomy) should be used instead. ICD-9CM codes V76.41 or V76.51 (screening – malignant neoplasm colon or rectum, respectively) should be submitted whether or not a biopsy or polypectomy is performed. Problems arise since the CPT codes for screening colonoscopy with biopsy or polypectomy are also used for diagnostic colonoscopy, and the ICD9-CM screening codes are not always included with the colonoscopy claims. We found that correctly identified average risk screening colonoscopies were less likely to have polyps identified or biopsies or polypectomies performed. Therefore, screening colonoscopies with biopsy or polypectomy may be particularly difficult to identify. Concerns about high co-payments for average risk screening colonoscopy may cause some endoscopists to code these exams as diagnostic exams, potentially lowering the sensitivity for average risk screening colonoscopy. However, in these cases, endoscopists are likely to also document a diagnostic indication in the colonoscopy report to support the claim. This would cause the colonoscopy to be classified as diagnostic by our gold standard, and would have little effect on our results. Overall, the difficulty with identifying screening colonoscopy with biopsy or polypectomy may cause some bias in studies of screening colonoscopy using administrative data, for example, by leading to under-estimation of polyp detection, biopsy, or polypectomy rates during screening colonoscopy. Since those screening colonoscopies that are most likely to provide benefit (i.e. those with biopsy or polypectomy) are less likely to be identified, this may also bias estimates of screening effectiveness.
Other algorithms to determine colonoscopy indications using administrative data 14-16 have been described. Fisher et al. 15 examined 650 colonoscopies within the Veterans Health administration, and used codes within 1 year prior to the exam to designate an exam as screening or non-screening. The best algorithm had a 83% sensitivity and 76% specificity for screening exams. Haque et al. 14 studied 220 patients in Kaiser-Permanente to identify screening or diagnostic colonoscopies. This algorithm did not include some of the diagnostic codes that we found important, such as ICD9-CM codes for diarrhea, anemia, or a personal history of colorectal polyps. Codes for gastrointestinal bleeding were only used if they occurred within 45 days of the colonoscopy. The sensitivity of this algorithm was 84% with specificity of 76% for identifying screening exams. However, neither of these algorithms attempted to separately identify surveillance indications or validate their results on independent test sets, and both used data from circumscribed care settings.
The advantages of our study are inclusion of multiple practice sites around the country and availability of a larger training and test set. Therefore, our algorithms are more likely to be generalizable to diverse care settings. However, our study was limited to the Medicare population and may need to be validated for use outside this population. In addition, our practice sites had agreed to participate in CORI, and their coding practices may differ from non-CORI practices. Another potential limitation is the methods we used to link the CORI records to the Medicare claims. We did not have direct identifiers available in the CORI data, but used strict matching criteria based on age, gender, date of service and endoscopist’s UPIN. We cannot verify the accuracy of this matching, but other studies using similar methods have found high matching accuracy (over 95%) even without direct patient identifiers 17.
Limitations also include use of codes only within the 12 months prior to colonoscopy. Some patients undergoing surveillance may have codes for personal history of colorectal polyps or cancer that were only present more than 12 months prior to the index colonoscopy, potentially causing us to underestimate sensitivity for surveillance exams. We used a pre-defined hierarchy of indications, in which colonoscopies with a combination of both diagnostic and screening/surveillance indications were classified as diagnostic. This pre-defined hierarchy may lower the sensitivity of our algorithms for screening or surveillance colonoscopies. However, this hierarchy is consistent with clinical definitions, where screening or surveillance can occur only in the absence of symptoms. Finally, it is possible that endoscopists do not report indications correctly, leading to an incorrect gold standard. We did not obtain medical records other than the CORI report for review, so we could only look for agreement of the claims with the CORI report.
In summary, we present several algorithms to determine colonoscopy indications from administrative data. These algorithms have been developed in a dataset obtained from practice sites nationally, and have been tested in a validation set of colonoscopy claims. These algorithms have moderate sensitivity and specificity for average risk screening indications, and can be used for studies of colonoscopy utilization and outcomes using Medicare populations. Further validation may be needed for studies using alternative populations.
Supplementary Material
Acknowledgments
Funding Source: This work was supported by NIH grant CA127659. JAD was supported by the American Society for Gastrointestinal Endoscopy Endoscopic Research Career Development Award. This material is based upon work supported in part by the VA Puget Sound Health Care System, Department of Veterans Affairs. The views expressed in this article are those of the authors and do not necessarily reflect the position or policy of the Department of Veterans Affairs.
References
- 1.Seeff LC, Richards TB, Shapiro JA, et al. How many endoscopies are performed for colorectal cancer screening? Results from CDC’s survey of endoscopic capacity. Gastroenterol. 2004;127:1670–7. doi: 10.1053/j.gastro.2004.09.051. [DOI] [PubMed] [Google Scholar]
- 2.Owings MF, Kozak LJ. Ambulatory and inpatient procedures in the United States, 1996. National Center for Health Statistics. Vital Health Statistics. 1998;13:1–119. [PubMed] [Google Scholar]
- 3.2011 Physican Quality Reporting System (Physician Quality Reportiing) Measure Specifications Manual. [January 3, 2012];2011 http://www.cms.gov/pqrs/downloads/2011_PhysQualRptg_MeasureSpecificationsManual_033111.pdf.
- 4.Baxter NN, Goldwasser MA, Paszat LF, et al. Association of colonoscopy and death from colorectal cancer. Ann Intern Med. 2009;150:1–8. doi: 10.7326/0003-4819-150-1-200901060-00306. [DOI] [PubMed] [Google Scholar]
- 5.Weiss NS, Doria-Rose VP. The effectiveness of colonoscopy in reducing mortality from colorectal cancer. Ann Intern Med. 2009;150:817–8. doi: 10.7326/0003-4819-150-11-200906020-00015. [DOI] [PubMed] [Google Scholar]
- 6.Harz C, Henkel TO, Kohrmann KU, et al. Extracorporeal shock-wave lithotripsy and endoscopy: combined therapy for problematic ble duct stones. Surg Endosc. 1991;5:196. doi: 10.1007/BF02653263. [DOI] [PubMed] [Google Scholar]
- 7.Lieberman DA, Holub J, Eisen G, et al. Utilization of colonoscopy in the United States: results from a national consortium. Gastrointest Endosc. 2005;62:875–83. doi: 10.1016/j.gie.2005.06.037. [DOI] [PubMed] [Google Scholar]
- 8.Sonnenberg A, Amorosi SL, Lacey MJ, et al. Patterns of endoscopy in the United States: analysis of data from the Centers for Medicare and Medicaid Services and the National Endoscopic Database. Gastrointest Endosc. 2008;67:489–96. doi: 10.1016/j.gie.2007.08.041. [DOI] [PubMed] [Google Scholar]
- 9.Chronic Conditions Warehouse (CCW) [January 28, 2012]; at http://www.resdac.umn.edu/CCW/data_available.asp.
- 10.Ripley BD. Pattern Recognition and Neural Networks. Cambridge, United Kingdom: Cambridge University Press; 1996. [Google Scholar]
- 11.Breiman L, Friedman JH, Olshen RA, et al. Classification and regression trees. Monterey, CA: Wadsworth & Brooks/Cole; 1984. [Google Scholar]
- 12.Ambroise C, McLachlan JH. Selection bias in gene extraction on the basis of microarray gene-expression data. Proc Natl Acad Sci U S A. 2002;99 doi: 10.1073/pnas.102102699. [DOI] [PMC free article] [PubMed] [Google Scholar]
- 13.Harrell FE. Regression Modeling Strategies: With Applications to Linear Models, Logistic Regression, and Survival Analysis. New York, NY: Springer-Verlag; 2001. [Google Scholar]
- 14.Haque R, Chiu V, Mehta KR, et al. An automated data algorithm to distinguish screening and diagnostic colorectal cancer endoscopy exams. J Natl Cancer Inst Monogr. 2005:116–8. doi: 10.1093/jncimonographs/lgi049. [DOI] [PubMed] [Google Scholar]
- 15.Fisher DA, Grubber JM, Castor JM, et al. Ascertainment of colonoscopy indication using administrative data. Dig Dis Sci. 2010;55:1721–5. doi: 10.1007/s10620-010-1200-y. [DOI] [PubMed] [Google Scholar]
- 16.El-Serag HB, Petersen L, Hampel H, et al. The use of screening colonoscopy for patients cared for by the Department of Veterans Affairs. Arch Intern Med. 2006;166:2202–8. doi: 10.1001/archinte.166.20.2202. [DOI] [PubMed] [Google Scholar]
- 17.Roos LL, Wajda A. Record linkage strategies. Part I: Estimating information and evaluating approaches. Methods Inf Med. 1991;30:117–23. [PubMed] [Google Scholar]
Associated Data
This section collects any data citations, data availability statements, or supplementary materials included in this article.