

Abstract
We report metabolic images of 13C, following injection of a bolus of of hyperpolarized [1-13C] pyruvate in a live rat. The data were acquired on a clinical scanner, using custom coils for volume transmission and array reception. Proton blocking of all carbon resonators enabled proton anatomic imaging with the system body coil, to allow for registration of anatomic and metabolic images, for which good correlation was achieved, with some anatomic features (kidney and heart) clearly visible in a carbon image, without reference to the corresponding proton image. Parallel imaging with sensitivity encoding was used to increase the spatial resolution in the SI direction of the rat. The signal to noise ratio in was in some instances unexpectedly high in the parallel images; variability of the polarization among different trials, plus partial volume effects, are noted as a possible cause of this.
Introduction
Metabolic imaging in vivo, with hyperpolarized carbon substrates [1], enables spatial and temporal resolution of biochemical processes in both normal and diseased states, as is now documented in studies of small and large animals[2–4]. Since the lifetime of the hyperpolarized signal is limited to a few times its T1, the full experimental protocol must typically be completed in under two minutes, necessitating the use of fast data acquisitions; and echo-planar methods have been successful here [5, 6]. Also, the achievable signal to noise ratio (SNR) permits still more rapid data acquisition, and correspondingly shorter time intervals in metabolic time series experiments; and this fact has been utilized in fast imaging experiments, such as spiral acquisition [7], and as well in parallel array reception [8] with sensitivity encoding (SENSE) [9], i.e. under-sampled k space acquisition.
It is desirable in such studies, to record both metabolic images of 13C and anatomic images of 1H in a single examination, without physically moving the experimental subject, which presents certain technical challenges -- notably the development of dual tuned resonators, or of singly tuned resonators with blocking circuitry to allow complementary dual frequency operation.
Here we present metabolic images of hyperpolarized [1-13C] pyruvate and its metabolic products, in the live rat, obtained with both full k space acquisition and SENSE [9], with a two-fold reduction in field of view (FOV). The reduced FOV images show sufficient detail to be convincingly superimposed upon proton anatomic images, taken in the same exam, without repositioning the animal, using the system proton body coil in transceive mode. In fact, the outline of the animal, and some of its organs, e.g. the heart, are seen clearly in the carbon image alone, without reference to the proton image.
Much of the current research with hyperpolarized substrates has been done on clinical MR scanners, with an eye towards eventual medical applications; and this typically imposes a requirement for custom-built hardware. In the present work, a carbon array receive coil, of three elements, and a carbon volume transmitter coil, both with proton blocking, are inserted into the scanner bore, by means of a modified patient cradle, suitable as well for studies with large animals or even human subjects. The electrical designs will be discussed in detail, as well the protocols for data gathering and reconstruction, as none of these are routinely available.
Methods
Hardware
All scans were performed at a static field strength of 3.0 tesla, on a GE Signa™ scanner, with multinuclear option package installed, running system version 14.0. Details of custom coils are as follows. The carbon array receive coil (Figures 1a and 2), is fabricated on flexible circuit board (RT Duroid™ 8800), and comprises three non-overlapped loops of dimension 3.9 in by 1.7 in., each tuned and matched at 32.12 MHz, with capacitive bridges for mutual decoupling. The traces are of 2 oz rolled copper, of width 0.25 in. Each loop also contains an inductor (L1, 1 T 16 AWG magnet wire, 0.25 in ID) which shunt-tunes the apical capacitor to 127.6 MHz for proton blocking. The array elements are joined, via short segments of coaxial cable, and impedance matching and inversion networks to low impedance narrow band preamps. The integration of match capacitor and line length to combine the functions of impedance matching and inversion is described by Edelstein and co-workers [10]; more material on impedance inverters is found in the volume [11] by Matthei et al. Individual dedicated DC lines provide power for preamps, and drive voltage for shunt pin diodes at the preamp inputs, which are biased on during transmission for receiver protection and receive coil blocking.
Figure 1.

Above, schematic of surface receive array of three non-overlapped elements, of dimensions 3.9 in. by 1.7 in. The capacitive blocking networks are adjusted between near neighbor pairs, and do not provide decoupling of remote neighbors. Typical component values are for C1 (resonating) 275 pF, for C2 (decoupling) 150 pF, for C3 (matching) 1000 pF. The inductors L1 for the proton blocks are 1 T 16 AWG magnet wire, 0.25″ I.D. Below, the exemplary version of volume transmit resonator, comprises two loops (12″ square) in a clamshell arrangement, with coupling mesh to separate the Helmholtz from the Maxwell mode (later versions have more distributed capacitors.) Proton blocks --series resonated at 32 MHz so as not to affect overall tuning – are placed in both resonant meshes, and the decoupling mesh as well. Drive is provided through a lattice balun. Typical capacitor values (pF) are: C4 (resonating) 200, C5 (decoupling) 440, C6 (proton block, series) 240, C7 (proton block, parallel) 15, C8 (balun, match) 240; inductors: L2 (proton block) 4 T 16 AWG tinned Cu, wound on ¼-16 thread, L3 (balun) same as L2.
Figure 2.

A) Photograph showing the receive array (top off) mounted inside the clamshell transmitter, on the dedicated patient cradle. Note the hinge mechanism for opening the top member of the clamshell. The individual preamps and DC power lines are visible. B) Corresponding 2D sensitivity profiles for each coil element; the in plane resolution is 1 cm, and the field of view 16 cm by 10 cm.
The transmitter coil (Figure 1b and 2) is designated a transceiver, since it is capable of reception as well as transmission, its main use. It consists of a capacitively coupled Helmholtz pair of type described earlier [12], also built on RT Duroid, with traces of 2 oz. rolled copper, 0.5″ or 0.75″ wide, in different realizations. The individual resonant loops are joined by a capacitive mesh, to give good frequency separation of the Helmholtz (homogeneous) and Maxwell (gradient) normal modes. The input was matched with a lattice balun circuit of conventional design. The transmitter is in fact designed for human and large animal studies, and mounts integrally on a dedicated patient cradle, to negate any possible tip hazard. The upper Helmholtz member is hinged, clamshell fashion, to facilitate patient loading.
Given the large size of the transmitter resonant loops (~ 12 in square) a rugged proton trap assembly was fabricated, comprising an inductor of 5 turns of 18 AWG tinned copper wound on ¼ -16 thread, series tuned for 32.12 MHz, with the series combination then parallel tuned for 127.6 MHz, using high voltage porcelain chip capacitors (ATC™ series E). Two such traps were placed in each loop, and one in the coupling mesh between loops.
The RF feed from the 8 kW 32 MHz transmitter was run through ½ in Heliax™ cable submerged in the custom patient table. The microstrip feed line in a system-supplied connector box was replaced with 0.141 in diameter semi-rigid coaxial cable, terminated in an N type connector, which connected to the Heliax by a stub of RG-8 cable.
While the receive elements were actively detuned by pin diodes during transmission, the converse – active detuning of the transmitter coil during reception – was not implemented in this study, given the relative complexity of the necessary system modifications.
Potential drawbacks of this situation are the increased crosstalk among array elements, and its concomitants, the appearance of intensity artifacts in the images, and the loss of SNR. We may dispose of intensity artifacts by noting that none of our phantom images display the signal voids which typically arise from reactive coupling; based upon an earlier quantitative analysis [13] we then estimate the crosstalk between neighboring receive loops as below −15 dB. This is consistent with the relatively clean delineation of the receive elements, as seen in the sensitivity maps from an oil phantom (cf Figure 2b). The corresponding loss of SNR is roughly estimated by applying a theoretical treatment originally given for crosstalk between channels of a birdcage resonator [14]. With crosstalk in dB given by −20 log η, the SNR is reduced by the factor . For couplings below −15 dB this is negligible. Since the formula we give is not strictly applicable for array reception (its derivation assumes uncorrelated noise in the uncoupled channels, and preamps matched to the system impedance) we estimate an upper bound by postulating a worst case coupling of − 6dB. The corresponding SNR loss would then be 10%.
Then since the transmitter coil itself acts as a sink for any leakage signal originating in a receive loop, the fractional loss in SNR from transmit to receive coil leakage is just the energy (or power) loss: −10 dB crosstalk specifies a signal energy loss of 10%; this leaves 90% residual energy; i.e. an energy decrement of 0.46 dB. This is also the SNR drop in dB, which corresponds to a loss of about 5%. Assuming then that both mechanisms act additively, the net worst case SNR loss due to lack of transmitter blocking is estimated at 15% with crosstalk as stated. We emphasize that this is a worst case upper bound estimate.
Polarizer and compound
Samples of 32μl [1-13C] pyruvic acid (Isotec Inc., Miamisburg, OH) and 15mM OX63 trityl were polarized and dissolved using a Hypersense DNP polarizer (Oxford Instruments), as described previously[2]. Immediately after dissolution, an aliquot of the pyruvate solution was used to measure the liquid state polarization using a home-built low-field NMR spectrometer. The measured polarization was typically in the range 16% to 20%.
Animal Handling
Animal studies (a total of five rats scanned) were carried out under a protocol approved by the local Institutional Animal Care and Use Committee. Normal Male Sprague-Dawley rats were placed on a heated pad and anesthetized with isoflurane (2–3%). Fig. 2 shows the receive array on the patient bed, with the cover off, to display the individual resonant loops. The rats were positioned face down, atop the array and along its length (the cover having been replaced). Then, viewed by an observer standing in front of the magnet and looking into the bore, the rat’s head would be to the left, and the tail to the right (or vice versa); that is, consistency in rostral-caudal orientation was not observed. Also, note that in the following, all descriptions of imaging coordinates are given in an LR/SI/AP system with respect to the animal.
Boluses of hyperpolarized pyruvate with volume 2.5 ml were injected through a tail vein catheter, over a period of 12 s. Two acquisitions were done in a given animal study—the first with full FOV acquistion, the second with reduced FOV (for reconstruction with SENSE) -- with ~1 hour separating the experiments, so that each animal spent ~2.5 hours in the MRscanner; that is, the full and reduced FOV data were acquired with separate injections of a hyperpolarized bolus. Note that all subsequent figures comparing data from full and reduced FOV (i.e. SENSE) acquisitions are from the same animal in the same run. Also since the full and reduced acquistions have the same size of data matrix, the timing of the arrival of the bolus, with the acquisition of the center of k space, is the same in both.
Proton Imaging
While the principle focus of this study is metabolic imaging with a hyperpolarized 13C enriched substrate, proton anatomic imaging was a pre-requisite for each carbon scan, to aid in localization of the subsequent 13C scans, and to allow for registration of the reconstructed 13C metabolite maps to the anatomy. Coronal T2-weighted 1H (body coil) images were therefore acquired with 20 cm FOV, 256 × 192 matrix, (freq. direction = R/L, with respect to the animal), 4 mm thick slices (12 to 15 in number), TE / TR = 100ms / 4s, 6 NEX and total scan time of about 10 minutes.
Chemical Shift Imaging(CSI) of Carbon
Chemical shift imaging of carbon was performed with spatial encoding in two or three dimensions, with radiofrequency excitation always in the coronal plane. The spatial resolution and dimensions of the encoding matrices are summarized in Table 1. For the two-dimensional scans data acquisition started 25s after the start of the injection. A pulse-acquire sequence was used, with a 10 degree flip angle and 80ms TR. The spectral bandwidth was 5000 Hz, and 256 spectral (time domain) points were acquired per spatial encoding point. All 2D data were taken with an excitation slab of thickness 1cm. The total acquisition time was 12.8 seconds. In a typical experiment, this procedure was repeated an hour later, as dictated by the time needed to prepare a second bolus.
TABLE 1.
Summary of Acquisition Parameters, and Dimensions and Resolutions of Encoding Matrices; also Dimensions and Fields of View for Reconstructed Metabolic Images a
|
Data Acquisition
|
||||
|---|---|---|---|---|
| Full FOV | SENSE (Reduced FOV) | |||
| Matrix | Resolution | Matrix | Resolution | |
| Acquired in Two Dimensions | 16 × 10, SI x LR b | 1 × 1 (in plane) | 16 × 10, SI x LR | 0.5 × 1 (in plane, acquired) |
|
| ||||
| Acquired in Three Dimensions | 16 × 8 × 16 SI x LR x AP b | 1 × 1 × 1 | 16 × 8 × 16 SI x LR x AP | 0.5 × 1× 1 (acquired) |
| Data Reconstruction | ||||
|---|---|---|---|---|
| Full FOV Matrix | Spatial Extentc | SENSE Matrix | Spatial Extentc | |
| Reconstructed in Two Dimensions | 16 × 10, SI x LR | 16 × 10 | 32 × 20d, SI x LR | 16 × 10 |
|
| ||||
| Reconstructed in Three Dimensions | 16 × 8 × 16 SI x LR x AP | 16 × 8 × 16 | 32 × 16 × 16 SI x LR x AP | 16 × 8 × 16 |
all fields of view and resolutions in centimeters.
Anatomic coordinates in rat: LR ~ left-right; SI ~ superior inferior; AP ~ anterior posterior.
field of view dimensions.
Zero filled for isotropic voxels.
For three-dimensional scans, two dimensions of phase encoding were augmented by a third of frequency encoding, through the use a flyback echo-planar readout [6], with the gradient applied in the direction of the static field B0. The acquisition was timed to begin 35s after the start of the injection. A double spin echo pulse sequence was used [5], with a progressive flip-angle [4], a 15 cm slab excitation pulse and concentric phase encoding with TE/TR=50/126ms. Each flyback readout yielded 16 k spatial points and 59 spectral points, with a spectral bandwidth of 581 Hz; the total acquisition time was 16 seconds.
Image reconstruction and data analysis
All data sets, whether comprising both full k space and reduced k space, were zero-filled in the right-left direction of the animal, to give isotropic voxels in plane. Spectra were reconstructed using custom software that included phase, frequency, and baseline correction prior to combining data from the individual coils [15, 16]. For SENSE reconstruction, the phased corrected spectra were unfolded along the animal SI direction of the datasets (i.e. along the head – tail direction of the animal) to regain the full FOV, using methods described elsewhere [15, 16]. The sensitivity maps used in both the SENSE reconstruction and combination of the full FOV spectra from the different coil elements, were generated from a 3D 13C MRSI dataset acquired after replacing the animal with a phantom comprising corn oil in a stout plastic bag. SNR maps were created for each metabolite from the peak heights of the spectra and normalized by the percent polarization estimated for each run. While the 2D acquisitions afforded spectroscopic 400 points per voxel to calculate the standard deviation of the noise, only 40 noise points per voxel could be obtained for the 3D acquisitions due to the small spectral bandwidth. Spearman rank correlation coefficients were calculated to compare peak SNR values between the full FOV dataset and SENSE dataset reconstructed at the same lower in-plane resolution (1cm × 1cm).
To compare the signal to noise ratio between the SENSE and FOV data (cf Fig. 6 below) it was necessary to reconstruct the spectra at the same spatial locations. This was achieved by fourier transforming the fully reconstructed SENSE data back into k-space and then, for each spatial point corresponding to the full field of view data, appropriately phase weighting the k-space values and adding them. The effective spatial resolution of the spectra was maintained by this procedure and the expected signal to noise ratio of the SENSE data was then that of the full FOV data multiplied by a factor of 0.5 times the geometry factor.
Figure 6.
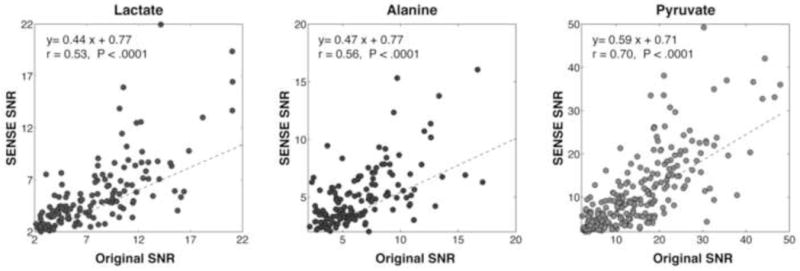
Plots of lactate, alanine and pyruvate SNR for SENSE vs. full FOV acquistions. The reconstruction the SENSE data was customized for the comparison as described under Methods.
Results
Figure 3 gives a global comparison of a two dimensional carbon spectral dataset for the SENSE acquisition, side by side with the corresponding proton anatomical image, on which the spectral grid is superposed. The spectra are of comparable quality to those from the full FOV acquisition (this will be illustrated below in more detail); and they align reasonably well with the corresponding anatomy (despite an apparent upward displacement of the right kidney, of which more below, as well). Furthermore, they demonstrate minimal, if any, residual aliasing artifacts. Most notably, the heart is visualized almost without reference to the proton image.
Figure 3.
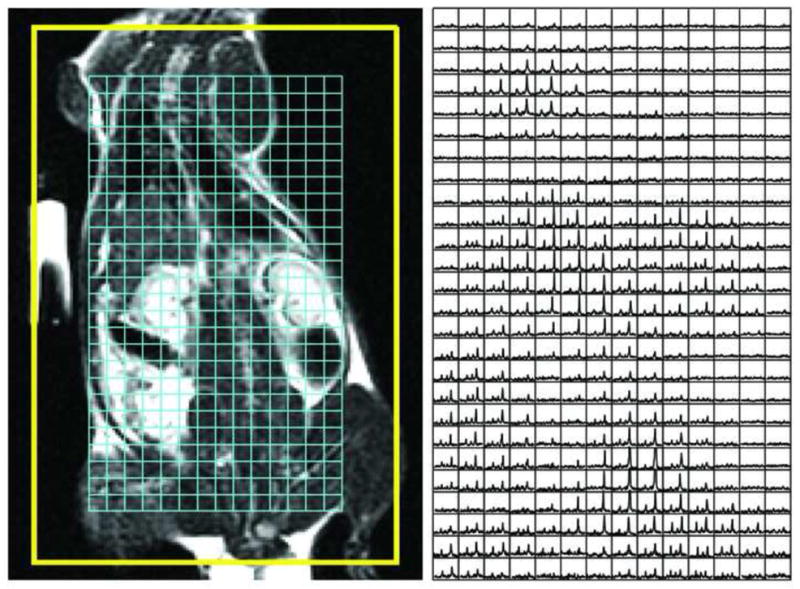
Overlay of a 2D SENSE spectral dataset on the coronal proton anatomic image. Refer to the text for details.
Figure 4 shows colormaps of the 13C pyruvate images superposed on proton images (in monochrome), with two dimensional data on the left, and three dimensional on the right. The two dimensional images include a SENSE acquisition (above) and full FOV (below); the three dimensional images are both SENSE acquisitions. In general, the heart is clearly identified in the carbon images; the overall spatial definition appears somewhat improved in the SI direction of the two dimensional SENSE data. That is, the abdominal region the two dimensional full FOV image exhibits a certain smearing of intensity not seen in the the SENSE images.
Figure 4.

Pyruvate metabolic images (color) overlaid on anatomic images (monochrome) from the same exam. In A, 2D data: SENSE (R= 2) above and full FOV below, of same slice. In B, 3-D SENSE images (R= 2) from different slices.
The localization of the kidneys is markedly better in three dimensions than in two, but this may be due simply to the different slice positions in the various data sets. In particular, the two dimensional slices include strong contributions from pyruvate in the liver, a lobe of which may produce the apparent upward displacement in the position of the kidney (relative to the proton image.) This effect is avoided in the three dimensional data, in which the liver is now localized in a different slice.
Figure 5 offers a detailed view of spectra from various regions of interest, and different acquisitions. In 5A are shown pyruvate spectra of the heart, from two dimensional data, with full FOV acquisition (left) and with SENSE (right). As expected, the SENSE data show cleaner localization in the SI direction of the animal, at the cost of some reduction in SNR. Although this reduction accords with intuition, it is not logically required, given the variable polarization --typically in the range 16% to 20% as noted above-- achieved in different runs. This is seen in figure 5B, where we compare the spectra from three dimensional acquistions, with full FOV and SENSE, from kidney (left) and liver (right). An inlay shows a simulated spectrum, with pyruvate at high field, lactate at low field (estimated at -185 ppm from DSS) and alanine between the two. Visual inspection of three dimensional data for kidney shows the SNR for SENSE exceeds that with full FOV acquisition; we tentatively attribute this to a combination of variable polarization from trial to trial, and partial volume effects (discussed below.) We note in any case the clear visualization of alanine in the liver, in both the SENSE and full FOV spectra.
Figure 5.

Localized spectra from various organs, overlaid on anatomic images. in (A) 2D and (B) 3D acquisitions, with both SENSE (R=2) and full FOV. The inlay in the anatomic image (lower right) shows a simulated carbon spectrum with peak order (from high-field to low) pyruvate, alanine, lactate. The scale is estimated ppm from DSS, with lactate assigned to −185 ppm.
Table 2 presents a comparison of selected SNR numbers for various spectroscopic peaks from SENSE and full FOV acquistions, scaled by the apparent measured polarization; the SENSE data are not scaled by the geometry factors, whose inverse products with the reduction factor are nonetheless tabulated for comparison. Figure 6 gives the corresponding correlation plots of SNR with SENSE versus that with full FOV. As discussed below, the expected slope of the correlation is 0.5, on the hypothesis of unit geometry factor, i.e. g = 1, a condition which is roughly met, despite the large scatter. The scatter in fact appears biased towards unexpextedly high SNR for sense, a trend also noted above for Figure 5, as well as visualized in Table 2. We suspect this is to the smaller voxel size achieved in the SENSE data gives a carbon spectrum less diluted by partial volume effects, and therefore with unexpectedly high SNR.
TABLE 2.
selected Values of Signal to Noise of Metabolites in Different Regions, for full FOV and SENSE Acquisition
| Metabolite | Region | 2D/3D | SNR full FOV | SNR SENSE | Ratio a | 1 (g × R) b |
|---|---|---|---|---|---|---|
| pyruvate | heart | 2D | 18 | 14 | 0.78 | 0.45 |
| pyruvate | liver | 2D | 17 | 16 | 0.94 | 0.50 |
| pyruvate | kidney | 2D | 18 | 13 | 0.72 | 0.43 |
| lactate | heart | 2D | 3 | 4 | 1.33 | 0.45 |
| lactate | liver | 2D | 8 | 7 | 0.87 | 0.42 |
| lactate | kidney | 2D | 6 | 4 | 0.67 | 0.43 |
| alanine | liver | 2D | 2 | 3 | 1.50 | 0.42 |
|
| ||||||
| pyruvate | heart | 3D | 14 | 27 | 1.93 | 0.42 |
| pyruvate | liver | 3D | 17 | 13 | 0.76 | 0.34 |
| pyruvate | kidney | 3D | 20 | 11 | 0.55 | 0.42 |
| lactate | heart | 3D | 6 | 8 | 1.33 | 0.42 |
| lactate | liver | 3D | 8 | 5 | 0.62 | 0.34 |
| lactate | kidney | 3D | 7 | 2 | 0.28 | 0.42 |
| alanine | liver | 3D | 8 | 5 | 1.6 | 2.9 |
SNR SENSE/ SNR full FOV
geometry factor x reduction factor
Discussion
The present work indicates the scope of technical requirements for multichannel metabolic imaging with carbon. Our approach to transduction is aimed mostly at simplicity, in that we use the system proton antennas as much as possible, and restrict the custom hardware to carbon. The signal to noise achieved in these experiments is inferior to other work on rats from our laboratory, using a custom volume coil; but straightforward improvements, such as shrinking the coil dimensions, and increasing the coil count in a wrap-around geometry, should improve this. Also, the implementation of transmitter disabling during reception should help.
While this study is aimed at methodology, rather than biology, we find it curious and interesting that pyruvate is preferentially sequestered in certain organs, in preference to muscle. Given the locus of the injection, there is no preferred target for perfusion, yet binding and subsequent metabolism occur to a degree sufficient to allow visualization of heart, kidney, and liver at the very least.
This study demonstrated the feasibility of using parallel imaging with SENSE to increase the resolution of 13C MRSI. By incorporating SENSE and flyback in different directions of a 3D acquisition, we were able to acquire 4096 voxels with a 0.5cc spatial resolution in 16s without significantly compromising the overall quality of the spectra. While an acquisition with reduced field of view is used here to improve spatial resolution, it also affords a faster acquisition for metabolic imaging combining spatial and temporal resolution.
To validate our method of reference scanning, i.e. with a separate oil phantom, we have compared 13C acquisitions both with and without SENSE on the same animal, and in the same set up; and we note that the localization of the organs (e.g. heart and kidney) is substantially unchanged. This is seen, for instance, in the 2-D color pyruvate images of Figure 4, where the heart is clearly visualized in both the SENSE (above) and full FOV (below) acquisitions. Beyond this, we note the good registration – with and without SENSE-- of the characteristic localized organ spectra in Figure 5, where the 3D data show typical spectra of kidney (high pyruvate to lactate ratio), in correct alignment with the proton image. The same figure also shows characteristic spectra of liver (low pyruvate to lactate ratio, more prominent alanine peak), with proper location. Note the signal voids in the anatomic image at lower left (Figure 5 B) showing the outlines of the lungs.
Finally the question of Signal to Noise ratio in the SENSE experiments deserves some consideration, since a conventional SENSE experiment with reduction factor of two should experience a loss of SNR equal to the geometry factor times √2. The venerable decrement by the square root of the reduction factor is universally acknowledged, but poorly understood, being usually attributed to the shortened acquistion, but in fact due to noise aliasing. A a square image of pure noise (we suppose the RF transmitter turned off) is indistiguishable in the phase encode and frequency encode directions. (We suppose equal fields of view in both directions, even though no image signal is acquired.) The corresponding noise image, say with reduction of 2, is simply the original square image with every other phase encode line thrown out. This amounts to undersampling and aliasing of the noise in the phase encode dimension, just as the image is undersampled and aliased. However, the SENSE reconstruction unfolds the image alias, but not the noise, since the noise contains no spatial information and is therefore not subject to unfolding by image based techniques. Then the increase in resolution in our present data collection scheme doubles the acquired noise energy, without adding much signal energy (supposing the object being studied to have most of its signal energy in the lower order regions of k space.) This additional doubling of noise energy produces a further reduction of SNR by √2, for a net reduction of 2 x the geometry factor.
Acknowledgments
This work was supported by the National Institutes of Health (NIH Grant RO1 EB007588), by the University of California (Discovery Grant ITL-BlO04-10048), and by GE Healthcare Technologies.
Footnotes
A preliminary version of this work was presented at the meeting of the International Society for Magnetic Resonance in Medicine, Honolulu, 2009.
Publisher's Disclaimer: This is a PDF file of an unedited manuscript that has been accepted for publication. As a service to our customers we are providing this early version of the manuscript. The manuscript will undergo copyediting, typesetting, and review of the resulting proof before it is published in its final citable form. Please note that during the production process errors may be discovered which could affect the content, and all legal disclaimers that apply to the journal pertain.
References
- 1.Golman K, Ardenkjaer-Larsen JH, Petersson JS, Månsson S, Leunbach I. Molecular imaging with endogenous substances. Proc Natl Acad Sci USA. 2003;100:10435–10439. doi: 10.1073/pnas.1733836100. [DOI] [PMC free article] [PubMed] [Google Scholar]
- 2.Chen AP, Albers MJ, Cunningham CH, Kohler SJ, Yen Y-F, Hurd RE, Tropp J, Bok R, Pauly JM, Nelson SJ, Kurhanewicz J, Vigneron DB. Hyperpolarized C-13 spectroscopic imaging of the TRAMP mouse at 3T - Initial experience. Magn Reson Med. 2007;58:1099–1106. doi: 10.1002/mrm.21256. [DOI] [PubMed] [Google Scholar]
- 3.Nelson SJ, Chen AP, Bok R, Albers M, Zierhut ML, Kurhanewicz J, Vigneron DB, Kohler S, Yen Y-F, Tropp J, Gram A, Wolber J, Dirven H, Hurd RE. Hyperpolarized C-13 MRSI data of Dog Prostate at 3T. Proc. 15th ISMRM; 2007. p. 536. [Google Scholar]
- 4.Yen Y-F, Kohler SJ, Chen AP, Tropp J, Bok R, Wolber J, Albers MJ, Gram KA, Zierhut ML, Park I, Zhang V, Hu S, Nelson SJ, Vigneron DB, Kurhanewicz J, Dirven HAAM, Hurd RE. Imaging considerations for in vivo 13C metabolic mapping using hyperpolarized C-pyruvate. Magn Reson Med. 2009;62:1–10. doi: 10.1002/mrm.21987. [DOI] [PMC free article] [PubMed] [Google Scholar]
- 5.Cunningham CH, Chen AP, Albers MJ, Kurhanewicz BJ, Hurd RE, Yen Yi-F, Pauly JM, Nelson SJ, Vigneron DB. Double spin-echo sequence for rapid spectroscopic imaging of hyperpolarized 13C. J Magn Reson. 2007;187:357–362. doi: 10.1016/j.jmr.2007.05.014. [DOI] [PubMed] [Google Scholar]
- 6.Cunningham CH, Vigneron DB, Chen AP, Xu D, Nelson SJ, Hurd RE, Kelley DA, Pauly JM. Design of flyback echo-planar readout gradients for magnetic resonance spectroscopic imaging. Magn Reson Med. 2005;54:1286–89. doi: 10.1002/mrm.20663. [DOI] [PubMed] [Google Scholar]
- 7.Mayer D, Yen Y-F, Tropp J, Pfefferbaum A, Hurd RE, Spielman DM. Application of subsecond spiral chemical shift imaging to real-time multislice metabolic imaging of the rat in vivo after injection of hyperpolarized 13C1-pyruvate. Magn Reson Med. 2009;62:557–564. doi: 10.1002/mrm.22041. [DOI] [PMC free article] [PubMed] [Google Scholar]
- 8.Arunachalama A, Whitt D, Fish K, Giaquinto R, Piel J, Watkins R, Hancu I. Accelerated spectroscopic imaging of hyperpolarized C-13 pyruvate using SENSE parallel imaging. NMR in Biomedicine. 2009;22:867–873. doi: 10.1002/nbm.1401. [DOI] [PubMed] [Google Scholar]
- 9.Pruessmann KP, Weiger M, Scheidegger MB, Boesiger P. SENSE: sensitivity encoding for fast MRI. Magn Reson Med. 1999;42:952–962. [PubMed] [Google Scholar]
- 10.Edelstein WA, Hardy CJ, Mueller O. Electronic decoupling of surface-coil receivers for NMR imaging and spectroscopy. J Magn Reson. 1986;67:156–161. [Google Scholar]
- 11.Matthaei G, Young L, Jones EMT. Microwave Filters, Impedance-Matching Networks, and Coupling Structures. Artech House; Dedham MA: 1980. p. 434 ff. [Google Scholar]
- 12.Tropp J, Sugiura S. A dual-tuned probe and multiband receiver front end for X-nucleus spectroscopy with proton scout imaging in vivo. Magn Reson Med. 1989;11:405–412. doi: 10.1002/mrm.1910110315. [DOI] [PubMed] [Google Scholar]
- 13.Tropp J, Schirmer T. Spatial dependence of a differential shading artifact in images from coil arrays with reactive cross-talk at 1.5 T. J Magn Reson. 2001;151:146–151. doi: 10.1006/jmre.2001.2329. [DOI] [PubMed] [Google Scholar]
- 14.Tropp J, Derby K. The loss of signal to noise due to imperfect isolation between channels of a quadrature nuclear magnetic resonance probe. Rev Sci Inst. 1991;62:2646–2653. [Google Scholar]
- 15.Ozturk E, Banerjee S, Majumdar S, Nelson SJ. Partially parallel imaging of gliomas at 3.0 T. Conf Proc IEEE Eng Med Biol Soc. 2006;1:493–6. doi: 10.1109/IEMBS.2006.259793. [DOI] [PubMed] [Google Scholar]
- 16.Nelson SJ. Analysis of volume MRI and MR spectroscopic imaging data for the evaluation of patients with brain tumors. Magn Reson Med. 2001;46:228–239. doi: 10.1002/mrm.1183. [DOI] [PubMed] [Google Scholar]