Abstract
Golgi impregnation is unique in its ability to display the dendritic trees and axons of large numbers of individual neurons by histology. Here we apply magnetic resonance microscopy to visualize the neuroanatomy of animal models by combining histologic fixation chemistry with paramagnetic contrast agents. Although there is some differential uptake of the standard small-molecular-weight contrast agents by different tissue types, detailed discrimination of tissue architecture in MR images does not approach that of standard histology. Our modified Golgi impregnation method significantly increases anatomic detail in magnetic resonance microscopy images. Fixed mouse brains were treated with a solution containing a paramagnetic contrast agent (gadoteridol) and potassium dichromate. Results demonstrate a specific contrast enhancement likely due to diamagnetic hexavalent chromium undergoing tissue specific reduction to paramagnetic trivalent chromium. This new method dramatically improves neuroanatomical contrast compared to conventional fixation, displaying detail approximating that of histologic specimens at low (4×) magnification.
Keywords: Contrast agent, Golgi stain, neuroanatomy, mouse, microMRI, histology
In the late 19th century, Camillo Golgi revolutionized the budding discipline of neuroscience with his black reaction (1,2), now known as the Golgi stain. This reaction stains a small eclectic, likely random, subset of neurons and processes in the brain tissue. The Golgi stain, also called Golgi impregnation, consists of pretreatment with potassium dichromate and other additives (3), followed by “development” with silver nitrate, resulting in black deposits clearly delineating soma, axons, and dendrites against a yellow background.
Although there is much speculation as to what precisely produces the black reaction product, it is currently agreed that Golgi staining consists of two steps: chromation and impregnation. The first step comprises secondary fixation of the tissue with potassium dichromate (K2(Cr2O7)), a powerful oxidizer, after formaldehyde fixation (3). The second step consists of immersion of the specimen in a silver nitrate (AgNO3) solution, and the end products of this reaction between K2(Cr2O7) and AgNO3 may be either silver dichromate (Ag2Cr2O7) or silver chromate (Ag2CrO4). It is in this step that individual neurons turn almost black. The specific oxidation of lipids exposed to aqueous solutions of potassium dichromate has been used for histologic staining of myelin (4). It has been suggested that a set of substances in the chromation, such as formaldehyde, sucrose, or hydrogen peroxide, reduces the hexavalent chromium (Cr(VI)) of the potassium dichromate to trivalent chromium (Cr(III)) (5-7). Based on the assumption that a reduction of diamagnetic hexavalent chromium to paramagnetic Cr(III) by lipid oxidation would cause a shortening of the T1 and T2 of surrounding water and/or lipid protons, potassium dichromate has been studied as an MRI contrast agent (5). As reported recently, the extracellular diffusion of K2(Cr2O7) after intraventricular injection leads to a mild enhancement of white matter structures (6).
MR histology with different weighting schemes (T1-weighted, T2-weighted, proton density weighted, etc.), together with various contrast agents in conjunction with perfusion fixation, is being developed in an effort to highlight specific details (7-13). Although this approach is limited to fixed tissue, it affords significantly better spatial resolution and contrast than is achievable with in vivo MRI, thus providing complementary information to that obtained in vivo. In this approach, contrast in the MR image arises from physiochemical heterogeneity in the underlying tissue structure that modulates the concentration and relaxation characteristics of the water protons within the tissue (7). However, contrast agents typically reduce the effective T1 and T2 of all the tissues and thus can increase the signal-to-noise ratio, enhancing detection of anatomic detail. We hypothesized that, just as pretreatment with K2(Cr2O7) alters tissue properties in a dramatic way for subsequent silver staining, these altered tissue properties would result in different MRI contrast with gadolinium due to Cr(III) reduced from Cr(IV) and/or differential absorption of gadoteridol (Gd-HP-DO3A), a typical MR contrast agent. Enhanced or differential relaxation resulting from local retention of the reaction products would lead to higher contrast between tissue structures and thus better definition of anatomic features in a manner analogous to the Golgi black reaction. Such increased detail will allow more facile detection of small anatomic abnormalities by MRI.
MATERIALS AND METHODS
Adult male mice (C57BL/6, n = 27) were used in the study. The animals were deeply anesthetized with tribromoethanol Avertin (Sigma-Aldrich, St. Louis, MO) intraperitoneal injection (i.p.) and transcardially perfused with 30 mL of heparin saline (5 units/mL), followed by 30 mL of 1% paraformaldehyde. The mice were decapitated and the heads placed in 4% paraformaldehyde for 24 h. The skin, lower jaw, ears, and cartilaginous nose tip were then removed, and the brains within the intact skull were processed by soaking them for 5 days at 4°C in one of four different solutions (each containing 0.01% sodium azide as a bacteriostatic): (1) phosphate-buffered saline pH 7.4 only; (2) potassium dichromate solution K2(Cr2O7); (3) Gd-HP-DO3A (Pro-Hance; Bracco Diagnostics Inc., Princeton, NJ); and (4) potassium dichromate plus Gd-HP-DO3A solution. To determine suitable concentrations of K2(Cr2O7) and Gd-HP-DO3A for MRM, two concentrations (3% and 6%) of K2(Cr2O7) in 5 mM and 10 mM of Gd-HP-DO3A were studied with three mice in each solution and concentration. Thus, a total of nine different solutions were examined. Although many modifications of this protocol are possible, previous studies with Gd-HP-DO3A alone (13) indicate that these parameters are reasonable starting points.
MR Microscopy
After soaking, brains in the skull were mounted in a 20mm-diameter glass tube filled with proton-free per-fluoro-polyether fomblin (Ausimont, Thorofare, NJ) to limit tissue dehydration, as well as susceptibility effects at the surface of the specimen. Imaging was performed in a vertical-bore 11.7-T (500-MHz) Bruker AVANCE imaging spectrometer with a microimaging gradient insert and 20mm birdcage radiofrequency coil. T1 and T2 were mapped in five coronal images positioned over the head of hippocampus (field of view = 2 × 2 cm, slice thickness = 1.0mm, number average = 4, acquisition matrix = 128 × 128) to assess the reduction in relaxation times. T1 maps were collected using a spin-echo sequence with seven pulse repetition times ranging from 0.06 to 3.5 sec and echo time = 5.3 ms. T2 maps were acquired using a multislice multiecho sequence with the parameters pulse repetition time = 2000 ms, echo time = 4.3–43 ms, number of echoes = 10. The T1 and T2 maps were obtained by a least-squares nonlinear exponential fit of the signal intensities, using the simplex algorithm provided by ImageJ (14). Three-dimensional (3D) images were acquired with two image protocols: T1-weighted 3D spin-echo with pulse repetition time/echo time, 50 ms/4.2 ms, and T2* weighted 3D fast low angle shot (FLASH) (pulse repetition time/echo time, 50 ms/4.2 ms; flip angle = 30°) with the same image matrixes (512 × 256 × 256) and field of view (field of view: 25 × 12.5 × 12.5mm3) for a voxel size of 50 (3) μm3. The total imaging time was 12 h for each protocol (number of acquisitions = 12). To reduce the noise, all scans were performed at 4°C.
The contrast-to-noise ratios (CNR) in selected brain locations were calculated using a region of interest of 4 × 4 pixels in slices through the stratum oriens, molecular layer of the hippocampus, and periaqueductal gray matter and a noise region of 10 × 10 pixels outside the brain. To ensure accuracy, each determination included three adjacent slices in images from three animals. The CNR was determined for selected brain locations as compared to a similar region of interest in the cortical white matter of the same slice according to the following: CNR = (S – Scortical white matter)/SDnoise; with S the mean signal intensity of the selected structure, Scortical white matter the mean signal intensity of cortical white matter in the same image, and SDnoise the standard deviation of noise determined outside the brain. All CNR measurements were performed in ImageJ (16). A two-tailed Student t test was used for statistical analyses. Statistical significance was accepted at a P value less than 0.01. All of the numerical data are presented as averages ± standard deviation.
Histology
After the brains were scanned, they were processed for histology. Two brain samples treated with 3% K2(Cr2O7) with or without 5-mM Gd-HP-DO3A were kept in 4% paraformaldehyde in phosphate-buffered saline and embedded in one gelatin block. The block was freeze sectioned at 35 μm with a sliding microtome, producing free-floating coronal sections (Neuroscience Associates, Knoxville, TN). Alternating sections were stained in solution for Thionine (Nissl), autometallography, and diaminobenzidine (15,16). Diaminobenzidine staining was performed by incubating sections in 0.05% diaminobenzidine, 50-mM Tris/HCl pH 7.4, and 0.01% H2O2. Incubation with silver nitrate did not produce any black precipitate in brains treated either with dichromate alone or together with Gd-HP-DO3A. After staining, sections were mounted on glass microscope slides and coverslipped under Permount (EM Sciences). Images were captured in brightfield on a Zeiss Axioscope Z1 microscope with an HRM Axiocam running Axiovision 4.5 software. The correspondence between images acquired by MRM and histology was determined by visual assessment of the best match of anatomic landmarks.
RESULTS
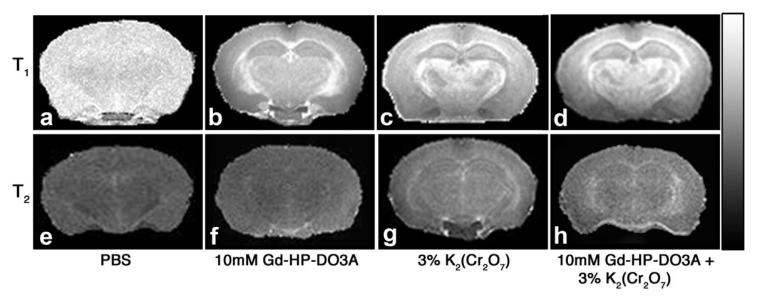
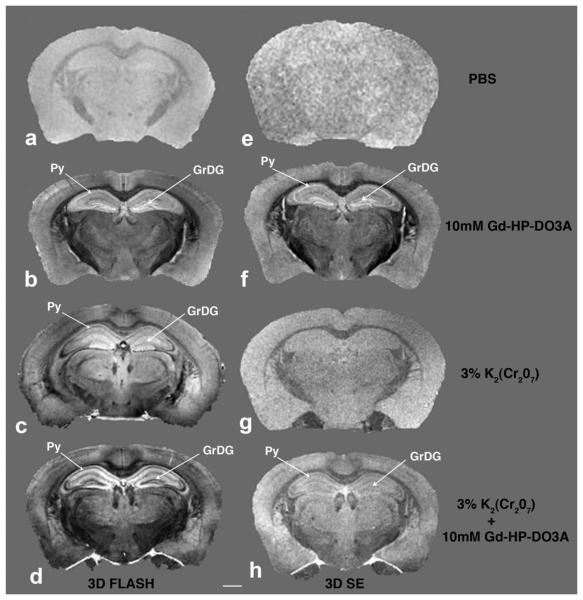
T1 and T2 maps of samples treated with the four solutions are shown in Fig. 1. The phosphate-buffered saline T1 map is relatively featureless, with average T1 over the whole slice of 1.6 ± 0.1 sec. T1 maps with chromate, Gd-HP-DO3A, and chromate plus Gd-HP-DO3A (Fig. 1b-d, respectively) are qualitatively similar, with high values in heavily myelinated regions (e.g., external capsule) and lower values in hippocampus and cortex. The phosphate-buffered saline and Gd-HP-DO3A T2 maps are relatively featureless (average T2 values over whole slice of 24 ± 5 ms and 8 ± 1 ms, respectively), while T2 maps with chromate and chromate plus Gd-HP-DO3A exhibit somewhat shorter T2 values in heavily myelinated regions (average T2 values over whole slice of 16 ± 2 ms and 8 ± 1 ms, respectively). Coronal slices through the hippocampal region of the 3D MR images of samples subjected to each of the four different impregnation solutions are shown in Fig. 2.
FIG. 1.
Example T1 (top) and T2 (bottom) maps from four impregnation procedures. The images represent a single 1mm slice extracted from a five-slice data set. A linear grayscale was used with a range from 0 to 2000 ms for (a), 0 to 350 ms for (b-d), 0 to 200 ms for (e) and 0 to 20 ms for (f-h).
FIG. 2.
Comparison of MR images of samples with four impregnation procedures. Left column (a-d) are 3D FLASH MR images; right column (e-h) are spin-echo T1-weighted MR images. Note hyperintense bands in the pyramidal (sp) and granular cell layer of the hippocampus (sg) in the 10-mM Gd-HP-DO3A sample (b,f) and hypointense bands in these structures in K2(Cr2O7) plus Gd-HP-DO3A (c,d). Cortical layers as well as apparent nuclei and tracts in the striatum are also distinguished by increased CNR. Scale bar = 1mm.
In the right column, it is apparent that in spin-echo T1-weighted images the four procedures afford qualitatively different contrast but that the images exhibit less anatomic detail than the corresponding 3D FLASH images in the left column. The FLASH sequence employed to obtain the left column provides both T1 and T2* weighting. In the hippocampus of samples impregnated with Gd-HP-DO3A (Fig. 2b and f), we observe hyperintensity in the granule cell layer of the dentate gyrus, stratum pyramidale of cornu ammonis area 1 (CA1), and less so in cornu ammonis area 2 (CA2). Globus pallidus is also hyperintense against the surrounding striatum. Major myelinated tracts (e.g., anterior commissure, corpus callosum, internal and external capsules, fasciculus retroflexus) generally appear hypointense in the Gd-HP-DO3A-only samples.
Each impregnation procedure provided qualitatively different contrast, with the wealth of anatomic detail most apparent in the dichromate-gadolinium-treated brains imaged with FLASH. CNR values for selected brain structures as compared with cortical white matter prepared with two different concentrations of K2(Cr2O7) and Gd-HP-DO3A imaged with FLASH protocol indicated that the samples treated with both compounds improved tissue contrast in the selected regions (Table 1). The best CNR was obtained with 3% K2(Cr2O7), while at 6% with the same Gd-HP-DO3A concentration decreased CNRs were observed. Thus, the 3D FLASH images of brains treated with 3% K2(Cr2O7) and 5- and 10-mM Gd-HPD-O3A showed the highest CNR, yielding superior anatomic information.
Table 1.
CNRs
| PBS | 3% K2(Cr2O7) | 6% K2(Cr2O7) | ||
|---|---|---|---|---|
| PBS | Or | 12 ± 0.6 | 205 ± 14 | 315 ± 12 |
| Mol | 2.6 ± 0.9 | 270 ± 9 | 259 ± 9 | |
| PAG | 5.6 ± 0.5 | 222 ± 10 | 291 ± 5 | |
| 5-mM Gd-HP-DO3A | Or | 268 ± 11 | 905 ± 17* | 497 ± 10** |
| Mol | 440 ± 22 | 609 ± 15* | 604 ± 8** | |
| PAG | 232 ± 20 | 914 ± 22* | 358 ± 10** | |
| 10-mM Gd-HP-DO3A | Or | 235 ± 12 | 853 ± 25* | 252 ± 8*** |
| Mol | 437 ± 14 | 872 ± 16* | 372 ± 25*** | |
| PAG | 253 ± 7 | 841 ± 17* | 227 ± 6*** |
CNRs from 3D FLASH images for selected brain regions compared with cortical white matter treated with three different concentrations of K2(Cr2O7) (0, 3%, and 6%) and three different concentrations of Gd-HP-DO3A (0, 5 mM, and 10 mM), yielding nine combinations. Each determination included three adjacent slices in images from three animals. Compared to samples treated with PBS, CNRs from the samples treated with K2(Cr2O7) and Gd-HP-DO3A are significantly increased (P < 0.01). In samples treated with 3% K2(Cr2O7) plus 5-mM or 10-mM Gd-HP-DO3A compared with the samples with only the same concentration of Gd-HP-DO3A, significantly improved CNR was seen is some selected locations Increasing the concentration of K2(Cr2O7) to 6% decreases the CNR at either 5 mM or 10 mM Gd-HP-DO3A. Hence, the best result is with 3% K2(Cr2O7) and 5- or 10-mM Gd-HP-DO3A. Or, stratum oriens; Mol, molecular layer of the hippocampus; PAG, periaqueductal gray.
P < 0.01.
P ≥ 0.2
P > 0.5
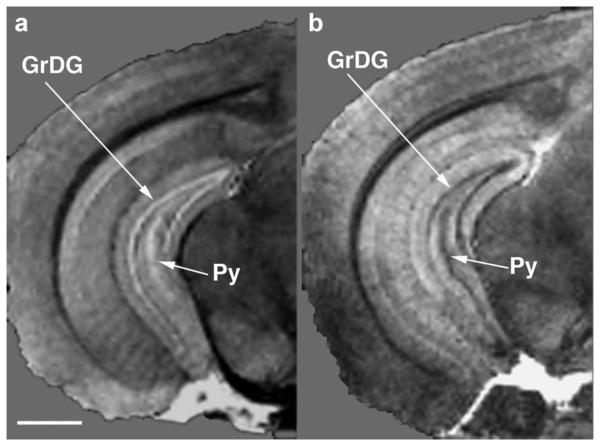
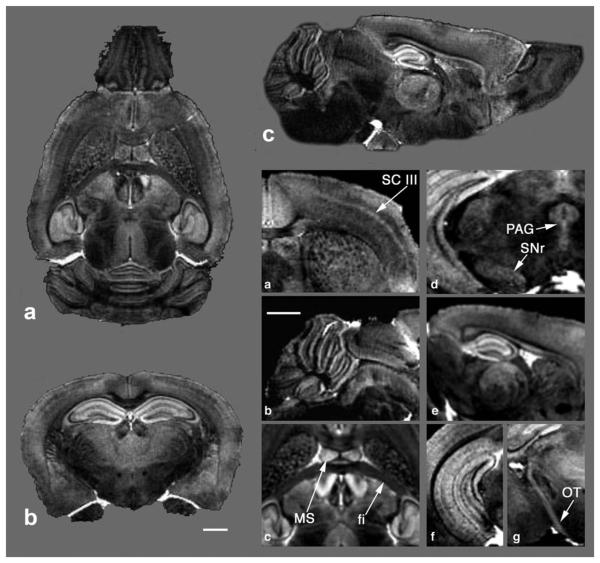
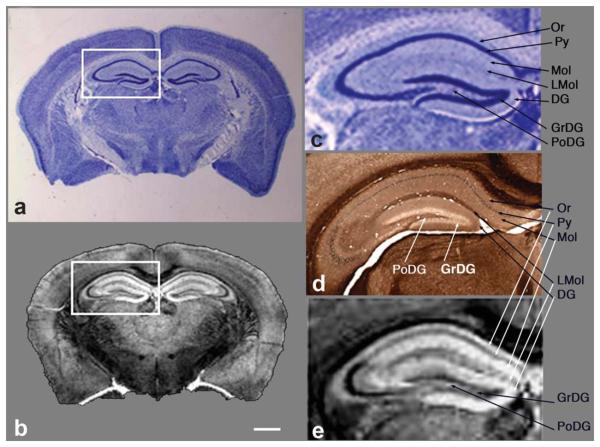
Within the hippocampus, in the Gd-HP-DO3A-only image (Fig. 2b and Fig. 3a) the pyramidal and granular cell layers exhibit hyperintensity, whereas in images with Gd-HP-DO3A plus K2(Cr2O7) they appear hypointense (Fig. 2d and Fig. 3b). Figure 4 shows detailed brain structures in selected sagittal, coronal, and transverse planes of the 10-mM Gd-HP-DO3A plus 3% K2(Cr2O7)-treated sample. Brain structures, such as the entire optic track from chiasm to superior colliculus and the basal ganglia, are easily identified. Note that the pyramidal neurons in layer III of the cerebral cortex appear as a clear bright band. An expanded view of the hippocampus of the MRM images shows excellent correspondence between the MRM images and histologic sections obtained from the same sample. In histologic sections, no individual variations or metal deposition/black deposits within neurons was seen, demonstrating a uniform impregnation of the brain parenchyma. In the hippocampus, CA1 is differentiated from CA2/CA3 and individual layers are as easily identified in the MRM images as in the low-magnification images of histologic specimens (Fig. 5).
FIG. 3.
3D FLASH MRM of subfields of the hippocampus from samples treated with (a) 10-mM Gd-HP-DO3A and (b) 10-mM Gd-HP-DO3A plus 3% plus 3% K2(Cr2O7). Note in the image with Gd-HP-DO3A only the stratum pyramidale and granular cell layer show bright bands (a), whereas in the image with Gd-HP-DO3A plus 3% K2(Cr2O7) they appear as distinct black bands (b). Voxel size is 503μm3 and the image has undergone bicubic interpolation during resizing for viewing. sp, pyramidal layer; sg, granular cell layer. Scale bar = 1mm.
FIG. 4.
Images from a 3D FLASH dataset of a mouse brain treated with the modified method. a-c: Selected coronal, axial, and sagittal slices. a-g: Magnified views of the MR microscopy data showing that different locations in the brain reveal a wealth of anatomic details, such as the basal ganglia, cortex layers, and neural tracts. SC III, somatosensory cortex layer III; PAG, periaqueductal gray; SNr, substantial nigra; OT, optic track; MS, medial septal nucleus; fi, fimbria. Scale bar = 1mm.
FIG. 5.
Comparison of traditional histology with MR Golgi method. a: Coronal section of a gelatin-embedded mouse brain stained with the thionine/Nissl procedure and (b) corresponding coronal slice from the 3D MR image after chromate plus Gd-HP-DO3A treatment at the level of the hippocampus (boxed region). An expanded view of the hippocampus comparing thionine/Nissl stain (c), peroxidase/diaminobenzidine stain (d), and MRM (e) shows the high level of detail in the MRM image, with excellent correspondence to histologic detail. Note the detailed layers of the hippocampus are easily identified (b,e). Or, stratum oriens; sp, stratum pyramidale; Mol, molecular layer; LMol, stratum lacunosum moleculare; DG, dentate gyrus; sg, granule cell layer; PoDG, polymorphic layer. MRI: 5-mM Gd-HP-DO3A plus 3% K2(Cr2O7). Scale bar = 1mm.
DISCUSSION
The brain parenchyma is densely packed, providing modest MR contrast between structures compared to standard histologic treatments. Increased information can be obtained if the specimen is imaged with the aid of MR contrast agents and/or specially designed acquisition schemes (10-13). Our new method, Golgi stain MR microscopy, augments the MR contrast based on impregnation with potassium dichromate and a gadolinium-based contrast agent that provides increased differentiation of many parts of the brain. The Golgi method stains a limited number of cells at random in their entirety, allowing neuroanatomists to track the arborization of stained neurons. Why the classic Golgi technique only stains a small proportion of neurons in a given preparation remains unknown, although it has been proposed that the functional or metabolic state of a cell at the moment of fixation determines whether or not it will be impregnated (17). Using sodium dichromate to study the metabolism of chromium species in biochemical reactions demonstrated the formation of Cr(III) in the kidney and liver of a mouse in vivo (18). Both lipids (6) and proteins (19) can react with dichromate to reduce hexavalent chromium to Cr(III). It has also been proposed that paramagnetic Cr(III) can bind to terminal carboxyl groups of protein side chains, cross-linking and thus forming positively charged Cr(III)-protein complexes (19).
In analogy with the Golgi histology method, we hypothesize that in Golgi stain MR microscopy when the brain sample is exposed to a solution of potassium dichromate and gadolinium, there is selective accumulation of Gd3+ and/or reduction in T1 and T2 relaxation times by gadolinium is selectively augmented in those brain tissues with Cr(III)-protein complexes. As shown in Figs. 2 and 3, the granular layer of dentate gyrus and pyramidal cell layer of the hippocampus appear as bright bands in the Gd-HP-DO3A-only-treated samples and dark bands in Gd-HP-DO3A plus 3% K2(Cr2O7)–treated samples. This can be explained by changes in T1 and/or T2* resulting from the dual-contrast agents, Gd-HP-DO3A and Cr(III). Supporting this hypothesis, T1 maps of the contrast agent–treated samples (Fig. 1b-d) show dark (low T1) and light (high T1) bands in the hippocampus that are most pronounced in the dual contrast agent–treated sample. Similarly, T2 maps have little contrast for phosphate-buffered saline, and Gd-HP-DO3A-only-treated samples with average T2 decrease a factor of 4 with the addition Gd-HP-DO3A. Chromate and chromate plus Gd-HP-DO3A samples show somewhat increased T2 only in heavily myelinated regions (e.g., external and internal capsules). These difference likely reflects variations in cell density and/or lipid composition in different cell types, with ensuing variations in Cr(III) and Gd-HP-DO3A content between regions, resulting chiefly in regional modulation of T1 relaxation. The absence of metal deposition in individual neurons by histology argues that our new modified Golgi impregnation is more uniform than the silver technique. The maximum in the FLASH image CNR at modest concentrations of K2(Cr2O7) is consistent with this hypothesis as too low a concentration of Cr(III) will result in poor tissue differentiation due to insufficient relaxation effects and too high a concentration of Cr(III) will result in significant overall loss in SNR, resulting in poor tissue differentiation.
Silver impregnation histologic techniques yield detailed visualization of neuronal arborizations and thus provide a particularly valuable complement to immunocytochemical techniques for recognition of axon injury and neurodegenerative diseases. Nevertheless, silver methods are complex and unpredictable and may introduce artifacts, such as a background “grainy” staining. Moreover, histologic analyses are essentially two dimensional, although there are time-consuming methodologies for 3D reconstruction of histologic slices (20,21). MRM is intrinsically 3D, albeit at significantly lower resolution than provided by histology. In our new Golgi stain MRM method, the pyramidal neurons in layer III of the cerebral cortex show a clear bright band (Fig. 4). It has been reported that the density of this layer is significantly reduced in schizophrenia and Alzheimer's disease (22). The Golgi stain MRM method suggests potential applications for studies of neural degeneration disease through its ability to highlight diverse anatomic regions at high contrast and spatial resolution because of the chemical affinity of K2(Cr2O7) for myelinated tissues. The inherent high CNR MR microscopic data obtained with this stain method could lead to improved MR identification and segmentation of brain cytoarchitecture, leading to more accurate, probabilistic-based MR atlases and to a supplement to silver impregnation histology methods.
CONCLUSION
We present a staining method for in vitro MRM that combines 19th- and 21st-century technology. With this new method, neuroanatomical contrast is dramatically improved compared to conventional fixation. Further optimization of fixatives, fixation time, and MR parameters may continue to improve this technique. Open questions remain about the underlying contrast mechanisms. Possibilities include preferential localization of Gd-HP-DO3A, a reduction of diamagnetic Cr(VI) to paramagnetic Cr(III), or both. This method will ultimately be a powerful tool to obtain detailed 3D whole-brain images for the study of brain pathology, such as neurodegeneration, dysmyelination, and structural abnormalities caused by genetic, inflammatory, or infectious processes.
ACKNOWLEDGMENTS
We are grateful for the technical assistance of Paulette Ferland, Bryan Kinney, and Neuroscience Associates for help with the histologic preparations. This project was funded in part by the Beckman Institute (R.E.J.), NIH NIGMS GM47368, NINDS NS046810 (E.L.B.), NIDA R01DA18184, and NCRR U24 RR021760 Mouse BIRN (R.E.J.).
REFERENCES
- 1.Golgi C. Sulla struttura della sostanza grigia del cervello. Vol. 33. Gazzetta Medica Italiana; Lombardia: 1873. pp. 244–246. [Google Scholar]
- 2.Pannese E. The Golgi stain: invention, diffusion and impact on neurosciences. In: Bentivoglio M, Vignolo A, editors. Journal of the history of the neurosciences. Vol. 8. Taylor and Francis; New York: 1999. pp. 132–140. [DOI] [PubMed] [Google Scholar]
- 3.Rosoklija G, Mancevski B, Ilievski B, Perera T, Lisanby SH, Coplan JD, Duma A, Serafimova T, Dwork AJ. Optimization of Golgi methods for impregnation of brain tissue from humans and monkeys. J Neurosci Methods. 2003;131:1–7. doi: 10.1016/j.jneumeth.2003.06.001. [DOI] [PubMed] [Google Scholar]
- 4.Angulo A, Fernandez E, Merchan JA, Molina M. A reliable method for Golgi staining of retina and brain slices. J Neurosci Methods. 1996;66:55–59. doi: 10.1016/0165-0270(95)00160-3. [DOI] [PubMed] [Google Scholar]
- 5.Runge VM, Foster MA, Clanton JA, Jones MM, Lukehart CM, Hutchison JMS, Mallard JR, Smith FW, Partain CL, James AE. Contrast enhancement of magnetic resonance images by chromium EDTA: an experimental study. Radiology. 1984;152:123–126. doi: 10.1148/radiology.152.1.6427845. [DOI] [PubMed] [Google Scholar]
- 6.Watanabe T, Tammer R, Boretius S, Frahm J, Michaelis T. Chromium(VI) as a novel MRI contrast agent for cerebral white matter: preliminary results in mouse brain in vivo. Magn Reson Med. 2006;56:1–6. doi: 10.1002/mrm.20930. [DOI] [PubMed] [Google Scholar]
- 7.Johnson GA, Benveniste H, Black RD, Hedlund LW, Maronpot RR, Smith BR. Histology by magnetic resonance microscopy. Magn Reson Q. 1993;9:1–30. [PubMed] [Google Scholar]
- 8.Delnomdedieu M, Hedlund LW, Johnson GA, Maronpot RR. Magnetic resonance microscopy: a new tool for the toxicologic pathologist. Toxicol Pathol. 1996;24:36–44. doi: 10.1177/019262339602400106. [DOI] [PubMed] [Google Scholar]
- 9.Lester DS, Johannessen JN, Pine PS, McGregor GN, Johnson GA. Virtual neuropathology: a new approach to preclinical pathology using magnetic resonance imaging microscopy. Spectroscopy. 1999;14:17. [Google Scholar]
- 10.Johnson GA, Cofer GP, Fubara B, Gewalt SL, Hedlund LW, Maronpot RR. Magnetic resonance histology for morphologic phenotyping. J Magn Reson Imaging. 2002;16:423–429. doi: 10.1002/jmri.10175. [DOI] [PubMed] [Google Scholar]
- 11.Zhang JY, Richards LJ, Yarowsky P, Huang H, van Zijl PCM, Mori S. Three-dimensional anatomical characterization of the developing mouse brain by diffusion tensor microimaging. Neuroimage. 2003;20:1639–1648. doi: 10.1016/s1053-8119(03)00410-5. [DOI] [PubMed] [Google Scholar]
- 12.Sharief AA, Johnson GA. Enhanced T2 contrast for MR histology of the mouse brain. Magn Reson Med. 2006;56:717–725. doi: 10.1002/mrm.21026. [DOI] [PubMed] [Google Scholar]
- 13.Tyszka JM, Readhead C, Bearer E, Pautler R, Jacobs RE. Statistical diffusion tensor histology reveals regional dysmyelination effects in the shiverer mouse mutant. Neuroimage. 2006;2006:1058–1065. doi: 10.1016/j.neuroimage.2005.08.037. [DOI] [PMC free article] [PubMed] [Google Scholar]
- 14.Abramoff MD, Magelhaes PJ, Ram SJ. Image processing with ImageJ. Biophotonics Int. 2004;11:36–42. [Google Scholar]
- 15.Ross JF, Switzer RC, Poston MR, Lawhorn GT. Distribution of bismuth in the brain after intraperitoneal dosing of bismuth subnitrate in mice: implications for routes of entry of xenobiotic metals into the brain. Brain Res. 1996;725:137–154. doi: 10.1016/0006-8993(96)00146-1. [DOI] [PubMed] [Google Scholar]
- 16.Fix AS, Ross JF, Stitzel SR, Switzer RC. Integrated evaluation of central nervous system lesions: stains for neurons, astrocytes, and microglia reveal the spatial and temporal features of MK-801 induced neuronal necrosis in the rat cerebral cortex. Toxicol Pathol. 1996;24:291–304. doi: 10.1177/019262339602400305. [DOI] [PubMed] [Google Scholar]
- 17.Pannese E. The black reaction. Brain Res Bull. 1996;41:343–349. doi: 10.1016/s0361-9230(96)00177-3. [DOI] [PubMed] [Google Scholar]
- 18.Ueno S, Susa N, Furukawa Y, Sugiyama M. Formation of paramagnetic chromium in liver of mice treated with dichromate (VI) Toxicol Appl Pharmacol. 1995;135:165–171. doi: 10.1006/taap.1995.1219. [DOI] [PubMed] [Google Scholar]
- 19.Angulo A, Merchan JA, Molina M. Golgi-Colonnier method: correlation of the degree of chromium reduction and pH change with quality of staining. J Histochem Cytochem. 1994;42:393–403. doi: 10.1177/42.3.7508472. [DOI] [PubMed] [Google Scholar]
- 20.Dauguet J, Delzescaux T, Condè F, Mangin J-F, Ayache N, Hantraye P, Frouin V. Three-dimensional reconstruction of stained histological slices and 3D non-linear registration with in-vivo MRI for whole baboon brain. J Neurosci Methods. 2007;164:191–204. doi: 10.1016/j.jneumeth.2007.04.017. [DOI] [PubMed] [Google Scholar]
- 21.Meyer CR, Moffat BA, Kuszpit KK, Bland PL, McKeever PE, Johnson TD, Chenevert TL, Rehemtulla A, Ross BD. A methodology for registration of a histological slide and in vivo MRI volume based on optimizing mutual information. Mol Imaging. 2006;5:16–23. [PMC free article] [PubMed] [Google Scholar]
- 22.Garey LJ, Ong WY, Patel TS, Kanani M, Davis A, Mortimer AM, Barnes TR, Hirsch SR. Reduced dendritic spine density on cerebral cortical pyramidal neurons in schizophrenia. J Neurosurg Psychiatry. 1998;65:446–453. doi: 10.1136/jnnp.65.4.446. [DOI] [PMC free article] [PubMed] [Google Scholar]


