Abstract
Arsenic (As) is considered to be the environmental contaminant of greatest concern due to its potential accumulation in the food chain and in humans. Using novel synchrotron-based x-ray fluorescence techniques (including sequential computed tomography), short-term solution culture studies were used to examine the spatial distribution of As in hydrated and fresh roots of cowpea (Vigna unguiculata ‘Red Caloona’) seedlings exposed to 4 or 20 µm arsenate [As(V)] or 4 or 20 µm arsenite. For plants exposed to As(V), the highest concentrations were observed internally at the root apex (meristem), with As also accumulating in the root border cells and at the endodermis. When exposed to arsenite, the endodermis was again a site of accumulation, although no As was observed in border cells. For As(V), subsequent transfer of seedlings to an As-free solution resulted in a decrease in tissue As concentrations, but growth did not improve. These data suggest that, under our experimental conditions, the accumulation of As causes permanent damage to the meristem. In addition, we suggest that root border cells possibly contribute to the plant’s ability to tolerate excess As(V) by accumulating high levels of As and limiting its movement into the root.
Arsenic (As) is one of the most toxic elements within the environment. Indeed, based upon its frequency, toxicity, and potential for human exposure, As is ranked as the highest priority substance by the U.S. Agency for Toxic Substances and Disease Registry (ATSDR, 2011). Elevated levels of As in the environment result from both natural sources (such as volcanoes) and anthropogenic sources (such as the use of pesticides, mining activity, or waste disposal). The predominant form of As in well-aerated soils is arsenate [As(V); which is an analog of phosphate; Asher and Reay, 1979], while arsenite [As(III)] typically dominates in anaerobic environments (such as rice paddies).
Groundwaters of many areas around the world contain elevated levels of As, particularly on the Indian subcontinent. This As-contaminated groundwater is of concern due to both direct ingestion and the irrigation of soils for crop production. Concentrations of up to 10 µm (and slightly higher) have been reported in drinking water in Bangladesh (Frisbie et al., 2002; Ahsan et al., 2009; Neumann et al., 2010), while the average concentration of water used for irrigation in Jessore (Bangladesh) was 3 µm (FAO, 2006). Indeed, it is estimated that 0.9 to 1.36 Gg of As is brought onto arable land each year via groundwater extraction for irrigation (Ali, 2003).
Edible portions of plants generally do not accumulate As to levels that are hazardous to animals because plant growth is severely restricted even at low concentrations (Carbonell-Barrachina et al., 1997; Smith et al., 1998; McLaren et al., 2006). However, it has been reported that rice (Oryza sativa) may pose a potential health risk to populations with high rice consumption (for review, see Zhao et al., 2010; Carey et al., 2012). Furthermore, root tissues (including tubers of potato [Solanum tuberosum]) may exceed food safety limits and hence pose a potential risk (Smith et al., 1998; Das et al., 2004). Certainly, there is a need to study the movement of As in plant tissues, including its uptake by roots and subsequent movement through the plant.
Several authors have examined the distribution of As within fronds of the hyperaccumulator Pteris vittata and found that the majority of As accumulates in the pinnae (Lombi et al., 2002; Hokura et al., 2006; Pickering et al., 2006). However, with the exception of As distribution in rice grains (Meharg et al., 2008; Lombi et al., 2009; Carey et al., 2011), there is surprisingly little information available regarding the cellular or subcellular distribution of As in other plant tissues, especially in nonhyperaccumulators (including agronomic species; Zhao et al., 2009). A limited number of studies have investigated As distribution in roots. For instance, Moore et al. (2011) used nano-secondary ion mass spectrometry to investigate As distribution with subcellular resolution in cryo-substituted roots of rice. Hansel et al. (2001) examined freeze-dried roots of Phalaris arundinacea (an aquatic species). Using tomography, these authors reported that the majority of As was sorbed to iron plaques on the exterior root surface (Blute et al., 2004; Seyfferth et al., 2010).
Recent advances in synchrotron-based techniques now allow the in situ examination of metals and metalloids in hydrated and fresh plant tissues with no observable damage (Lombi et al., 2011a). Of particular interest is the prototype Maia detector system jointly developed by the Commonwealth Scientific and Industrial Research Organization (Australia) and the Brookhaven National Laboratory (United States), which represents a new-generation x-ray fluorescence (XRF) detector that provides unprecedented capabilities in this regard (Lombi et al., 2011b). The Maia uses an annular array of 384 silicon-diode detectors positioned in a backscatter geometry to subtend a large solid angle (approximately 1.3 steradian) and to achieve high count-rate capacity (Kirkham et al., 2010). The detector is sensitive to photons with an energy greater than 3.3 keV (i.e. K-lines of elements heavier than calcium or L-lines of elements heavier than antimony). This system has been used recently to conduct single-slice tomography in hydrated roots (Kopittke et al., 2011; Lombi et al., 2011a), but three-dimensional (essentially sequential two-dimensional) tomography was not possible due to radiation damage under the experimental conditions utilized (Lombi et al., 2011a). Currently, the spatial resolution of the detector is limited to approximately 2 µm; hence, it cannot be used for the examination of subcellular distribution.
The aim of this study was to examine As in roots of cowpea (Vigna unguiculata; a model plant for the study of trace metal toxicities and an important species in tropical agricultural systems such as the Indian subcontinent) using new techniques for assessing the distribution of metals and metalloids within hydrated fresh plant tissues. Specifically, using the Maia detector system, hydrated and fresh roots were analyzed using x-ray fluorescence microscopy (µ-XRF) to obtain both two-dimensional images and sequential computed tomograms along the root axis (thereby allowing partial reconstruction of a root in three dimensions). Consideration was also given to the ability of root growth to improve following subsequent transfer to As-free solutions, providing information on the nature of As-induced damage within roots. This study focuses on As(V), although data are also presented for As(III).
RESULTS
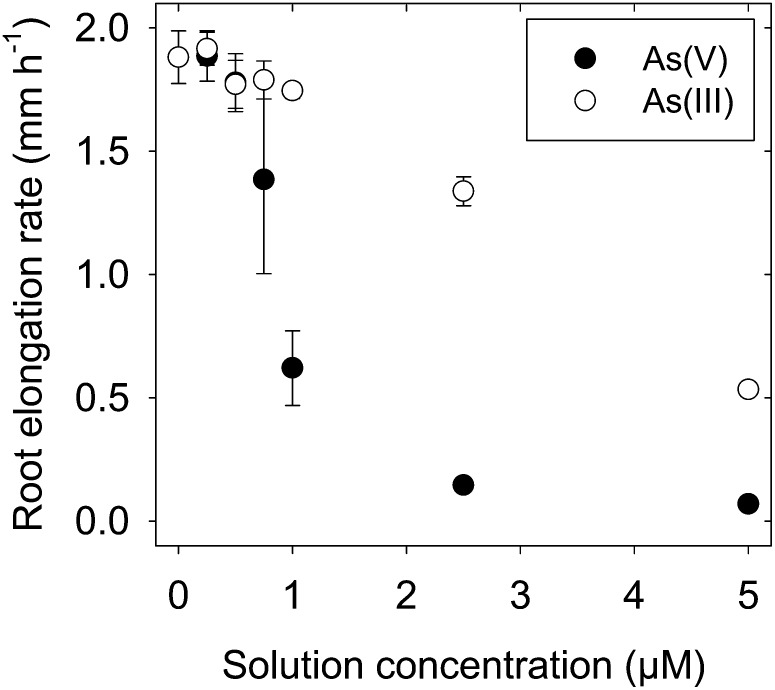
As expected, root elongation rates decreased as the solution concentrations of As(V) and As(III) increased (Fig. 1). However, As(III) was slightly less toxic to the elongation of cowpea roots than was As(V), with the effective concentration resulting in a 50% reduction being 3.6 µm for As(III) but 0.9 µm for As(V). These values are similar to those reported previously in other species. For example, Wang et al. (2011) reported a 50% reduction in root growth at approximately 1.5 to 2.0 µm in roots of wheat (Triticum aestivum). In roots of rice, As(V) and As(III) were found to be similar in their toxicity, with both causing a 50% reduction in growth at approximately 20 µm (Abedin and Meharg, 2002).
Figure 1.
Dose-response curves for the elongation of cowpea roots exposed to either As(V) or As(III) for 24 h. The vertical bars represent sd of the arithmetic mean of three replicates.
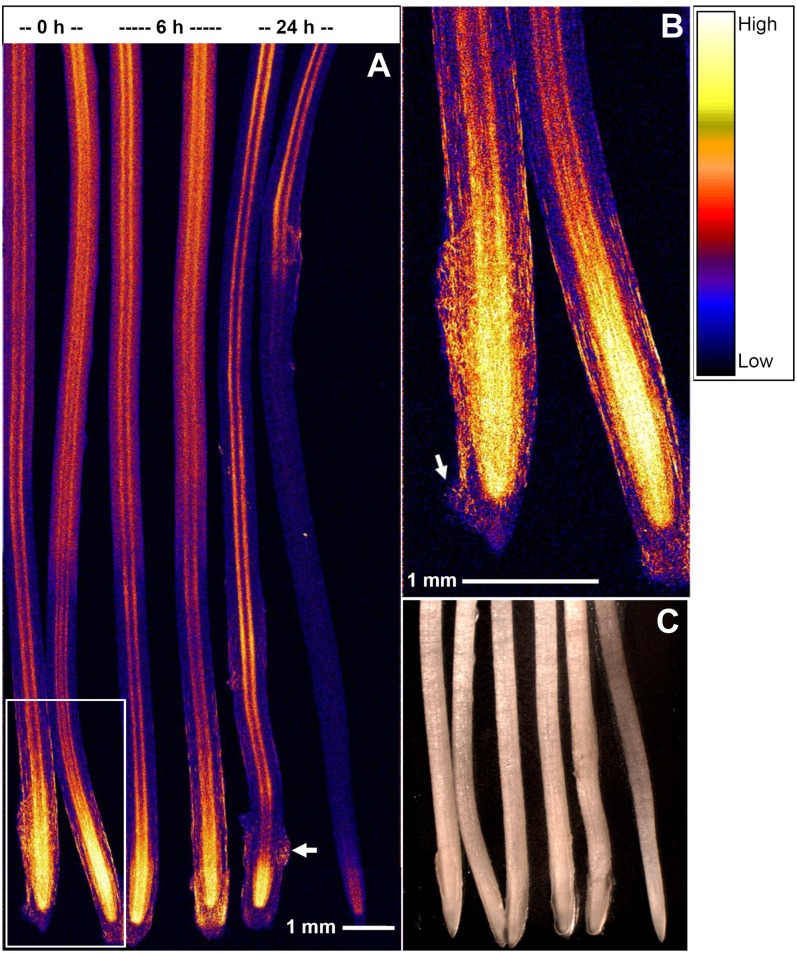
For roots exposed to 4 µm As(V), µ-XRF analyses indicated that the highest concentrations of As were observed within the internal (meristematic) tissues of the apex (Fig. 2). It was also noted that As did not bind strongly to the mucigel surrounding the root tip, although there were areas of high accumulation throughout the mucigel (later found to correspond to border cells [see below]; Figs. 2 and 3). From approximately 2 to 3 mm behind the apex, As could be seen to accumulate at an internal “barrier,” presumably the endodermis, where As concentrations were slightly higher than in the surrounding cortical tissues and stele (Figs. 2 and 3).
Figure 2.
A, Roots of cowpea grown in 4 µm As(V) for 24 h and then transferred to an As-free solution for (left to right) 0 h (i.e. not transferred), 6 h, or 24 h (each treatment has two replicate roots) and examined using µ-XRF. The arrows indicate two examples of As accumulation (border cells; see Fig. 5) in a matrix where there is low accumulation (mucigel; see Fig. 5). Brighter colors correspond to higher As concentrations (see color scale at right). B, Closeup of the boxed area in A. C, Light micrograph after analysis by µ-XRF. The full length of roots analyzed by XRF is not shown in the light micrograph.
Figure 3.
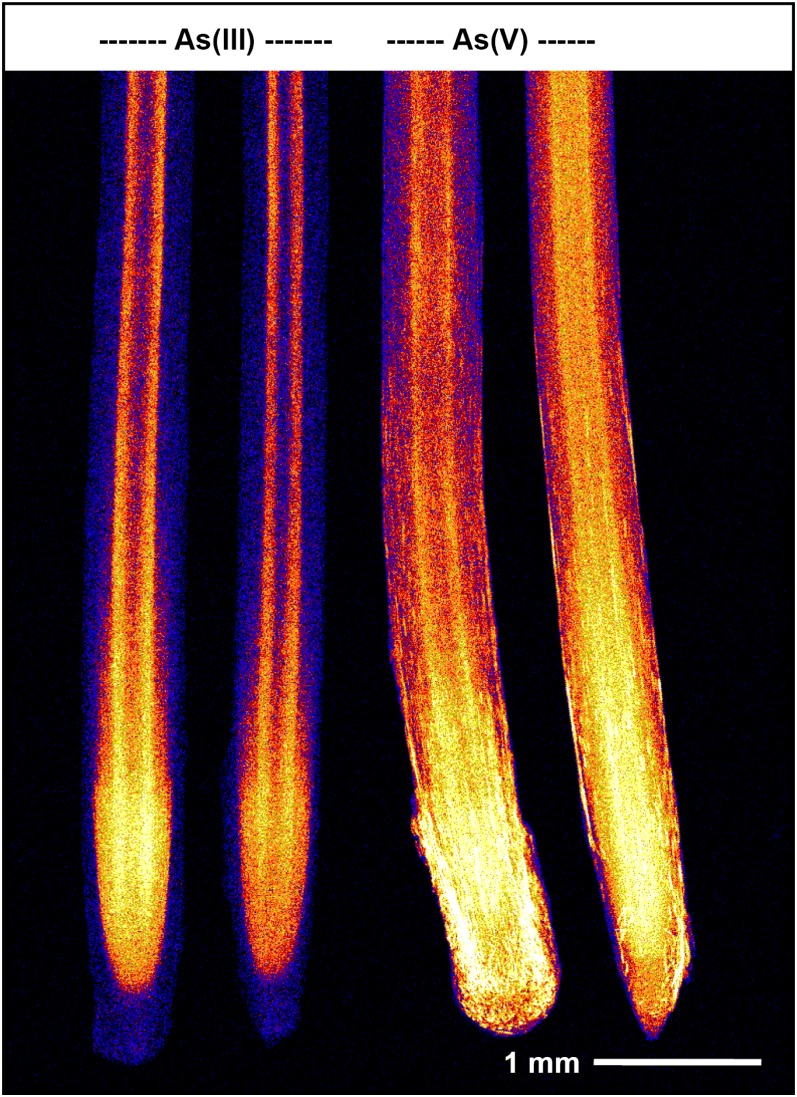
Roots of cowpea grown in 4 µm As(III) or 4 µm As(V) for 24 h and examined using µ-XRF. Brighter colors correspond to higher As concentrations (see color scale in Fig. 2). There are two replicate roots for each treatment. Note that the root cap and mucigel are difficult to see in roots exposed to As(III) due to the low As concentrations within these tissues.
In roots exposed to 4 µm As(III), the highest concentrations were again observed at the root apices near the meristematic tissues (Fig. 3). It was noted that the accumulation of As within both the root cap and border cells was comparatively low [in contrast to observations regarding As(V)]. Finally, it was noted that accumulation at the internal barrier (endodermis) was much more distinct than observed for roots exposed to As(V) (Fig. 3).
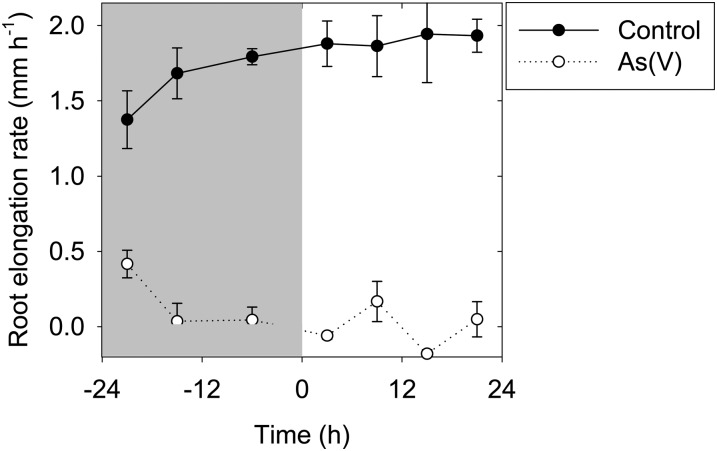
Changes in As distribution within root tissues were also examined [for roots exposed to As(V)] following subsequent transfer to As-free solutions for a further 6 or 24 h. Interestingly, although roots did not regrow following transfer (Fig. 4), the apical concentrations of As did decrease markedly. This decrease in the apical tissue concentrations observed by µ-XRF (Fig. 2) corresponded to a 25% decrease (1.4 nmol plant−1; Table I) in bulk tissue concentrations and resulted both from continued translocation to the shoot tissues (0.32 nmol plant−1) and the movement of As from the root tissue back into the bulk solution (1.2 nmol plant−1; Table I).
Figure 4.
Changes in elongation rates of cowpea roots exposed to 4 µm As(V) (gray shading; −24 to 0 h) and during 24 h of growth in As-free solutions (0–24 h). The average root elongation rate is plotted against the midpoint of each measurement interval. Each point is the arithmetic mean of three replicates (each with seven seedlings). The vertical bars represent sd.
Table I. Tissue concentrations (fresh mass basis) and contents of As in cowpea seedlings exposed to 4 µm As(V) for 24 h and then transferred to As-free solutions for a further 0, 6, or 24 h.
The values in parentheses represent sd. N/A, Not applicable.
| Recovery Time | Sample | As | As |
|---|---|---|---|
| h | µg g−1 | nmol plant−1 | |
| 0 | Roots | 10.5 (1.62) | 5.66 (0.79) |
| 6 | Roots | 10.0 (0.78) | 6.13 (0.78) |
| 24 | Roots | 8.58 (1.29) | 4.24 (0.13) |
| 0 | Shoots | 0.31 (0.09) | 0.73 (0.28) |
| 6 | Shoots | 0.31 (0.00) | 0.79 (0.10) |
| 24 | Shoots | 0.42 (0.06) | 1.05 (0.08) |
| 0 | Solution | N/A | 0a (0) |
| 6 | Solution | N/A | 0 (0) |
| 24 | Solution | N/A | 1.2 (0) |
Below the detection limit of 13 nm As, equivalent to 1.2 nmol plant−1.
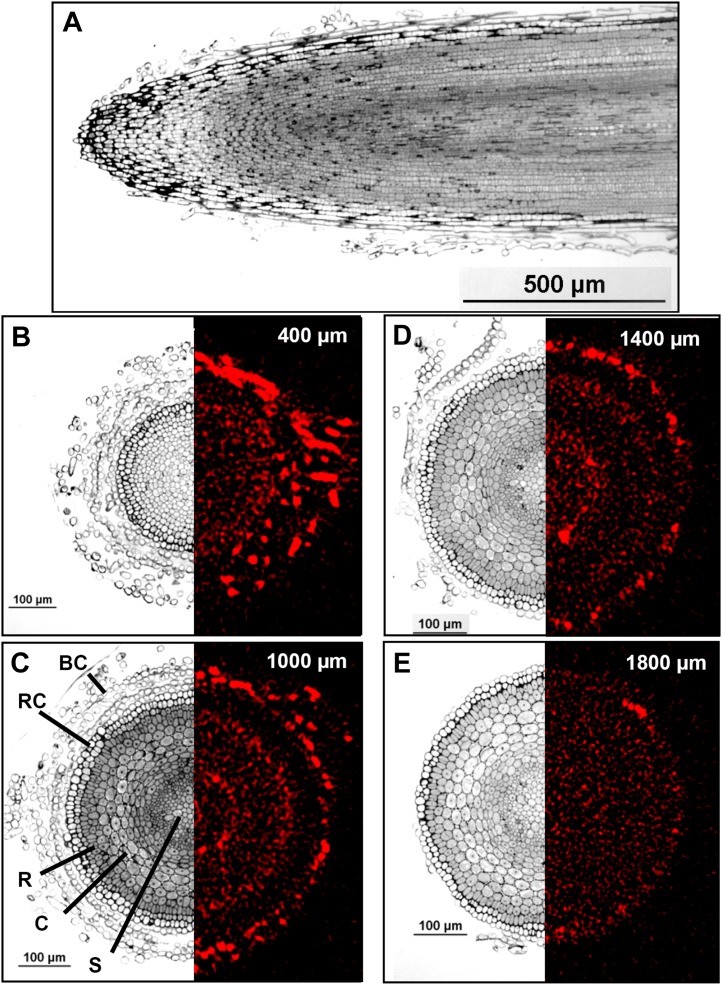
To examine the distribution of tissue As in further detail, sequential tomography was used to develop a virtual three-dimensional reconstruction of As within a hydrated and fresh (intact) root (Figs. 5 and 6; Supplemental Videos S1 and S2). It is important to note that because the roots were grown in nutrient solution (rather than soil), even at 2 mm from the apex, the rhizodermis was covered by one or two layers of attached root cap cells that had not sloughed off (Fig. 5). In addition, many border cells (i.e. cells of the root cap that have undergone cellular separation but are still attached to the root via a soluble polysaccharide matrix; Driouich et al., 2007) could be observed 1 to 2 mm from the apex (Fig. 5). Thus, when interpreting the µ-XRF tomograms, care must be taken because the rhizodermis is not the outer layer of the root in these images.
Figure 5.
Cross-sections of roots exposed to 20 µm As(V) for 24 h. A, Longitudinal cross-section (approximately 1 µm thick) stained using toluidine blue and examined using light microscopy. B to E, Transverse cross-sections (left) and tomograms (virtual cross-sections; right). The transverse cross-sections (approximately 1 µm thick) were examined using light microscopy, and the tomograms were collected using µ-XRF in fresh hydrated roots. In the tomograms, red represents As distribution. The light micrographs were not collected from the same roots that were used for tomography, although all roots were grown in As(V) for 24 h. In C, major tissues are labeled to assist in interpretation: BC, border cells; C, cortex; R, rhizodermis; RC, root cap cells (not sloughed off); S, stele.
Figure 6.
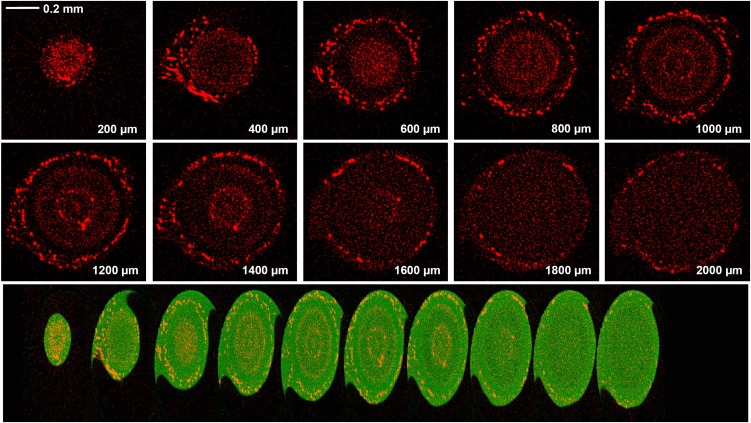
Tomograms (virtual cross-sections) taken in the apex of a root exposed to 20 µm As(V) for 24 h. The tomograms were collected 200 to 2,000 µm from the apex in intervals of 200 µm. The scale bar in the first panel (0.2 mm) does not apply to the bottom panel. In the top series of images, red represents As distribution, while in the compilation of images, green represents Compton (mass) and red represents As. The bottom compilation of tomograms is a single frame captured from a reconstructed three-dimensional animation of the plant root (see Supplemental Videos S1 and S2) and indicates more clearly the relative locations of the structures.
Close to the apex (200–400 µm), the highest concentrations of As were observed in border cells, with substantially lower concentrations within the cells of the root cap (Figs. 5 and 6). At a distance of approximately 1,000 to 1,400 µm from the apex, there was a distinct accumulation at the endodermis, with lower concentrations in the stele, cortex, and rhizodermis. Interestingly, it was again noted that in this region (1,000–1,400 µm from the apex), there were high concentrations of As in the border cells while concentrations in the adjacent root cap cells (which had not sloughed off and were still attached to the rhizodermis) were lower than in both surrounding tissues (i.e. the rhizodermis and border cells; Figs. 5 and 6). Finally, at a distance of 1,800 to 2,000 µm from the apex, most border cells had sloughed off. In one of the two replicates for As(V), the concentrations of As at a distance of 1,800 to 2,000 µm appeared to be relatively uniform throughout the entire root cylinder, with no apparent accumulation at the endodermis (Figs. 5 and 6). However, in the other replicate (data not shown), As accumulated at the endodermis, as had been expected from examination of the two-dimensional scan (where As can be seen to accumulate at the endodermis along most of the approximately 20-mm root axis examined; Fig. 2).
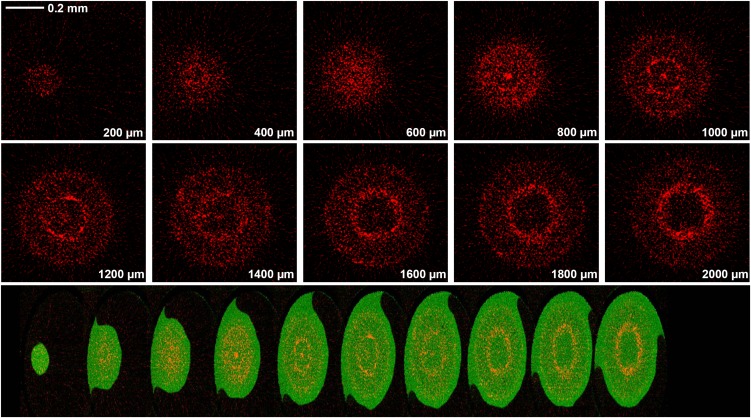
Computed tomography was also used to examine root tissues exposed to As(III). When exposed to As(III), the As was observed to accumulate at the endodermis (more than 1,000 µm from the root apex; Fig. 7), although this endodermal accumulation appeared to be more pronounced than had been observed for As(V) (Fig. 6). However, in contrast to As(V), there was no noticeable accumulation in border cells at any of the distances examined (Fig. 7; Supplemental Videos S3 and S4).
Figure 7.
Tomograms (virtual cross-sections) taken in the apex of a root exposed to 20 µm As(III) for 24 h. The tomograms were collected 200 to 2,000 µm from the apex in intervals of 200 µm, as indicated in the bottom-right of each panel. The scale bar in the first panel (0.2 mm) does not apply to the bottom panel. In the top series of images, red represents As distribution, while in the compilation of images, green represents Compton (mass) and red represents As. The bottom compilation of tomograms is a single frame captured from a reconstructed three-dimensional animation of the plant root (see Supplemental Videos S3 and S4).
Importantly, the distribution of As evident from examination of the tomograms was consistent with that observed from the two-dimensional scans (compare Fig. 3 with Figs. 6 and 7). In addition, the two-dimensional scans collected upon completion of the sequential tomography revealed that there was generally no observable damage to the root. In some instances, however, there did appear to be some slight damage, observable as horizontal lines (corresponding to the locations of the tomographic scans [Fig. 8]; Lombi et al., 2011a).
Figure 8.
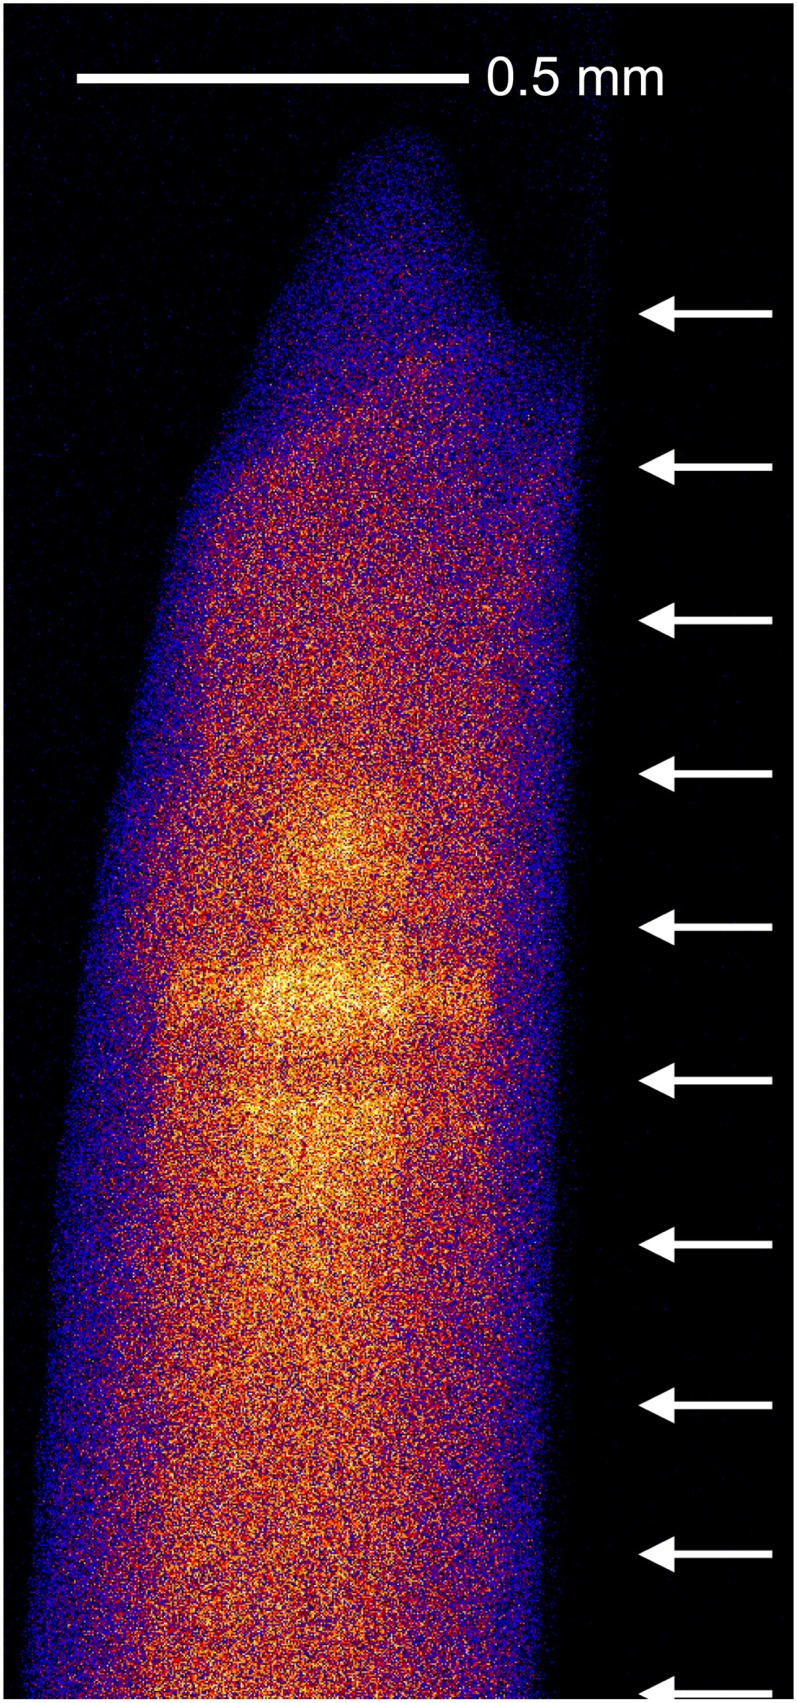
Two-dimensional scan of a root (in a capillary) exposed to 20 µm As(V) examined following the tomographic analysis in Figure 6. The arrows indicate the approximate locations where the 10 tomograms were collected in 200-µm intervals. While there is some evidence of damage, this is not evident from the tomograms, and it is considered that this redistribution occurred after collection of the tomograms.
DISCUSSION
Surprisingly, there is comparatively little literature examining the distribution of As in plant roots, particularly in nonhyperaccumulating species. In this study, we have provided spatially resolved data regarding the distribution of As in hydrated and fresh root tissues. For plants exposed to As(V), the highest concentrations of As were observed at the root apex (including the meristem), with As also observed to accumulate in border cells and (to a lesser extent) at the endodermis (Figs. 3, 5, and 6). Under our experimental conditions, this As appeared to cause permanent damage to the meristem, and even though transfer to As-free solutions caused a decrease in apical tissue concentrations (Fig. 2), root growth did not improve (Fig. 4). When exposed to As(III), the As accumulated at the endodermis [and this accumulation appeared to be more pronounced than for As(V)], although the As did not accumulate in the border cells of these As(III)-treated roots (Figs. 3 and 7).
These results suggest a potential role for border cells in As accumulation when exposed to As(V) (Figs. 3, 5, and 6). Interestingly, root border cells have been suggested to be involved in tolerance to aluminum (Al), with the physical removal of border cells from the root increasing the toxic effects of Al (Cai et al., 2011). For Al, it is thought that the border cells protect roots by increasing the production of mucigel (which binds Al strongly and reduces entry into the root). However, in this study, this same mechanism would not apply, as As is not bound strongly by the mucigel (Fig. 2). Rather, the As accumulated to high concentrations within the border cells (Figs. 2, 5, and 6). Interestingly, the accumulation of As in the border cells was substantially higher than in the adjacent root cap cells (Figs. 5, B and C, and 6), even though border cells are actually cells of the outer root cap that have undergone cellular detachment (Driouich et al., 2007). Therefore, we propose that it is possible that this accumulation of As within the border cells represents a mechanism that increases the root’s resistance to toxic levels of As(V) by accumulating As and limiting its movement into the main root system. Further experiments are required to investigate this hypothesis.
The reason why As(III) did not accumulate within border cells, as observed for As(V), is unknown (Fig. 3; compare Figs. 6 and 7), although it is important to note that the mechanisms of uptake and toxicity are different for As(III) than for As(V). The phytotoxicity of As(III) (which appears to be taken up via aquaporin channels; Meharg and Jardine, 2003; Ma et al., 2008) results from its reaction with dithiol groups on proteins and the inhibition of enzyme reactions requiring free sulfhydryl groups (Horswell and Speir, 2006). In contrast, As(V) competes with phosphate and is taken up via phosphate transporters (Asher and Reay, 1979; Zhao et al., 2009), and it is an uncoupler of oxidative phosphorylation (Horswell and Speir, 2006).
As has a low root-to-shoot mobility, and often less than 10% to 15% of the total tissue As is present in the shoots across a range of species (Zhao et al., 2009). In this study for cowpea seedlings exposed to 4 µm As(V) for 24 h, roots contained 89% of the total tissue As (5.66 nmol plant−1) while shoots contained 11% (0.73 nmol plant−1; Table I). Zhao et al. (2009) suggested that this limited translocation from root to shoot may occur due to the reduction of As(V) to As(III) within the root followed by complexation with thiols and sequestration in the root vacuoles. In our study, the µ-XRF analyses showed that for both As(V) and As(III), the As accumulates at the endodermis (Figs. 2–7). Although the subcellular distribution of As was not examined in this study, the data suggest a role of the endodermis (and border cells) in limiting this movement of As from the roots to the shoots. These observations are somewhat similar to those reported for rice roots examined using nano-secondary ion mass spectrometry (Moore et al., 2011), in which the highest concentrations of As were in the endodermis, pericycle, and xylem parenchyma cells, with little accumulation in the cortex and rhizodermis. For rice, the accumulation of As may also occur at the exodermis (the outermost layer of the cortex), which serves as an apoplastic barrier (Hose et al., 2001; Zhao et al., 2009, 2010). In soil-grown plants, As may also accumulate in iron plaques. For instance, examining freeze-dried roots of willow (Salix caprea × Salix viminalis), the highest concentration of As was in the plaque (Zimmer et al., 2011). Similarly, in paddy-grown rice, substantial quantities of As were observed to be adsorbed to the iron plaque coating on the rhizodermis (Smith et al., 2009; Seyfferth et al., 2010).
Although the apical concentrations of roots exposed to 4 µm As(V) decreased markedly upon transfer to As-free solutions (Fig. 2), the roots did not regrow (Fig. 4). This suggests that the damage caused by As to the apical meristem (under the conditions of our study) is not reversible even if tissue concentrations in the apex (and meristem) decrease. This is in contrast to the observed toxicities of some metals, such as Al, from which root growth may recover (Blamey et al., 2011). It was noted that one of the two As-treated roots grown for 24 h in recovery treatment had a somewhat abrupt change in tissue concentrations approximately 12 mm from the apex (Fig. 2). Given that no roots in this treatment regrew, this change in tissue concentration most likely corresponds to the translocation of As from the root tissue to the shoot (see below). Indeed, root tissue contents decreased by 25% (1.42 nmol plant−1; Table I) following transfer to As-free solutions. This decrease in root concentrations resulted both from continued translocation to the shoot tissues (0.32 nmol plant−1) and the movement of As from the root tissues back into the nutrient solution (1.2 nmol plant−1; Table I). The efflux of As into nutrient solution has been observed for a range of species, including wheat, barley (Hordeum vulgare), and maize (Zea mays; Zhao et al., 2009). However, the rate of As efflux in our study was low compared with other species, and accurate analysis was hindered in this experimental system by the detection limit of the inductively coupled plasma mass spectrometry (Table I). For example, Zhao et al. (2009) found that the rate of As efflux within 24 h of exposure was three times higher than the amount of As accumulated within the plant tissues.
The speciation of As within plant tissues was not considered in this study, but this requires further investigation. Certainly, once taken up by the plant root and moved through the various tissues, the speciation of As is known to change. For example, in both brown mustard (Brassica juncea; Pickering et al., 2000) and radish (Raphanus sativus; Smith et al., 2005), As was found to be translocated as either As(V) or As(III), but once in the shoot, it is reduced to As(III) before being complexed by thiolate. It is also important to note that our experiments were conducted in simple nutrient solutions in the absence of phosphate. It is known that As(V) is an analog of phosphate and that the addition of phosphate reduces the uptake and toxicity of As(V) (Asher and Reay, 1979). However, the concentration of phosphorus in soil solutions is typically very low; in solutions of unfertilized soils, the phosphorus concentration is typically less than 2 µm (Gillman and Bell, 1978; Menzies and Bell, 1988), and it is generally less than 10 µm even in fertilized soils (Reisenauer, 1966; Kovar and Barber, 1988). Regardless, the presence of phosphate would influence the results obtained. Finally, because the techniques utilized here examine distribution using whole plant tissues (rather than in processed transverse sections, for example), it was not possible to definitively ascertain the precise tissues where the As was accumulating within the root cylinder. For example, although the data indicate that As accumulates at the endodermis (Fig. 5), these analyses were not conducted on transverse sections, which would allow precise examination and characterization of this tissue.
CONCLUSION
The use of synchrotron-based techniques (including sequential computed tomography) allowed an examination of the distribution of As in hydrated, fresh plant roots, these being new and novel techniques. These analyses demonstrated that for cowpea seedlings exposed to As(V), the highest concentrations were observed internally at the root apex (meristem). In addition, As accumulated in the root border cells and at the endodermis. When exposed to As(III), the endodermis was again a site of accumulation, although no As was observed in border cells for these As(III)-treated roots. For As(V), subsequent transfer of seedlings to an As-free solution resulted in a decrease in tissue As concentrations, but growth did not improve. These data suggest that, under our experimental conditions, the accumulation of As in the meristem causes permanent damage to the meristem. Finally, we suggest that root border cells possibly contribute to the plant’s ability to tolerate excess As(V) by accumulating high levels of As and limiting its movement into the root.
MATERIALS AND METHODS
µ-XRF
For examination using µ-XRF, seeds of cowpea (Vigna unguiculata ‘Red Caloona’) were germinated for 2 d in a rolled paper towel suspended vertically in tap water. During this 2-d period, the seedlings were transported to a laboratory at the Australian Synchrotron in Melbourne. A water bath was prepared and was heated to 25°C using a domestic aquarium heater and 600-mL beakers placed in the water bath. Seedlings were removed from the paper towel and placed in Perspex strips (seven seedlings per strip) on the 600-mL beakers containing a 650-mL basal solution of 1 mm CaCl2 and 5 µm H3BO3. All solutions were initially at pH 5.6 and were continuously aerated.
Plants were grown in this basal solution (calcium and boron) for more than 6 h before further growth in 4 or 20 µm As(V) or 4 or 20 µm As(III). In the first experiment (two-dimensional imaging), seedlings were grown in 4 µm As(V) for 24 h and then transferred to an As-free solution (i.e. only calcium and boron) for a further 0 (i.e. no transfer), 6, or 24 h in order to examine the ability of roots to recover from As intoxication. These timings were staggered so that all treatments finished in the As-free solution simultaneously. In the second experiment (computed tomography), the seedlings were grown for 24 h in either 20 µm As(V) or 20 µm As(III) before examination. For this tomography experiment, higher solution concentrations of As were used to be sensitive to the detailed distribution of As in the root tissues. Finally, in the third experiment (two-dimensional imaging), the seedlings were grown for 24 h in either 4 µm As(V) or 4 µm As(III) before examination by µ-XRF.
Roots were analyzed at the x-ray fluorescence microscopy (XFM) beamline at the Australian Synchrotron. At this beamline, an in-vacuum undulator is used to produce a brilliant x-ray beam. A silicon-111 monochromator and Kirkpatrick-Baez mirrors are used to deliver a monochromatic focused beam of around 2 × 2 µm2 onto the specimen (Paterson et al., 2011). XRF emitted by the specimen was collected using the 384-element Maia detector placed in a backscatter geometry (Kirkham et al., 2010). The XRF event stream was analyzed using GeoPIXE (Ryan and Jamieson, 1993; Ryan, 2000).
For the first experiment [two-dimensional imaging; 4 µm As(V)], two replicate roots per treatment were harvested. The apical 30 mm of the roots was cut off and placed side by side between two pieces of 4-µm-thick Ultralene film, forming a tight seal around the roots that limited dehydration. Within the sample holder, roots were positioned vertically so that the tips were the first part of the root scanned and the tips of all treatments were scanned simultaneously. For elemental mapping, samples were analyzed continuously in the horizontal direction (“on the fly”). The sampling interval was 7 µm, with a step size of 7 µm in the vertical direction and the transit time per 7-µm pixel being 6.8 ms (1.02 mm s−1). Thus, the total scan time was 7 h, with the length of root examined being approximately 18 mm. For the third experiment [two-dimensional imaging; 4 µm As(V) or 4 µm As(III), with two replicate roots per treatment], the same procedure was used as for the first experiment except that the roots were only scanned 6 mm from their apices.
For computed tomography [second experiment; 20 µm As(V) or 20 µm As(III)], root samples were harvested, rinsed with deionized water, and inserted into a capillary (polyimide; internal diameter of 810 µm, wall thickness of 25 µm; Cole-Parmer 95820-06). To limit dehydration, water was also inserted into the capillary before being sealed with wax in order to create a moist chamber (for more information regarding tomography, see Lombi et al. [2011a]). The capillary was immediately attached to a pin mounted onto a small pair of stages that were used to bring the root to the rotation center. Rotation was achieved using a 200-step-per-revolution stepper motor in full-step mode. Tomograms were collected within the apical 2.0 mm of the root by collecting two-dimensional µ-XRF transects over 200 angles spaced over 360°. A full rotation is used because it allows the investigation of sample damage and self-absorption (if significant). In the horizontal direction (i.e. for each of the 200 angles of the tomographic scan), the sampling interval was 2 µm with a transit time of 2.6 ms (0.768 mm s−1). For all roots, these scans were collected sequentially in 200-µm intervals along the root, starting at 200 µm behind the apex and finishing 2,000 µm behind the apex, thereby giving a total of 10 scans along the root axis. Following tomography, the roots were examined within the capillary using a two-dimensional scan to check for damage. Samples were analyzed continuously in the horizontal direction (on the fly), with a sampling interval of 2 µm, a step size of 2 µm in the vertical direction, and the transit time per 2-µm pixel being 2.6 ms (0.768 mm s−1). Thus, the time for this two-dimensional scan for each root was approximately 30 min, with the length of roots examined being approximately 2.2 mm (thereby encompassing all of the tomographic analyses). For both treatments, two replicate roots were examined by tomography, although only images from one root are presented here.
For tomography, the projections were aligned using the Compton scattering signal produced by the capillary. Reconstructions were performed using an implementation of the GridRec algorithm (http://cars9.uchicago.edu/software/idl/tomography.html) interfaced with the Interactive Data Language programming interface (http://www.exelisvis.com/). Each series of reconstructed images was then imported into an image stack within ImageJ (http://rsbweb.nih.gov/ij/) to form a virtual three-dimensional reconstruction of a root.
Plant Growth and Root Elongation Rates
These experiments were conducted in a laboratory at the University of Queensland in St Lucia maintained at 25°C. Seeds were germinated in a rolled paper towel for 2 d and then placed in Perspex strips on 650 mL of 1 mm CaCl2 and 5 µm H3BO3.
To determine growth-response curves, appropriate volumes of a 6.5 mm stock solution of Na2HAsO40.7H2O [As(V)] or NaAsO2 [As(III)] were added to different beakers (also containing the basal 1 mm CaCl2 and 5 µm H3BO3) to yield final solution concentrations of 0, 0.25, 0.5, 0.75, 1, 2.5, or 5 µm, each replicated three times for both As(V) and As(III). After approximately 18 h of growth in the basal solutions, the seedlings were transferred to these treatment beakers for a further 24 h of growth. To allow the assessment of root elongation, seedlings were photographed both at the time of transfer (0 h) and upon completion of the 24-h growth period. The digital images were analyzed using the University of Texas Health Science Center San Antonio ImageTool version 3.0 (Kopittke et al., 2008).
For a detailed analysis of root elongation rates during As exposure and during subsequent transfer to As-free solutions, an experiment was conducted that consisted of two treatments [4 µm As(V) plus a control] and was replicated three times (with seven seedlings per replicate). After approximately 18 h in a basal solution, seedlings were transferred to beakers containing 4 µm As(V) for a further 24 h of growth. After this 24-h period, the seedlings were transferred to As-free solutions (calcium and boron) for a further 24 h. Root lengths were determined using digital photography, with images collected at eight times during the experiment: −24, −18, −12, 0, 6, 12, 18, and 24 h (where −24 h represents the beginning of toxicant exposure and 0 h represents the time of transfer to the toxicant-free solution).
Finally, to examine tissue concentrations, seedlings were grown for approximately 18 h in a basal solution, transferred to a different beaker containing 4 µm As(V) for a further 24 h of growth, and then transferred to As-free solutions (calcium and boron) for a further 0, 6, or 24 h. At the completion of these growth periods, solution samples were collected and the plants were harvested (roots and shoots were separated) for the determination of fresh and dry mass values. Solution samples were analyzed using inductively coupled plasma mass spectrometry. The plant tissues were digested using 5:1 nitric acid:perchloric acid, with the tissues placed into 50-mL conical flasks with 5 mL of acid. Following digestion, the samples were diluted to 25 mL using deionized water before analysis using inductively coupled plasma mass spectrometry.
Supplemental Data
The following materials are available in the online version of this article.
Supplemental Video S1. Three-dimensional reconstruction of a root [exposed to 20 µm As(V)] using sequential computed tomography.
Supplemental Video S2. Three-dimensional reconstruction of a root [exposed to 20 µm As(V)] using sequential computed tomography.
Supplemental Video S3. Three-dimensional reconstruction of a root [exposed to 20 µm As(III)] using sequential computed tomography.
Supplemental Video S4. Three-dimensional reconstruction of a root [exposed to 20 µm As(III)] using sequential computed tomography.
Supplementary Material
Acknowledgments
This work was undertaken on the XFM beamline at the Australian Synchrotron in Victoria (proposal no. M3570). We thank Mr. A.S. Gnome for his assistance.
Glossary
- As
arsenic
- XRF
x-ray fluorescence
- µ-XRF
x-ray fluorescence microscopy
- Al
aluminum
References
- Abedin MJ, Meharg AA. (2002) Relative toxicity of arsenite and arsenate on germination and early seedling growth of rice (Oryza sativa L.). Plant Soil 243: 57–66 [Google Scholar]
- Ahsan DA, DelValls TA, Blasco J. (2009) Distribution of arsenic and trace metals in the floodplain agricultural soil of Bangladesh. Bull Environ Contam Toxicol 82: 11–15 [DOI] [PubMed] [Google Scholar]
- Ali MA. (2003) Fate of arsenic in the environment. In MF Ahmed, ed, Arsenic Contamination: Bangladesh Perspective. ITN-Bangladesh, Dhaka, Bangladesh, pp 84–100 [Google Scholar]
- Asher CJ, Reay PF. (1979) Arsenic uptake by barley seedlings. Aust J Plant Physiol 6: 459–466 [Google Scholar]
- ATSDR (2011) The ATSDR 2011 substance priority list. Agency for Toxic Substances and Disease Registry. http://www.atsdr.cdc.gov/SPL/index.html (March 23, 2012)
- Blamey FPC, Kopittke PM, Wehr JB, Menzies NW. (2011) Recovery of cowpea seedling roots from exposure to toxic concentrations of trace metals. Plant Soil 341: 423–436 [Google Scholar]
- Blute NK, Brabander DJ, Hemond HF, Sutton SR, Newville MG, Rivers ML. (2004) Arsenic sequestration by ferric iron plaque on cattail roots. Environ Sci Technol 38: 6074–6077 [DOI] [PubMed] [Google Scholar]
- Cai M-Z, Wang F-M, Li R-F, Zhang S-N, Wang N, Xu G-D. (2011) Response and tolerance of root border cells to aluminum toxicity in soybean seedlings. J Inorg Biochem 105: 966–971 [DOI] [PubMed] [Google Scholar]
- Carbonell-Barrachina AA, Burlo-Carbonell F, Mataix-Beneyto J. (1997) Arsenic uptake, distribution, and accumulation in bean plants: effect of arsenite and salinity on plant growth and yield. J Plant Nutr 20: 1419–1430 [Google Scholar]
- Carey A-M, Lombi E, Donner E, de Jonge MD, Punshon T, Jackson BP, Guerinot ML, Price AH, Meharg AA. (2012) A review of recent developments in the speciation and location of arsenic and selenium in rice grain. Anal Bioanal Chem 402: 3275–3286 [DOI] [PMC free article] [PubMed] [Google Scholar]
- Carey AM, Norton GJ, Deacon C, Scheckel KG, Lombi E, Punshon T, Guerinot ML, Lanzirotti A, Newville M, Choi Y, et al. (2011) Phloem transport of arsenic species from flag leaf to grain during grain filling. New Phytol 192: 87–98 [DOI] [PMC free article] [PubMed] [Google Scholar]
- Das HK, Mitra AK, Sengupta PK, Hossain A, Islam F, Rabbani GH. (2004) Arsenic concentrations in rice, vegetables, and fish in Bangladesh: a preliminary study. Environ Int 30: 383–387 [DOI] [PubMed] [Google Scholar]
- Driouich A, Durand C, Vicré-Gibouin M. (2007) Formation and separation of root border cells. Trends Plant Sci 12: 14–19 [DOI] [PubMed] [Google Scholar]
- FAO (2006) Arsenic Contamination of Irrigation Water, Soil and Crops in Bangladesh: Risk Implications for Sustainable Agriculture and Food Safety in Asia. Food and Agriculture Organization of the United Nations, Regional Office for Asia and the Pacific, Bangkok, Thailand, p 46 [Google Scholar]
- Frisbie SH, Ortega R, Maynard DM, Sarkar B. (2002) The concentrations of arsenic and other toxic elements in Bangladesh’s drinking water. Environ Health Perspect 110: 1147–1153 [DOI] [PMC free article] [PubMed] [Google Scholar]
- Gillman GP, Bell LC. (1978) Soil solution studies on weathered soils from tropical North Queensland. Aust J Soil Res 16: 67–77 [Google Scholar]
- Hansel CM, Fendorf S, Sutton S, Newville M. (2001) Characterization of Fe plaque and associated metals on the roots of mine-waste impacted aquatic plants. Environ Sci Technol 35: 3863–3868 [DOI] [PubMed] [Google Scholar]
- Hokura A, Omuma R, Terada Y, Kitajima N, Abe T, Saito H, Yoshida S, Nakai I. (2006) Arsenic distribution and speciation in an arsenic hyperaccumulator fern by X-ray spectrometry utilizing a synchrotron radiation source. J Anal At Spectrom 21: 321–328 [Google Scholar]
- Horswell J, Speir T. (2006) Arsenic phytotoxicity: effect on crop yield and crop quality. In P Bhattacharya, E Smith, R Naidu, P Nadebaum, G Owens, eds, Managing Arsenic in the Environment. CSIRO Publishing, Melbourne, Australia, pp 183–207 [Google Scholar]
- Hose E, Clarkson DT, Steudle E, Schreiber L, Hartung W. (2001) The exodermis: a variable apoplastic barrier. J Exp Bot 52: 2245–2264 [DOI] [PubMed] [Google Scholar]
- Kirkham R, Dunn PA, Kuczewski AJ, Siddons DP, Dodanwela R, Moorhead GF, Ryan CG, de Geronimo G, Beuttenmuller R, Pinelli D, et al. (2010) The Maia spectroscopy detector system: engineering for integrated pulse capture, low-latency scanning and real-time processing. AIP Conf Proc 1234: 240–243 [Google Scholar]
- Kopittke PM, Blamey FPC, Menzies NW. (2008) Toxicities of soluble Al, Cu, and La include ruptures to rhizodermal and root cortical cells of cowpea. Plant Soil 303: 217–227 [Google Scholar]
- Kopittke PM, Menzies NW, de Jonge MD, McKenna BA, Donner E, Webb RI, Paterson DJ, Howard DL, Ryan CG, Glover CJ, et al. (2011) In situ distribution and speciation of toxic copper, nickel, and zinc in hydrated roots of cowpea. Plant Physiol 156: 663–673 [DOI] [PMC free article] [PubMed] [Google Scholar]
- Kovar JL, Barber SA. (1988) Phosphorus supply characteristics of 33 soils as influenced by 7 rates of phosphorus addition. Soil Sci Soc Am J 52: 160–165 [Google Scholar]
- Lombi E, de Jonge MD, Donner E, Kopittke PM, Howard DL, Kirkham R, Ryan CG, Paterson D. (2011a) Fast x-ray fluorescence microtomography of hydrated biological samples. PLoS ONE 6: e20626 [DOI] [PMC free article] [PubMed] [Google Scholar]
- Lombi E, de Jonge MD, Donner E, Ryan CG, Paterson D. (2011b) Trends in hard x-ray fluorescence mapping: environmental applications in the age of fast detectors. Anal Bioanal Chem 400: 1637–1644 [DOI] [PubMed] [Google Scholar]
- Lombi E, Scheckel KG, Pallon J, Carey AM, Zhu YG, Meharg AA. (2009) Speciation and distribution of arsenic and localization of nutrients in rice grains. New Phytol 184: 193–201 [DOI] [PubMed] [Google Scholar]
- Lombi E, Zhao FJ, Fuhrmann M, Ma LQ, McGrath SP. (2002) Arsenic distribution and speciation in the fronds of the hyperaccumulator Pteris vittata. New Phytol 156: 195–203 [DOI] [PubMed] [Google Scholar]
- Ma JF, Yamaji N, Mitani N, Xu X-Y, Su Y-H, McGrath SP, Zhao F-J. (2008) Transporters of arsenite in rice and their role in arsenic accumulation in rice grain. Proc Natl Acad Sci USA 105: 9931–9935 [DOI] [PMC free article] [PubMed] [Google Scholar]
- McLaren RG, Megharaj M, Naidu R. (2006) Fate of arsenic in the soil environment. In P Bhattacharya, E Smith, R Naidu, P Nadebaum, G Owens, eds, Managing Arsenic in the Environment. CSIRO Publishing, Melbourne, Australia, pp 157–182 [Google Scholar]
- Meharg AA, Jardine L. (2003) Arsenite transport into paddy rice (Oryza sativa) roots. New Phytol 157: 39–44 [DOI] [PubMed] [Google Scholar]
- Meharg AA, Lombi E, Williams PN, Scheckel KG, Feldmann J, Raab A, Zhu YG, Islam R. (2008) Speciation and localization of arsenic in white and brown rice grains. Environ Sci Technol 42: 1051–1057 [DOI] [PubMed] [Google Scholar]
- Menzies NW, Bell LC. (1988) Evaluation of the influence of sample preparation and extraction technique on soil solution composition. Aust J Soil Res 26: 451–464 [Google Scholar]
- Moore KL, Schröder M, Wu Z, Martin BGH, Hawes CR, McGrath SP, Hawkesford MJ, Feng Ma J, Zhao FJ, et al. (2011) High-resolution secondary ion mass spectrometry reveals the contrasting subcellular distribution of arsenic and silicon in rice roots. Plant Physiol 156: 913–924 [DOI] [PMC free article] [PubMed] [Google Scholar]
- Neumann RB, Ashfaque KN, Badruzzaman ABM, Ashraf Ali M, Shoemaker JK, Harvey CF. (2010) Anthropogenic influences on groundwater arsenic concentrations in Bangladesh. Nat Geosci 3: 46–52 [Google Scholar]
- Paterson DJ, de Jonge MD, Howard DL, McKinlay WLJ, Starritt A, Kusel M, Ryan CG, Kirkham R, Moorhead G, Siddons DP. (2011) The x-ray fluorescence microscopy beamline at the Australian synchrotron. AIP Conf Proc 1365: 219–222 [Google Scholar]
- Pickering IJ, Gumaelius L, Harris HH, Prince RC, Hirsch G, Banks JA, Salt DE, George GN. (2006) Localizing the biochemical transformations of arsenate in a hyperaccumulating fern. Environ Sci Technol 40: 5010–5014 [DOI] [PubMed] [Google Scholar]
- Pickering IJ, Prince RC, George MJ, Smith RD, George GN, Salt DE. (2000) Reduction and coordination of arsenic in Indian mustard. Plant Physiol 122: 1171–1177 [DOI] [PMC free article] [PubMed] [Google Scholar]
- Reisenauer HM. (1966) Mineral nutrients in soil solution. In PL Altman, DS Dittmer, eds, Environmental Biology. Federation of American Societies for Experimental Biology, Bethesda, MD, pp 507–508 [Google Scholar]
- Ryan CG. (2000) Quantitative trace element imaging using PIXE and the nuclear microprobe. Int J Imaging Syst Technol 11: 219–230 [Google Scholar]
- Ryan CG, Jamieson DN. (1993) Dynamic analysis: on-line quantitative PIXE microanalysis and its use in overlap-resolved elemental mapping. Nucl Instrum Methods Phys Res B 77: 203–214 [Google Scholar]
- Seyfferth AL, Webb SM, Andrews JC, Fendorf S. (2010) Arsenic localization, speciation, and co-occurrence with iron on rice (Oryza sativa L.) roots having variable Fe coatings. Environ Sci Technol 44: 8108–8113 [DOI] [PubMed] [Google Scholar]
- Smith E, Kempson I, Juhasz AL, Weber J, Skinner WM, Gräfe M. (2009) Localization and speciation of arsenic and trace elements in rice tissues. Chemosphere 76: 529–535 [DOI] [PubMed] [Google Scholar]
- Smith E, Naidu R, Alston AM. (1998) Arsenic in the soil environment: a review. Adv Agron 64: 149–195 [Google Scholar]
- Smith PG, Koch I, Gordon RA, Mandoli DF, Chapman BD, Reimer KJ. (2005) X-ray absorption near-edge structure analysis of arsenic species for application to biological environmental samples. Environ Sci Technol 39: 248–254 [DOI] [PubMed] [Google Scholar]
- Wang P, Zhou DM, Weng NY, Wang DJ, Peijnenburg WJ. (2011) Calcium and magnesium enhance arsenate rhizotoxicity and uptake in Triticum aestivum. Environ Toxicol Chem 30: 1642–1648 [DOI] [PubMed] [Google Scholar]
- Zhao FJ, Ma JF, Meharg AA, McGrath SP. (2009) Arsenic uptake and metabolism in plants. New Phytol 181: 777–794 [DOI] [PubMed] [Google Scholar]
- Zhao FJ, McGrath SP, Meharg AA. (2010) Arsenic as a food chain contaminant: mechanisms of plant uptake and metabolism and mitigation strategies. Annu Rev Plant Biol 61: 535–559 [Google Scholar]
- Zimmer D, Kruse J, Baum C, Borca C, Laue M, Hause G, Meissner R, Leinweber P. (2011) Spatial distribution of arsenic and heavy metals in willow roots from a contaminated floodplain soil measured by x-ray fluorescence spectroscopy. Sci Total Environ 409: 4094–4100 [DOI] [PubMed] [Google Scholar]
Associated Data
This section collects any data citations, data availability statements, or supplementary materials included in this article.


