

Abstract
This investigation aims to explore determinants of exposure to particle size-specific welding fume. Area sampling of ultrafine particles (UFP) was performed at 33 worksites in parallel with the collection of respirable particles. Personal sampling of respirable and inhalable particles was carried out in the breathing zone of 241 welders. Median mass concentrations were 2.48 mg m−3 for inhalable and 1.29 mg m−3 for respirable particles when excluding 26 users of powered air-purifying respirators (PAPRs). Mass concentrations were highest when flux-cored arc welding (FCAW) with gas was applied (median of inhalable particles: 11.6 mg m−3). Measurements of particles were frequently below the limit of detection (LOD), especially inside PAPRs or during tungsten inert gas welding (TIG). However, TIG generated a high number of small particles, including UFP. We imputed measurements <LOD from the regression equation with manganese to estimate determinants of the exposure to welding fume. Concentrations were mainly predicted by the welding process and were significantly higher when local exhaust ventilation (LEV) was inefficient or when welding was performed in confined spaces. Substitution of high-emission techniques like FCAW, efficient LEV, and using PAPRs where applicable can reduce exposure to welding fume. However, harmonizing the different exposure metrics for UFP (as particle counts) and for the respirable or inhalable fraction of the welding fume (expressed as their mass) remains challenging.
Keywords: exposure, inhalable particles, manganese, respirable particles, UFP, welding fume
INTRODUCTION
Welding joins metal pieces by intense heat where consumable electrodes are frequently applied to improve the assembly of the larger parts. Fume arises from the base metal and in particular from electrodes. Welding fume is a complex mixture of metals, gases, and other compounds. In addition, it comprises very small particles, including ultrafine matter (Berlinger et al., 2011). The exposure of welders is dependent on several factors, including the welding process itself, workplace characteristics, and protective measures (Burgess, 1995).
The exploration of potential determinants of exposure to welding fume requires a large and informative dataset to assess measures needed for the protection of welders from the hazards of welding fume (Hewitt, 2001). Preventive measures are for example local exhaust ventilation (LEV) and the wearing of respirators. Besides experimental data from inhalation chambers, few datasets from field studies have been analyzed to assess determinants of exposure (Flynn and Susi, 2010; Hobson et al., 2011).
The International Agency for Research on Cancer (IARC) classified welding fume as possibly carcinogenic for humans (Group 2B) (IARC, 1990).The US Occupational Safety and Health Administration (OSHA) has not yet set a permissible exposure limit specifically for welding fume. The US National Institute for Occupational Safety and Health considers welding fume a potential occupational carcinogen and recommends a reduction in exposure to welding fume to the lowest feasible level (OSHA, 1997). Furthermore, the American Conference of Governmental Industrial Hygienists (ACGIH) has currently withdrawn the threshold limit value for total dust of 5 mg m−3 (ACGIH, 2011). In Germany, the Federal Ministry of Labor and Social Affairs has set an occupational exposure limit (OEL) for inhalable (10 mg m−3) and respirable (3 mg m−3) particulate matter, which also applies for welding fume.
Welding is an important source of ultrafine particles (UFP) and their agglomerates (Antonini, 2003). Threshold limits for UFP are currently under discussion, but determining an appropriate exposure metric remains challenging. Whereas weighing has been applied to assess the mass concentrations of respirable and inhalable particles, particle counts are currently used to measure UFP exposure. Whether a conversion between these different metrics is feasible for setting OELs has to be explored. However, UFP exposure of welders has not yet been sufficiently described, and the physico-chemical characterization of welding fume is under way (Elihn and Berg, 2009; Buonanno et al., 2011).
The WELDOX study aimed to comprehensively assess the exposure of welders to welding fume and investigate the ensuing health effects. In this analysis, we evaluate exposure to welding fume according to different size fractions and estimate the influence of potential predictors on the concentrations in the breathing zone of welders. Data on exposure to manganese and iron has been published elsewhere (Pesch et al., 2012).
METHODS
Study population
Between May 2007 and October 2009, 241 welders from 25 German companies (5 shipyards, 13 manufacturers of containers and vessels, 4 manufacturers of machines and tools) were recruited in the cross-sectional WELDOX study as described by Pesch et al. (2012). In brief, representatives of the German Social Accident Insurance (DGUV) visited the companies to present the study. Usually, 12 welders per company were selected by the production manager. Four welders in each shift were equipped with personal samplers on Tuesday, Wednesday, or Thursday. A trained team of the Institute for Prevention and Social Medicine of the DGUV conducted the examination throughout the whole study period between 2 p.m. and 4 p.m. The survey included a face-to-face interview, lung function measurements, and the sampling of blood, urine, induced sputum, and exhaled breath condensate for the determination of various biomarkers. All participants provided written informed consent. The study was approved by the Ethics Committee of the Ruhr University Bochum and was conducted in accordance with the Helsinki Declaration.
Exposure data were gathered within the framework of the measurement system for exposure assessment of the DGUV, and documented in the MEGA database of measurements at workplaces complied at the Institute for Occupational Safety and Health of the DGUV (IFA) (Stamm, 2001; Gabriel et al., 2010). In addition to the computer-assisted description of the workplaces, photos were taken. Five experts rated the efficiency of the LEV with regard to the position of the nozzle in relation to plume and breathing zone and assessed confined work spaces as locations that strongly restricted air exchange, for example the double bottom of a ship.
Sampling and determination of welding fume
All welders were equipped with two sampling systems in order to simultaneously determine exposure to inhalable and respirable particles during a working shift. Samplers were mounted in the breathing zone and onto the welders’ face shield facing inward through a hole as shown in Fig. 1. Personal sampling of inhalable particles was performed with the German sampler GSP 3.5, which is equipped with a cellulose nitrate filter with a pore size of 8 μm and a diameter of 37 mm and operates at a flow rate of 3.5 l min−1. The GSP sampler is commonly applied in monitoring exposure to particles on behalf of the German Social Accident Insurance (Breuer et al., 2011). For the personal collection of respirable particles, a PGP-EA sampler was applied with a similar cellulose nitrate filter and flow rate, where a polyurethane filter preselected particles larger than respirable (Moehlmann, 2006).The average duration of personal measurements was 3.5 h, ranging from 2 to 5 h. Both samplers comply with EN 481 respectively International Organization for Standardization (ISO 7708) (CEN, 1993).
Fig. 1.
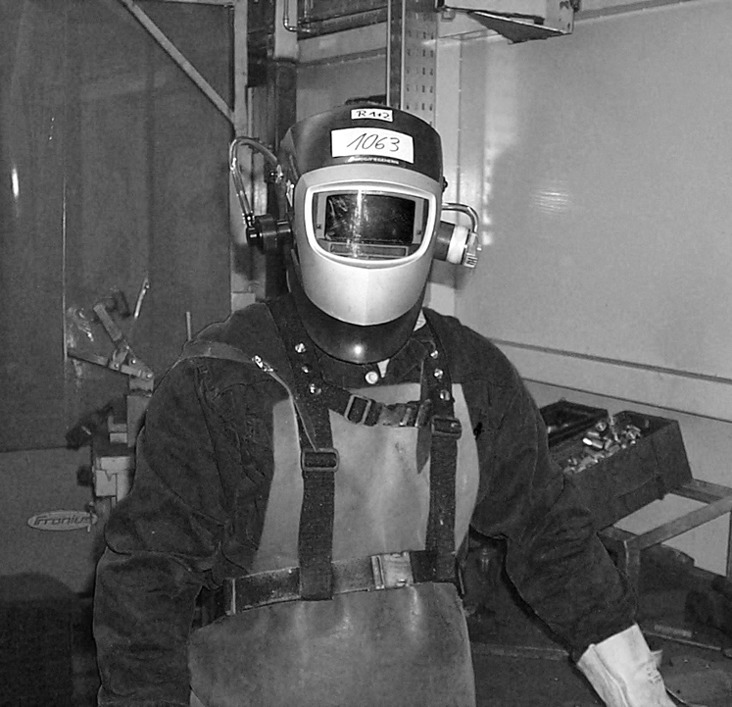
Welder equipped with the PGP-EA sampler on the right side and the GSP sampler on the left side, both facing inside the shield.
The area sampling of UFP and agglomerates was performed close to the welder together with a sampling of respirable welding fume (n = 31) at the same position. Respirable particles were measured with a FSP device, which is also equipped with a cellulose nitrate filter in combination with a cyclone preselector and operates at a flow rate of 10 l min−1.
The particle-loaded filters were shipped to the Institute for Occupational Safety and Health of the German Social Accident Insurance (IFA) for particle and metal analysis. Dust concentrations were determined by weighing following the method described by Hahn (2005) and Hebisch et al. (2005). The procedures complied with the requirements of ISO 15767 (ISO, 2006). Before weighing, the unloaded and particle-loaded sampling media were equilibrated to the laboratory atmosphere for at least 1 day. Environmental conditions, such as humidity, were considered by calibration. The limit of deduction (LOD) was three times the standard deviation of the weight difference (weights determined before and after shipment) for a minimum of ten unloaded filters having undergone the complete procedure, including transport to the measurement site and back. Ninety personal measurements of respirable welding fume and 33 measurements of inhalable particles, both collected with PGP-EA, and 47 measurements of inhalable particles collected with GSP 3.5 were below LOD.
Manganese (Mn) was determined by inductively coupled plasma mass spectrometry (ICP-MS) with a Perkin Elmer Elan DRC II (Waltham, MA) as described by Pesch et al (2012) . The sample preparation corresponded to a German standard protocol (Hebisch et al., 2005). In brief, the loaded cellulose nitrate filters were digested with 10 ml of a mixture of nitric acid and hydrochloric acid. This solution was heated for 2 h under reflux in a heating block at 130°C. After cooling to room temperature, the solution was diluted with 10 ml of ultrapure water to dilute the viscous solution before ICP-MS analysis was carried out. ICP mass spectrometer was calibrated with different multi-element standard solutions covering the range of analytes. The isotopes 45Sc, 85Rb, and 165Ho were used as internal standards. Five measurements of respirable manganese were below the limit of quantitation.
Particles of an electrical mobility diameter between 14 and 673 nm were counted by a Scanning Mobility Particle Sizer (SMPS) (TSI, Aachen, Germany) at 33 workplaces. We further refer to these particles as UFP including their agglomerates (UFP). The SMPS device measured the size distribution of submicron particles in real time by determining their mobility-equivalent diameters with an electrostatic classifier (Brouwer et al., 2004). Their concentration was measured with a condensation particle counter. Data were evaluated and stored by TSI AIM 8.0 software, including diffusion correction. The median duration of measurements was ∼3 h.
Statistical methods
All calculations were performed with the statistical software SAS, version 9.2 (SAS Institute Inc., Cary, NC). We presented the number of observations, the number of measurements <LOD, median, and interquartile range (IQR) to describe the distribution of the exposure variables. Different LODs resulted from the varying duration of measurements. A concentration >LOD measured during a longer sampling period could be lower than a value <LOD due to a shorter sampling time. For these left-censored variables, the summary statistics cannot be computed by common methods. Instead, we calculated the percentiles by first substituting values <LOD by their corresponding LOD. Then we estimated the percentiles. If the maximum of LODs was higher than the calculated percentile, we marked this percentile by a less-than (<) sign.
Associations between two exposure variables were presented by Spearman rank correlation coefficients (rs) with 95% confidence intervals (CIs). Using scatter plots, we depicted values <LOD with 2/3 LOD because multiple imputations, as applied in modeling, would yield a set of estimates per value.
The variables were log-transformed due to their skewed distributions for model building and parametric tests. Potential determinants of the welding-fume concentrations were explored with multiple regression models. The regression coefficients were presented with 95% CIs at the original scales, exp(β). Concentrations <LOD were imputed 100 times from the regression with the Mn concentrations where nearly all concentrations were measurable. This relation was fitted through a Tobit regression model (Tobin, 1958) with welding fume as dependent variable and Mn as independent variable. Afterward, the results of the Tobit regression model were used to impute the mass concentrations of respirable welding fume for measurements <LOD for a 100 times according to the following model:. Finally, the imputed data were used in multiple linear regression models and the combined effect estimates for potential predictors were presented (Rubin, 1987). According to Harel (2009), estimations of adjusted R 2 were presented as measures of the model fit.
RESULTS
Study population
Characteristics of the 241 welders and their working conditions are shown in Table 1. The participants were enrolled from shipyards (n = 56), manufacture of containers and vessels or related products (n = 139), and machine or tool building (n = 46). The welding techniques comprised gas metal arc welding with solid wire (GMAW) (n = 95) or flux-cored wire (FCAW) (n = 47), tungsten inert gas welding (TIG) (n = 66), and shielded metal arc welding (SMAW) with stick electrodes (n = 20). Additionally, 13 welders performed more than one welding technique during the shift. We took the consumable electrode for classification of the material into account because the majority of the fume originates from the electrodes. If no consumable material was applied, we considered the base metal alloy for classification. Steel, with a content of <5% in mass of any metal other than iron, was classified as ‘mild steel’ (n = 83), and iron-based alloys with a content of at least 5% of chromium were classified as ‘stainless steel’ (n = 148). The category ‘others’ comprised other alloys and the welding of different materials during the shift (n = 10). Special helmets with powered air-purifying respirators (PAPR) were used by 26 welders. These PAPRs were motorized systems that use a filter to clean ambient air before it is delivered to the breathing zone of the worker. Another 49 welders used maintenance-free particulate respirators hereinafter referred to as dust masks. LEV was efficiently used by 54 welders, and 23 welders worked in confined spaces. The median age of the welders was 41 years (range 19–61 years).
Table 1.
Characteristics of 241 welders enrolled in the WELDOX study.
| Variable | Category | n (%) |
| Industry | Shipyard | 56 (23.2%) |
| Manufacture of containers and vessels | 139 (57.7%) | |
| Machine and tool building | 46 (19.1%) | |
| Welding process | GMAW | 95 (39.4%) |
| FCAW | 47 (19.5%) | |
| TIG | 66 (27.4%) | |
| SMAW | 20 (8.3%) | |
| Miscellaneous | 13 (5.4%) | |
| Material | Stainless steel | 148 (61.4%) |
| Mild steel | 83 (34.4%) | |
| Others | 10 (4.1%) | |
| Respiratory protection | PAPR | 26 (10.8%) |
| Maintenance-free particulate respirator (dust mask) | 49 (20.3%) | |
| None | 166 (68.9%) | |
| Efficient LEV | Yes | 54 (22.4%) |
| No | 187 (77.6%) | |
| Confined space | Yes | 23 (9.5%) |
| No | 218 (90.5%) |
Exposure to respirable welding fume
The concentrations of respirable fume from personal measurements ranged from measurements <LOD up to 21.5 mg m−3. All but one welder using PAPRs had concentrations of respirable welding fume <LOD (Fig. 2). PAPR was not used in TIG welding. When excluding PAPR users, the median concentration was 1.29 mg m−3 and varied by welding process with higher concentrations for FCAW (median 8.02 mg m−3) and measurements frequently below LOD for TIG (Table 2). Dust masks were commonly used in settings with elevated fume concentrations (Fig. 3).
Fig.2.

Respirable welding fume inside PAPRs and in welders without PAPR (excluding workers applying TIG and miscellaneous techniques during the shift).
Table 2.
Exposure to respirable and inhalable welding fume and to UFP in welders (excluding users of PAPRs).
| Personal measurements | Inhalable particles (GSP), mg m−3 | Inhalable particles (PGP-EA), mg m−3 | Respirable particles (PGP-EA), mg m−3 | ||||||||||
| n | n <LOD a | Median | IQR | n | n <LOD a | Median | IQR | n | n <LOD a | Median | IQR | ||
| Total | 177 | 27 | 1.51 | <0.65, 4.50 | 215 | 20 | 2.48 | 1.10, 6.81 | 215 | 65 | 1.29 | <0.45, 4.01 | |
| GMAW | 62 | 2 | 3.65 | 1.80, 5.69 | 78 | 1 | 4.41 | 2.36, 6.36 | 78 | 9 | 2.08 | 1.20, 3.78 | |
| FCAW | 22 | 0 | 8.02 | 2.83, 12.50 | 42 | 0 | 12.90 | 7.98, 15.50 | 42 | 0 | 7.11 | 4.53, 10.10 | |
| TIG | 64 | 22 | <0.58 | <0.42, 0.93 | 66 | 17 | <0.96 | <0.77, 1.41 | 66 | 47 | <0.42 | <0.36, <0.51 | |
| SMAW | 17 | 3 | 1.12 | 0.52, 3.55 | 17 | 1 | 1.65 | 1.17, 2.93 | 17 | 8 | <0.49 | <0.45, 1.85 | |
| Subgroup with UFP measurements | Particle size (nm) | Stationary measurements | Stationary measurements | Personal measurements | |||||||||
| UFP, number concentration (x1000 cm−3) | Respirable particles (mg m−3) | Respirable particles (mg m−3) | |||||||||||
| n | n <LOD a | Median | IQR | n | n <LOD a | Median | IQR | n | n <LOD a | Median | IQR | ||
| Total | 14–673 | 33 | — | 124.6 | 100.8, 161.2 | 31 | 4 | 0.93 | 0.54, 1.60 | 31 | 12 | 1.37 | <0.41, 5.58 |
| 14–100 | 33 | — | 67.2 | 47.2, 96.6 | |||||||||
| GMAW | 14–673 | 13 | — | 126.8 | 108.5, 167.0 | 13 | 0 | 1.00 | 0.74, 1.53 | 13 | 4 | 1.86 | <0.43, 3.78 |
| 14–100 | 13 | — | 63.3 | 52.5, 88.2 | |||||||||
| FCAW | 14–673 | 10 | — | 122.3 | 97.5, 140.7 | 10 | 0 | 1.24 | 0.83, 7.42 | 10 | 2 | 6.23 | 1.37, 7.08 |
| 14–100 | 10 | — | 49.3 | 43.7, 77.7 | |||||||||
| TIG | 14–673 | 6 | — | 151.3 | 124.6, 181.5 | 6 | 3 | <0.21 | <0.13, 0.75 | 6 | 4 | <0.40 | <0.34, 0.70 |
| 14–100 | 6 | — | 109.5 | 96.2, 156.8 | |||||||||
| SMAW | 14–673 | 4 | — | 91.3 | 56.6, 143.4 | 2 | 1 | <0.91 | <0.18, 1.63 | 2 | 2 | <0.54 | <0.49, <0.58 |
| 14–100 | 4 | — | 53.6 | 40.8, 76.5 | |||||||||
N <LOD, number of observations below the limit of determination.
Fig. 3.

Comparison of respirable welding fume concentrations in the breathing zones of welders using dust masks and welders not using dust masks (excluding welders using PAPR).
Ninety (37%) measurements of the respirable fume were below LOD. It is noteworthy that LODs were inversely associated with the duration of sampling as shown in Fig. 4. We imputed welding-fume values <LOD as described by employing the strong correlation between respirable Mn and welding fume (rs = 0.92, 95% CI 0.90–0.94, in the range of measurable data) (Fig. 5). The correlation with Mn was stronger than the corresponding association with iron (rs = 0.88, 95% CI 0.84–0.91, in the range of measurable data). Therefore, manganese was chosen for imputation of welding-fume data <LOD. The Tobit regression equation for the log-transformed concentrations was (pseudo R 2 = 0.91).
Fig. 4.

Concentrations of respirable welding fume by sampling duration.
Fig. 5.

Association between concentrations of respirable welding fume and respirable manganese and the regression line with 95% confidence intervals from the Tobit model.
From this dataset of welding-fume concentrations, we further excluded 26 welders with PAPRs that were mostly below LOD in order to estimate the potential determinants of exposure to respirable welding fume. Table 3 presents the effect estimates from multiple regression analysis. The mass concentrations of respirable particles were mainly predicted by the welding process and modified by workplace characteristics. TIG was associated with 0.18 (95% CI 0.142–0.27) fold lower and FCAW with 2.25 (95% CI 1.52–3.32) fold higher concentrations than GMAW. Welding of stainless steel was associated with 0.55 fold lower concentrations in comparison to mild steel. Working in confined spaces increased exposure by a factor of 1.87 (95% CI 1.17–2.99). Efficient LEV reduced the concentrations by a factor of 0.43 (95% CI 0.29–0.6).The model fit, assessed as R 2, was 0.65. Two other statistical approaches (Tobit regression, multiple imputations) dealing with values below LOD revealed similar results (data not shown).
Table 3.
Potential determinants of exposure to respirable and inhalable welding fume (excluding users of PAPRs).
| Factor | Respirable, n = 215 | Inhalable (GSP), n = 177 | ||||||
| n | n <LOD a | 95% CI | n | n <LOD a | 95% CI | |||
| Intercept (mg m−3) | 2.72 | 2.12–3.49 | 4.02 | 3.11–5.20 | ||||
| Gas metal arc welding | 78 | 9 | 1 | 62 | 2 | 1 | ||
| FCAW | 42 | 0 | 2.25 | 1.52–3.32 | 22 | 0 | 1.68 | 1.10–2.58 |
| TIG | 66 | 47 | 0.18 | 0.12–0.27 | 64 | 22 | 0.19 | 0.13–0.29 |
| Shielded metal arc welding | 17 | 8 | 0.68 | 0.37–1.26 | 17 | 3 | 0.78 | 0.46–1.34 |
| Miscellaneous | 12 | 1 | 1.13 | 0.61–2.10 | 12 | 0 | 1.93 | 0.53–1.62 |
| Mild steel | 83 | 5 | 1 | 59 | 0 | 1 | ||
| Stainless steel | 122 | 58 | 0.55 | 0.39–0.79 | 108 | 25 | 0.74 | 0.50–0.10 |
| Miscellaneous | 10 | 2 | 0.83 | 0.43–1.58 | 10 | 2 | 1.19 | 0.66–2.17 |
| Nonconfined space | 193 | 65 | 1 | 165 | 27 | 1 | ||
| Confined space | 22 | 0 | 1.87 | 1.17–2.99 | 12 | 0 | 1.37 | 0.81–2.29 |
| Nonefficient LEV | 167 | 47 | 1 | 130 | 20 | 1 | ||
| Efficient LEV | 48 | 18 | 0.43 | 0.29–0.64 | 47 | 7 | 0.45 | 0.32–0.64 |
| R 2 (95% CI) | 0.65b (0.57–0.73) | 0.59b (0.49–0.68) | ||||||
N <LOD, number of observations below the limit of determination.
R 2 (Harel, 2009).
Exposure to inhalable welding fume
Figure 6 presents the association between respirable and inhalable fume collected with the same PGP-EA sampler. The data pairs were highly correlated at their log-transformed scales within the range of measurable fume (log10 y(respirable) = −0.329 + 1.061 log10 x(inhalable), adjusted R 2 = 0.91). This strong association also explains a similar pattern of determinants of the concentrations as shown in Tables 2 and 3.
Fig. 6.

Association between respirable and inhalable welding fume (sampled with PGP-EA).
Figure 7 shows the distributions of inhalable welding fume from side-by-side measurements with two samplers (GSP 3.5 and PGP-EA). The log-transformed concentrations were highly correlated within the range of measurable fume with a good model fit (log10 y(PGP-EA) = 0.209 + 0.832 log10 x(GSP), adjusted R 2 = 0.79). Concentrations determined by PGP-EA (median 2.48 mg m−3) were systematically higher than those determined by GSP 3.5 (median 1.51 mg m−3) (Table 2). When including the 26 PAPR users, the concentrations were slightly lower.
Fig. 7.

Association between inhalable welding fume sampled with different devices (PGP-EA and GSP).
Area sampling of respirable and UFP
Area sampling revealed a median count of 120 000 cm−3 (IQR 100 000–160 000) in the particle size ranging from 14 to 673 nm comprising UFP and their agglomerates over all five welding processes (Table 2). Figure 8 shows the relation between particle diameters and number concentrations by welding technique measured stationary at 33 worksites in total, with >20 scans per worksite. TIG welding generated smaller particles most of which were <100 nm, whereas GMAW, FCAW, and SMAW yielded larger particle agglomerates that were mainly >100 nm.
Fig. 8.

Particle size distributions measured by SMPS (number count versus particle diameter in the range 14–673 nm) averaged over the worksites for different welding techniques (GMAW, FCAW, TIG, and SMAW).
Figure 9 depicts the association of particle counts of UFP and their agglomerates with the mass concentration of respirable particles at the same sampling location. The Spearman rank correlation was rs = 0.42 (95% CI 0.04–0.69) within the range of measurable data. The stationary sampling near 31 welders revealed a median concentration of 0.93 mg m−3 for respirable particles (Table 2) and showed no clear correlation with the corresponding personal measurements (rs = 0.31, 95% CI −0.18, 0.66, in the range of measurable data).
Fig. 9.

Association between counts of UFP and their agglomerates (14–673 nm) with mass concentration of respirable particles from side-by-side area measurements.
DISCUSSION
This investigation aimed to characterize exposure to welding fume in different particle size distributions in 241 welders. In the past, welding fume has been commonly measured as total dust or inhalable particles (Hobson et al., 2011). However, respirable particles reach the alveoli and are more specific with regard to lung diseases and systemic metal exposure from the welding fume. In this WELDOX study, we measured respirable and inhalable welding fume in parallel. A large fraction of respirable welding fume measurements was <LOD but concentrations were also measured that were higher than 3 mg m−3, which is the German OEL for this particle size fraction [Federal Institute for Occupational Safety and Health (BAuA), 2006]. The welding technique was a major determinant of the mass concentrations when excluding PAPRs where concentrations were mostly <LOD. Mass concentrations were highest using FCAW and lowest using TIG. Furthermore, higher exposures occurred when welding mild steel than stainless steel in confined spaces, or when LEV was not efficiently used. Stationary measurements of UFP and their agglomerates near the welder revealed smaller particles when applying TIG.
The side-by-side measurements at workplaces showed that respirable particles comprised about half of the mass of the inhalable particles in the welding fume. The particles were measured simultaneously with the PGP-EA device where a foam layer separated respirable particles from larger particles. It has to be noted that this relationship between respirable and inhalable particles may not hold for certain metals in the welding fume. For example, manganese occurs in welding fume mostly as respirable particles (Harris et al., 2005; Pesch et al., 2012). It is important to note that our results were derived in a large group of welders applying a variety of welding techniques and not in an experimental setting.
With regard to the variation of exposure by welding process, the mass concentration of inhalable particles was on average <1 mg m−3 in TIG welding, supporting previously published levels (0.16–1.10 mg m−3) (Burgess, 1995; Hobson et al., 2011). High mass concentrations previously reported for FCAW could be also confirmed (Kiefer et al., 1998). The average concentrations of inhalable particles collected in parallel with two samplers (medians 8.0 and 12.9 mg m−3) correspond to mean concentrations reported from other studies (6.3–24.2 mg m−3) (Hobson et al., 2011). We determined somewhat higher concentrations for GMAW (3.7–4.4 mg m−3) when compared to literature where means ranged from 1.0 to 2.9 mg m−3 (Hobson et al., 2011). The improvement or application of welding techniques, with regard to a lowering of emission rates, should be taken into account for future reductions of the welders’ exposure.
About 30% of the welders used respiratory protection, mostly in high-exposure settings. A strong reduction in exposure to welding fume was observed inside of PAPRs where most measurements appeared <LOD (see also Myers and Peach, 1983). However, PAPRs may hinder the welder’s movement in confined spaces, for example in shipbuilding and the inside of vessels. The protective effect of the dust mask could not be directly assessed because aerosol sampling behind the mask was not possible. However, it was assessed indirectly by comparing the results of biological monitoring for those with and without dust masks (Pesch et al., 2012).
Significant reduction of exposure to welding fume was observed when LEV was used efficiently. Nearly 2-fold higher concentrations were measured among welders working in confined spaces. Both factors, efficient LEV and confined space, were assessed by an expert panel using various documentations of the workplaces, including photos and computer-assisted descriptions from the German MEGA database of measurements (Gabriel et al., 2010). Efficiency of LEV was predominantly affected by proper handling of the device, for example by positioning the nozzle inside the plume. Only one in four welders used LEV efficiently. Further improvements could be, for example, the integration of the device into the torch or the integration of a lamp into the device for an indirect improvement of the nozzle position due to better illumination of the workplace. Accumulation of welding fume in confined spaces can be better avoided by a forced particle extraction rather than by dilution ventilation (Wurzelbacher et al., 2002). Lower exposure to welding fume in workers processing stainless steel maybe attributed to different process parameters (e.g. shielding gas mixture, operating speed, thickness of the wire, adjustment of the welding unit) (Fiore, 2008). Furthermore, better ventilation in stainless steel works could not be ruled out.
Few studies applied statistical modeling to explore potential determinants of exposure, for example analyses conducted by Hobson et al. (2011) or Flynn and Susi (2010). Effects can be estimated with sufficient confidence in large and informative datasets. In our study with detailed information on the welders’ working circumstances, the limited sensitivity of weighing particles was challenging. A low particle–mass concentration in combination with a short duration of sampling kept the sampled mass below the analytical limits of detection. A substitution of data <LOD, commonly by LOD/2 or 2/3 LOD yields biased estimates. Various methods have been employed to avoid substantial bias by substitution (Helsel, 2006). In this study, three different methods, i.e. multiple imputation based on the regression between welding fume and Mn, Tobit regression, and multiple imputation based on the distribution of measurable welding-fume concentrations, were applied to deal with censored exposure data in the regression models. These different statistical approaches yielded similar effect estimates. Therefore, we presented the results of multiple imputation based on the Mn regression only. All models fitted the data well and explained ∼60 to 70% of the variance of the exposure to welding fume. The good model fit is in line with an analysis of Hobson et al. (2011) and may be due to the large difference in particle–mass concentrations between the welding techniques.
Methodological issues also influence the performance of the devices for sampling according to a defined particle size distribution (Kenny et al., 1997). Furthermore, the location of the sampler on the welder’s body may also influence the collected fume (Goller and Paik, 1985). Sampling of inhalable welding fume was performed simultaneously with two different devices working at the same flow rate of 3.5 l min−1. The PGP-EA sampler was predominately mounted on the right side of the welder and the GSP 3.5 sampler on the left side, both within the breathing zone of the welder and facing inwards the shield. Slightly higher concentrations of inhalable particles were determined with the PGP-EA sampler compared with the German standard device GSP 3.5.
UFP, i.e. particles with a mobility diameter of ≤100 nm, have received growing attention due to their possible health effects, and measurement methods are under way for application at the workplace (ISO, 2006; Moehlmann, 2007). Few field studies have been conducted in occupational settings (Elihn and Berg, 2009; Buonanno et al., 2011). Due to the size of the stationary SMPS device and the spatial conditions at the workplace, area sampling of UFP and its agglomerates was performed close to the welder at 33 selected workplaces with varying distances. In addition, an FSP device working at a flow rate of 10 l min−1, was positioned at the same place to collect respirable particles. In comparison to the personal samplers, that operated at 3.5 l min−1, area sampling revealed ∼40% lower concentrations than personal sampling in the breathing zone.
Particle concentrations can be assessed by mass, counts, or surface area. The alloy and fluxing compounds may modify the fume characteristics (Wurzelbacher et al., 2002; Zimmer, 2002). In addition, temperature, humidity, and air motion can also influence, to an unknown extent, the agglomeration of particles. A physicochemical characterization of the welding fume revealed that particles <50 nm were mostly metal oxides in contrast to larger particles that also contained nonmetal components (Berlinger et al., 2011). TIG, although having the lowest level of exposure to welding fume in terms of mass, generated a larger number proportion of small particles than other techniques in this study, as shown in more detail by Pelzer et al. (2011). It is important to note that TIG is commonly applied to stainless steel. The number of particles with a diameter <100 nm was about twice the number produced by other techniques. According to our knowledge, no other study has so far examined UFP exposure by welding technique.
Harmonizing different exposure metrics has been a methodological challenge in occupational epidemiology, for example in quartz research (Seixas et al., 1997; Dahmann et al., 2008a, 2008b). Less is known about the feasibility of a conversion between mass and particle counts with regard to welding fume. Our subset of side-by-side measurements of respirable particles expressed as mass concentration and UFP with agglomerates expressed as particle counts show a weak correlation. The median particle size and the respirable mass concentration were stronger associated (Pelzer et al., 2011). Larger datasets are needed to conclude whether a conversion of both metrics is possible for welding fume.
CONCLUSION
The welding process is the major determinant of the exposure to particles in different size fractions. The highest mass concentrations were found in FCAW, followed by GMAW and SMAW, whereas mass concentrations determined during TIG were frequently below LOD. Although TIG appeared with the lowest concentrations in terms of particle mass, we observed larger numbers of small-sized particles, including UFP. An inefficient use of LEV or working in confined spaces can increase the exposure of welders. PAPRs reduced exposure considerably but their use is less feasible in confined spaces. The substitution of high-emission techniques and the introduction of automated welding technologies, in addition to improvements of the ventilation and respiratory protection may successfully reduce exposure to welding fume.
FUNDING
German Social Accident Insurance (DGUV) to the WELDOX study.
Acknowledgments
We thank the staff working for the MGU measurement system, and all welders having participated. We gratefully acknowledge the field team, especially Sandra Zilch-Schöneweis, Hans Berresheim, and Hannelore Ramcke-Kruell.
References
- ACGIH Monograph. TLVs and BEIs, threshold limit values for chemical substances and physical agents and biological exposure indices. Cincinnati, OH: Signature Publications; 2011. [Google Scholar]
- Antonini JM. Health effects of welding. Crit Rev Toxicol. 2003;33:61–103. doi: 10.1080/713611032. [DOI] [PubMed] [Google Scholar]
- Berlinger B, Benker N, Weinbruch S, et al. Physicochemical characterisation of different welding aerosols. Anal Bioanal Chem. 2011;399:1773–80. doi: 10.1007/s00216-010-4185-7. [DOI] [PubMed] [Google Scholar]
- Breuer D, Hahn JU, Hober D, et al. Air sampling and determination of vapours and aerosols of bitumen and polycyclic aromatic hydrocarbons in the Human Bitumen Study. Arch Toxicol. 2011;85(Suppl. 1):11–20. doi: 10.1007/s00204-011-0678-1. [DOI] [PubMed] [Google Scholar]
- Brouwer DH, Gijsbers JH, Lurvink MW. Personal exposure to ultrafine particles in the workplace: exploring sampling techniques and strategies. Ann Occup Hyg. 2004;48:439–53. doi: 10.1093/annhyg/meh040. [DOI] [PubMed] [Google Scholar]
- Buonanno G, Morawska L, Stabile L. Exposure to welding particles in automotive pants. J Aerosol Sci. 2011;42:295–304. [Google Scholar]
- Burgess WA. Welding. In: Burgess WA, editor. Recognition of health hazards in industry. New York: Wiley Interscience; 1995. pp. 167–204. [Google Scholar]
- CEN. EN 481: workplace atmospheres: size fraction definitions for measurement of airborne particles. Brussels, Belgium: European Committee for Standardization; 1993. [Google Scholar]
- Dahmann D, Bauer HD, Stoyke G. Retrospective exposure assessment for respirable and inhalable dust, crystalline silica and arsenic in the former German uranium mines of SAG/SDAG Wismut. Int Arch Occup Environ Health. 2008a;81:949–58. doi: 10.1007/s00420-007-0287-8. [DOI] [PubMed] [Google Scholar]
- Dahmann D, Taeger D, Kappler M, et al. Assessment of exposure in epidemiological studies: the example of silica dust. J Expo Sci Environ Epidemiol. 2008b;18:452–61. doi: 10.1038/sj.jes.7500636. [DOI] [PubMed] [Google Scholar]
- Elihn K, Berg P. Ultrafine particle characteristics in seven industrial plants. Ann Occup Hyg. 2009;53:475–84. doi: 10.1093/annhyg/mep033. [DOI] [PubMed] [Google Scholar]
- Federal Institute for Occupational Safety and Health (BAuA) TRGS 900 Arbeitsplatzgrenzwerte. BAuA. 2006. Available at http://www.baua.de/nn_16806/de/Themen-von-A-Z/Gefahrstoffe/TRGS/pdf/TRGS-900.pdf. Accessed 22 December 2011. [Google Scholar]
- Fiore SR. Reducing exposure to hexavalent chromium in welding fumes. Welding J. 2008;85:38–42. [Google Scholar]
- Flynn MR, Susi P. Manganese, iron, and total particulate exposures to welders. J Occup Environ Hyg. 2010;7:115–26. doi: 10.1080/15459620903454600. [DOI] [PubMed] [Google Scholar]
- Gabriel S, Koppisch D, Range D. The MGU—a monitoring system for the collection and documentation of valid workplace exposure data. Gefahrstoffe - Reinhaltung der Luft- Air Quality Control. 2010;70:43–9. [Google Scholar]
- Goller JW, Paik NW. A comparison of iron oxide fume inside and outside of welding helmets. Am Ind Hyg Assoc J. 1985;46:89–93. doi: 10.1080/15298668591394455. [DOI] [PubMed] [Google Scholar]
- Hahn J-U. Aufarbeitungsverfahren zur Analytik metallhaltiger Stäube. IFA-Arbeitsmappe digital. 2005 Available at http://www.ifa-arbeitsmappedigital.de/6015. Accessed 16 June 2011. [Google Scholar]
- Harel O. The estimation of R2 and adjusted R2 in incomplete data sets using multiple imputation. J Appl Stat. 2009;36:1109–18. [Google Scholar]
- Harris MK, Ewing WM, Longo W, et al. Manganese exposures during shielded metal arc welding (SMAW) in an enclosed space. J Occup Environ Hyg. 2005;2:375–82. doi: 10.1080/15459620591007736. [DOI] [PubMed] [Google Scholar]
- Hebisch R, Fricke H-H, Hahn J-U, et al. Sampling and determining aerosols and their chemical compounds. In: Parlar H, Greim H, editors. The MAK collection for occupational health and safety, part III. Air monitoring methods. Weinheim, Germany: Wiley-VCH; 2005. [Google Scholar]
- Helsel DR. Fabricating data: how substituting values for nondetects can ruin results, and what can be done about it. Chemosphere. 2006;65:2434–9. doi: 10.1016/j.chemosphere.2006.04.051. [DOI] [PubMed] [Google Scholar]
- Hewitt PJ. Strategies for risk assessment and control in welding: challenges for developing countries. Ann Occup Hyg. 2001;45:295–8. [PubMed] [Google Scholar]
- Hobson A, Seixas N, Sterling D, et al. Estimation of particulate mass and manganese exposure levels among welders. Ann Occup Hyg. 2011;55:113–25. doi: 10.1093/annhyg/meq069. [DOI] [PMC free article] [PubMed] [Google Scholar]
- IARC. Monographs on evaluation of carcinogenic risks to humans. Vol. 49: Chromium, nickel and welding. Lyon, France: IARC Press; 1990. [PMC free article] [PubMed] [Google Scholar]
- ISO Monograph. Workplace atmospheres—ultrafine, nanoparticle and nano-structured aerosols—inhalation exposure characterization and assessment. Geneva, Switzerland: International Organization for Standardization; 2006. [Google Scholar]
- Kenny LC, Aitken R, Chalmers C, et al. A collaborative European study of personal inhalable aerosol sampler performance. Ann Occup Hyg. 1997;41:135–53. doi: 10.1016/S0003-4878(96)00034-8. [DOI] [PubMed] [Google Scholar]
- Kiefer M, Trout D, Wallace ME. Health Hazard Evaluation Avondale Shipyards, Avondale Louisiana. National Institute for Occupational Safety and Health; 1998. Available at http://www.cdc.gov/niosh/hhe/reports/pdfs/1997-0260-2716.pdf. Accessed 15 November 2011. [Google Scholar]
- Moehlmann C. Simultane personenbezogene Probenahme der E- und A-Fraktionen in Schweißrauchen. Institut für Arbeitsschutz der Deutschen Gesetzlichen Unfallversicherung (IFA) 2006. Available at http://www.ifa-arbeitsmappedigital.de/3025. Accessed 16 June 2011. [Google Scholar]
- Moehlmann C. Ultrafeine (Aerosol)- Teilchen und deren Agglomerate und Aggregate. Institut für Arbeitsschutz der Deutschen Gesetzlichen Unfallversicherung (IFA) 2007. Available at http://www.ifa-arbeitsmappedigital.de/did/00041205/redirect/301/inhalt.html. Accessed 16 June 2011. [Google Scholar]
- Myers WR, Peach MJ. Performance measurements on a powered air-purifying respirator made during actual field use in a silica bagging operation. Ann Occup Hyg. 1983;27:251–9. doi: 10.1093/annhyg/27.3.251. [DOI] [PubMed] [Google Scholar]
- OSHA. Occupational safety and health guideline for welding fumes. Occupational Safety and Health Administration; 1997. Available at http://www.osha.gov/SLTC/healthguidelines/weldingfumes/recognition.html. Accessed 30 March 2011. [Google Scholar]
- Pelzer J, Lehnert M, Lotz A, et al. Messungen der Anzahlkonzentration feiner und ultrafeiner Partikel im Schweißrauch. Vergleich mit gravimetrisch ermittelten Massekonzentrationen im Rahmen des WELDOX-Projekts. Gefahrst Reinhalt L. 2011;71:389. [Google Scholar]
- Pesch B, Weiss T, Kendzia B, et al. Levels and predictors of airborne and internal exposure to manganese and iron among welders. J Expo Sci Environ Epidemiol. 2012 doi: 10.1038/jes.2012.9. in press. doi:10.1038/jes.2012.9. [DOI] [PubMed] [Google Scholar]
- Rubin DB. Multiple imputation for nonresponse in surveys. New York: Wiley & Sons; 1987. pp. 1–320. [Google Scholar]
- Seixas NS, Heyer NJ, Welp EAE, et al. Quantification of historical dust exposures in the diatomaceous earth industry. Ann Occup Hyg. 1997;41:591–604. doi: 10.1016/S0003-4878(97)00009-4. [DOI] [PubMed] [Google Scholar]
- Stamm R. MEGA-database: one million data since 1972. Appl Occup Environ Hyg. 2001;16:159–63. doi: 10.1080/104732201460262. [DOI] [PubMed] [Google Scholar]
- Tobin J. Estimation of relationship for limited dependent variables. Econometrica. 1958;26:24–36. [Google Scholar]
- Wurzelbacher SJ, Hudock SD, Johnston OE, et al. A pilot study on the effects of two ventilation methods on weld fume exposures in a shipyard confined space welding task. Appl Occup Environ Hyg. 2002;17:735–40. doi: 10.1080/10473220290096069. [DOI] [PubMed] [Google Scholar]
- Zimmer AT. The influence of metallurgy on the formation of welding aerosols. J Environ Monit. 2002;4:628–32. doi: 10.1039/b202337g. [DOI] [PubMed] [Google Scholar]