

Abstract
OBJECTIVE:
To determine whether the interpregnancy interval (IPI) is associated with the risk of autism in subsequent births.
METHODS:
Pairs of first- and second-born singleton full siblings were identified from all California births that occurred from 1992 to 2002 using birth records, and autism diagnoses were identified by using linked records of the California Department of Developmental Services. IPI was calculated as the time interval between birth dates minus the gestational age of the second sibling. In the primary analysis, logistic regression models were used to determine whether odds of autism in second-born children varied according to IPI. To address potential confounding by unmeasured family-level factors, a case-sibling control analysis determined whether affected sibling (first versus second) varied with IPI.
RESULTS:
An inverse association between IPI and odds of autism among 662 730 second-born children was observed. In particular, IPIs of <12, 12 to 23, and 24 to 35 months were associated with odds ratios (95% confidence intervals) for autism of 3.39 (3.00–3.82), 1.86 (1.65–2.10), and 1.26 (1.10–1.45) relative to IPIs of ≥36 months. The association was not mediated by preterm birth or low birth weight and persisted across categories of sociodemographic characteristics, with some attenuation in the oldest and youngest parents. Second-born children were at increased risk of autism relative to their firstborn siblings only in pairs with short IPIs.
CONCLUSIONS:
These results suggest that children born after shorter intervals between pregnancies are at increased risk of developing autism; the highest risk was associated with pregnancies spaced <1 year apart.
Keywords: autism, IPI, birth intervals, siblings, California
WHAT'S KNOWN ON THIS SUBJECT:
Autism has been associated with pregnancy and birth complications that may indicate a suboptimal prenatal environment. Although the interpregnancy interval (IPI) may affect the prenatal environment, the association between the IPI and risk for autism is not known.
WHAT THIS STUDY ADDS:
Using full-sibling pairs from a large population, the authors examined the association between autism and IPIs. Second-born children conceived after an IPI of <12 months had more than threefold increased odds of autism relative to those with IPIs of ≥36 months.
The probability that environmental factors,1 in concert with genetics, are involved in the etiology of autism holds promise for the identification of modifiable risk factors for the disorder. Maternal physiology comprises, to a large extent, the fetal environment, and previous studies have found associations between autism and obstetric and perinatal complications implicating that environment, including low birth weight, prematurity, and indicators of hypoxic conditions (reviewed in refs 2 and 3). Although the numerous studies cited in these reviews have focused on prenatal and perinatal factors, the preconceptional factors shaping the fetal environment have received less attention. For women who have undergone a previous birth, the interpregnancy interval (IPI) may affect physiologic parameters at the beginning of subsequent pregnancies.
Understanding the association between IPIs and risk for autism may shed light on the mechanisms or exposures related to risk, as has occurred for other outcomes. For instance, the association of short IPIs with adverse outcomes, including preterm birth, low birth weight, and being small for gestational age (which are also associated with long IPIs),4,5 suggested nutritional depletion (folate, in particular)6–8 as a potential mechanism, whereas the association of long intervals with preeclampsia and eclampsia9 suggested that cardiovascular adaptation10 could be at play. A precedent for an association between short IPIs and the development of neuropsychiatric disorders exists with schizophrenia.11 The relationship between IPIs and risk for autism, however, has not, to our knowledge, been specifically examined.
In this study we examined the association between IPIs and autism by using pairs of first- and second-born full-sibling singleton births identified in a large California population. We first determined that the risk of autism in second-born siblings varies according to IPI preceding conception while controlling for a range of potential confounders. We then applied a matched case-sibling control design in a subset of pairs to control for unmeasured family-level factors, including parental genetic background.
METHODS
Population
Information on all births occurring in California from 1992 through 2002 was obtained from California's Birth Master Files. Full siblings were identified by exact matching their mother's date of birth, father's date of birth, and a variable representing the first letter of the mother's maiden name (altered for protection of identity). We identified pairs of first- and second-born singleton full siblings, excluding those in infant death files or where the sequence of birth dates was not concordant with sequence of reported maternal parity. This resulted in the identification of 725 987 sibling pairs. For 96.3% of these pairs, we were able to match the first sibling's birth date to the month and year of last birth from the second sibling's record. Sensitivity analyses using this restricted sample yielded similar results and are not presented. A total of 5861 of these pairs included 1 case subject with autism (as defined below) and 1 control subject; 306 pairs included 2 case subjects.
Variables obtained from the Birth Master Files included maternal age, parity, education, race/ethnicity, location of birth, and payment source; the child's sex, birth date, and gestational age; and paternal age. For each sibling pair, the IPI was calculated as the number of days elapsed between the date of the first birth and the second, minus the gestational age of the second infant. Where gestational age was missing (4.4%) or recorded values were <20 weeks (0.04%) or >44 weeks (2.6%), pairs were excluded. Where a negative IPI was the result (n = 33), pairs were also excluded.
Diagnosis of autism was identified using case files of the Department of Developmental Services (DDS). The DDS provides services to people with autism and other developmental disabilities, such as mental retardation, epilepsy, and cerebral palsy; other autism spectrum disorders, including Asperger syndrome and pervasive developmental disorders not otherwise specified alone do not qualify someone for services. It has previously been estimated that the DDS system includes 75% to 80% of children with autism in the state.12 Clients with a DDS code of 1 (“autism, full syndrome”) or 2 (“autism, residual state”) in the DDS electronic file at any time point, indicating that they at some point met diagnostic criteria for autism, were considered as case subjects for this study.
Statistical Analysis
Distribution of IPIs was compared graphically by case status within the pair. Two sets of statistical analyses were then conducted as described below: a primary analysis using logistic regression models and a secondary case-sibling control analysis using conditional logistic regression.
Logistic regression models were used to examine the pattern of association between IPIs and autism among second-born children. Children who had a firstborn sibling diagnosed with autism were excluded to avoid bias that could occur if autism in a first child affected subsequent childbearing. This might be more likely among families with longer IPIs who have more time to observe a first child before conceiving the second. Frequency of case and control subjects and crude and adjusted odds ratios (ORs) were calculated for 12-month strata of IPIs. Observations with IPIs of ≥84 months were collapsed into 1 category to avoid having any stratum with fewer than 5 case subjects. Covariates in the adjusted model included sex, birth year, parental ages (linear terms; use of categorical terms did not meaningfully alter estimates), maternal education (<12, 12, 13–16, or >16 years of education), ethnicity (non-Hispanic white, Hispanic, black, or other), birthplace (California, Mexico, or other), and using Medi-Cal (California's Medicare system) as payment source for delivery (yes/no). To further explore the shape of the association between IPIs and autism, a model was fit representing IPIs by indicator variables for 3-month intervals (0–2 months, 3–5 months, etc) up to >60 months, and results were plotted graphically.
On the basis of these analyses, a reduced model was selected with indicator variables for IPIs <12 months, 12 to 23 months, and 24 to 35 months, with IPIs of ≥36 months as the referent. To test whether the effect of IPIs was mediated through preterm birth or low birth weight, these variables were added to the model and coefficients were examined for attenuation. Because our definition of IPI was on the basis of live-birth deliveries, an analysis was restricted to pairs with no report of previous pregnancy loss. Children born in earlier years had a longer time to receive a diagnosis. Because the majority of children with autism in this population who were born in 2002 would have received a diagnosis by 2006, we included births through 2002 in the primary analysis. Nonetheless, we fit a model including only births in the year 2000 or earlier and restricting the case definition to those diagnosed by the age of 6 years. To explore potential heterogeneity in measures of association, analyses were conducted stratifying by each covariate. A test for linear trend was conducted for each model by including an ordinal term for IPI category, and a Wald χ2 statistic was used to test for heterogeneity in ORs across strata.13
To account for the potential of uncontrolled confounding by family-level factors associated with both IPIs and autism, we additionally conducted a case-sibling control analysis using conditional logistic regression for sibling pairs with 1 affected and 1 unaffected member. This method capitalizes on the fact that IPIs vary only for the second-born sibling. In each pair, either the first- or the second-born sibling is affected. If there is no direct effect of IPI on the risk for autism, then although families with shorter IPIs may have higher rates of autism overall, no specific association with birth order in those families would be expected. If a true effect of IPIs exists, we would expect to observe it among second-born siblings. Therefore, we computed within-family estimates for the association between birth order (second- versus firstborn) and autism according to IPI. Models included product terms between birth order and IPI variables. IPIs were parameterized using indicator variables, and covariates included the child's sex and birth year, maternal and paternal ages as categorical variables, maternal education, and Medi-Cal use. Maternal race and birthplace were omitted because they do not vary at the family level.
RESULTS
The cumulative distribution of IPIs is shown in Fig 1. In full-sibling pairs in which neither was diagnosed with autism, 23% had IPIs of <12 months, and the median IPI was 20.8 months. IPIs were shorter among pairs with autism diagnoses; the median IPI was 19.2 months in cases where the case subject was firstborn and 15.0 months in cases where the case subject was second born. The logistic regression analyses below included the second-born siblings from the pairs with no case subjects (“controls”) and pairs with 1 case subject who was second born (“cases”). The case-sibling control analyses included all pairs with 1 case subject who was either first or second born.
FIGURE 1.
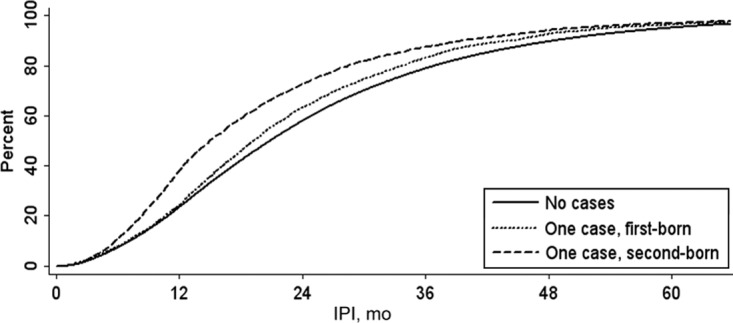
Cumulative distribution of the IPIs for full-sibling pairs with 0 or 1 autism case subjects, among California singleton births, 1992–2002. Autism diagnoses were identified by using records of the California DDS.
Association Between IPIs and Autism in Second-Born Siblings
A total of 662 730 sibling pairs were identified in which the firstborn child was not diagnosed with autism, and complete information was available on IPIs and covariates. Table 1 shows the distribution of IPIs in 12-month intervals, by case status of the second child. Unadjusted odds of autism were 3.06, 1.91, and 1.35 times greater in children born after IPIs of <12, 12 to 23, and 24 to 35 months, respectively, relative to those born after IPIs of 48 to 59 months. Among control subjects, shorter IPIs were associated with several factors also associated with a lower risk of autism, such as younger parental ages, lower maternal education, Medi-Cal enrollment, and earlier birth year. Adjusting for covariates strengthened the magnitude of the IPI–autism association, particularly for IPIs of <12 months (OR: 3.82 [95% confidence interval (CI): 3.07–4.74]). ORs for IPI categories of ≥36 months did not differ significantly from 1.0 or from each other. A consistent pattern of association was observed with finer time intervals (Fig 2).
TABLE 1.
Frequency and ORs of California DDS Autism Classification by IPI Preceding Conception, Among Second-Born Singletons From Full-Sibling Pairs Born Between 1992 and 2002 in California, Where First Child Was Not Diagnosed With Autism
| IPI, mo | Control Subjects, n (%) | Case Subjects, n (%) | Crude OR (95% CI) | Adjusted OR (95% CI)a |
|---|---|---|---|---|
| <12 | 154 846 (23.5) | 1188 (37.9) | 3.06 (2.47–3.78) | 3.82 (3.07–4.74) |
| 12–23 | 227 646 (34.5) | 1090 (34.7) | 1.91 (1.54–2.36) | 2.10 (1.69–2.61) |
| 24–35 | 138 244 (21.0) | 469 (15.0) | 1.35 (1.08–1.69) | 1.42 (1.14–1.79) |
| 36–47 | 70 858 (10.7) | 209 (6.7) | 1.17 (0.92–1.50) | 1.21 (0.94–1.54) |
| 48–59 | 36 242 (5.5) | 91 (2.9) | 1.00 | 1.00 |
| 60–71 | 17 850 (2.7) | 51 (1.6) | 1.14 (0.81–1.60) | 1.12 (0.79–1.57) |
| 72–83 | 8360 (1.3) | —b | —b | 1.11 (0.71–1.74) |
| >84 | 5547 (0.8) | —b | —b | 1.01 (0.58–1.75) |
| Total | 659 593 (100) | 3137 (100) | — | — |
Adjusted for the child's sex and birth year; maternal and paternal ages; maternal education, race, and birth place; and Medi-Cal as payment source for delivery.
Data intentionally omitted due to small cell counts. Total count across both strata, n = 39.
FIGURE 2.
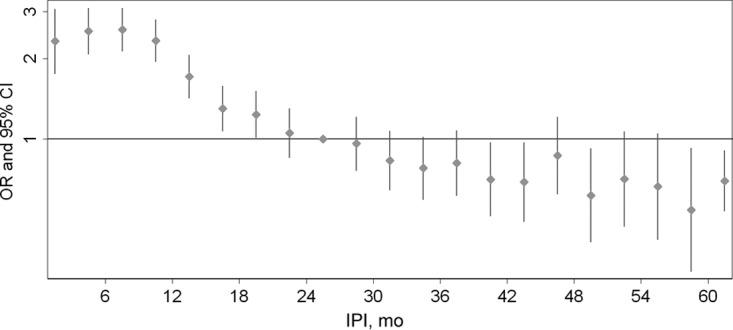
ORs and 95% CIs for autism according to IPI preceding conception, among 662 730 second-born singletons from full-sibling pairs born between 1992 and 2002 in California, where the first child was not diagnosed with autism. Calculated using logistic regression models adjusted for sex, birth year, parental ages, maternal education, ethnicity, birth place and Medi-Cal use. IPIs were modeled using indicator variables for 3-month intervals. Autism diagnoses were identified using records of the California DDS.
Because there was no significant variation in ORs for IPIs of ≥36 months, these categories were condensed, and a reduced model was fit with indicator variables for IPIs of <12 months, 12 to 23 months, and 24 to 35 months, with IPIs of ≥36 months as the referent. In this model, IPIs of <12 months were associated with a more than threefold elevated odds of autism (OR: 3.39 [95% CI: 3.00–3.82]) after adjusting for covariates (Table 2). The ORs for IPIs of 12 to 23 and 24 to 36 months were also statistically significant at 1.86 and 1.26, respectively. Both preterm birth and low birth weight were significantly associated with IPIs of <12 months (χ2 P < .001); however, there was no evidence that the IPI–autism association was mediated by these factors (Table 2). Excluding observations with a reported history of maternal pregnancy loss or termination resulted in similar OR estimates (Table 2). When births after 2000 were excluded and the case definition was restricted to diagnosis by the age of 6 years to ensure equivalent follow-up time for all case subjects, results were similar; however, the OR for IPIs of 24 to 36 months was not statistically significant (Table 2).
TABLE 2.
Sensitivity Analysis for Association Between California DDS Autism Classification and IPI Preceding Conception in Second-Born Singletons From Full-Sibling Pairs Born Between 1992 and 2002 in California, Where the First Child Was Not Diagnosed With Autism
| IPI, mo | Full Sample, Adjusted OR (95% CI)a | No Reported Terminations, Adjusted OR (95% CI)b | Autism Diagnosis by 6 y of Age, Adjusted OR (95% CI)c | ||
|---|---|---|---|---|---|
| IPI < 12, mo | 3.39 (3.00–3.82) | 3.39 (3.00–3.82) | 3.39 (3.00–3.82) | 3.43 (2.99–3.93) | 3.46 (2.97–4.04) |
| IPI 12–23, mo | 1.86 (1.65–2.10) | 1.86 (1.66–2.10) | 1.87 (1.66–2.10) | 1.87 (1.64–2.14) | 1.80 (1.54–2.10) |
| IPI 24–35, mo | 1.26 (1.10–1.45) | 1.26 (1.10–1.45) | 1.27 (1.10–1.45) | 1.32 (1.13–1.54) | 1.16 (0.98–1.39) |
| ≥36, mo | 1.00 | 1.00 | 1.00 | 1.00 | 1.0 |
| Birth weight < 2500 g | — | 1.09 (0.89–1.33) | — | — | — |
| Preterm birth | — | — | 1.20 (1.06–1.36) | — | — |
All models were adjusted for the child's sex and birth year; maternal and paternal ages; maternal education, race, and birth place; and Medi-Cal as payment source for delivery.
Analyses included full sample of 662 730 births.
Analysis included 544 084 births to women with no reported history of spontaneous or induced terminations of pregnancy.
Analysis included 494 925 births in the year 2000 or earlier, classifying as case subjects only children who received a DDS diagnosis of autism by their sixth birthday.
Stratified analyses (Table 3) revealed an inverse association between IPI and odds of autism within all categories. Tests of linear trend were highly significant (P < .01) in all strata except for paternal age younger than 20 years, which included relatively few observations. Significant heterogeneity was observed in OR estimates for IPIs of <12 months for maternal and paternal ages. For both maternal and paternal age, the highest ORs appeared in the 25- to 29-year strata; the smallest ORs appeared among the youngest and oldest parents. Marginally significant heterogeneity was also observed according to maternal race and according to Medi-Cal enrollment.
TABLE 3.
Odds of California DDS Autism Classification by IPI Preceding Conception, Among Second-Born Singletons From Full-Sibling Pairs Born Between 1992 and 2002 in California, Where the First Child Was Not Diagnosed With Autism, Stratified According to Sociodemographic and Case Characteristics
| Stratum-Specific Adjusted OR (95% CI) |
||||
|---|---|---|---|---|
| IPI, <12 mo | IPI, 12–23 mo | IPI, 24–35 mo | IPI, ≥36 mo | |
| All observations | 3.39 (3.00–3.82) | 1.86 (1.65–2.10) | 1.26 (1.10–1.45) | 1.00 |
| Child sex | ||||
| Male | 3.33 (2.92–3.80) | 1.82 (1.60–2.07) | 1.24 (1.07–1.44) | 1.00 |
| Female | 3.71 (2.74–5.02) | 2.10 (1.56–2.83) | 1.37 (0.98–1.93) | 1.00 |
| Phet | .52 | — | — | — |
| Birth year | ||||
| 1993–1996 | 2.47 (1.70–3.60) | 1.40 (0.96–2.03) | 0.86 (0.57–1.28) | 1.00 |
| 1997–1999 | 3.77 (3.12–4.56) | 2.03 (1.68–2.46) | 1.44 (1.16–1.78) | 1.00 |
| 2000–2002 | 3.24 (2.71–3.88) | 1.76 (1.47–2.10) | 1.22 (1.00–1.50) | 1.00 |
| Phet | .13 | — | — | — |
| Maternal age, y | ||||
| <20 | 3.16 (0.99–10.1) | 2.47 (0.77–7.98) | 1.41 (0.39–5.08) | 1.00 |
| 20–24 | 3.95 (2.93–5.32) | 2.17 (1.60–2.94) | 1.32 (0.93–1.87) | 1.00 |
| 25–29 | 4.25 (3.36–5.37) | 2.34 (1.85–2.95) | 1.37 (1.05–1.80) | 1.00 |
| 30–34 | 3.34 (2.70–4.14) | 1.65 (1.34–2.04) | 1.23 (0.97–1.56) | 1.00 |
| ≥35 | 2.46 (1.87–3.23) | 1.49 (1.16–1.92) | 1.20 (0.91–1.59) | 1.00 |
| Phet | .04 | — | — | — |
| Paternal age, y | ||||
| <20 | 2.03 (0.27–15.2) | 1.72 (0.23–13.1) | 1.30 (0.14–11.8) | 1.00 |
| 20–24 | 3.75 (2.44–5.79) | 1.99 (1.28–3.10) | 1.37 (0.83–2.25) | 1.00 |
| 25–29 | 4.32 (3.36–5.56) | 2.37 (1.84–3.05) | 1.38 (1.03–1.86) | 1.00 |
| 30–34 | 3.37 (2.70–4.21) | 1.73 (1.39–2.16) | 1.31 (1.02–1.67) | 1.00 |
| 35–39 | 3.72 (2.87–4.81) | 2.02 (1.57–2.60) | 1.43 (1.08–1.90) | 1.00 |
| ≥40 | 1.89 (1.37–2.61) | 1.33 (0.99–1.79) | 0.83 (0.58–1.19) | 1.00 |
| Phet | .00 | — | — | — |
| Maternal education, y | ||||
| <12 | 3.12 (2.21–4.40) | 2.63 (1.88–3.67) | 1.44 (0.96–2.14) | 1.00 |
| 12 | 4.03 (3.18–5.12) | 2.33 (1.83–2.96) | 1.37 (1.04–1.80) | 1.00 |
| 13–16 | 3.34 (2.80–3.99) | 1.71 (1.44–2.04) | 1.16 (0.95–1.42) | 1.00 |
| >16 | 2.94 (2.16–3.99) | 1.37 (1.02–1.85) | 1.27 (0.92–1.76) | 1.00 |
| Phet | .37 | — | — | — |
| Maternal race | ||||
| White | 2.94 (2.42–3.56) | 1.45 (1.21–1.76) | 1.14 (0.92–1.41) | 1.00 |
| Hispanic | 4.02 (3.29–4.91) | 2.41 (1.97–2.95) | 1.25 (0.98–1.59) | 1.00 |
| Black | 2.34 (1.33–4.09) | 1.76 (1.02–3.03) | 1.64 (0.91–2.96) | 1.00 |
| Other | 3.51 (2.68–4.60) | 2.01 (1.54–2.63) | 1.39 (1.02–1.88) | 1.00 |
| Phet | .08 | — | — | — |
| Mother's birth place | ||||
| California | 3.27 (2.77–3.85) | 1.64 (1.40–1.93) | 1.21 (1.01–1.45) | 1.00 |
| Mexico | 4.45 (3.34–5.93) | 2.80 (2.10–3.73) | 1.41 (1.00–1.99) | 1.00 |
| Other | 3.06 (2.44–3.84) | 1.91 (1.52–2.38) | 1.26 (0.97–1.63) | 1.00 |
| Phet | .11 | — | — | — |
| Medi-Cal | ||||
| Yes | 2.75 (2.11–3.59) | 2.21 (1.69–2.87) | 1.28 (0.94–1.75) | 1.00 |
| No | 3.63 (3.17–4.15) | 1.80 (1.58–2.06) | 1.27 (1.09–1.48) | 1.00 |
| Phet | .07 | — | — | — |
Phet, P value for test of heterogeneity. All models in were adjusted for child's sex and birth year; maternal and paternal ages; maternal education, race, and birth place; and Medi-Cal as payment source for delivery.
Case-Sibling Control Analysis
A total of 5327 full-sibling pairs with complete data on IPIs and covariates were identified in which 1 of 2 siblings had received a DDS autism diagnosis. ORs and 95% CIs for autism in the second-born compared with the firstborn sibling, according to IPI, are plotted in Fig 3. This figure shows that for short IPIs of <12 months, second-born siblings are at an increased risk of autism relative to their firstborn siblings. For IPIs of 3 to 5 months, 6 to 8 months, and 9 to 11 months, the ORs are statistically significant (ORs [95% CIs]: 2.03 [1.51–1.83], 2.28 [1.71–3.05], and 2.13 [1.56–2.89], respectively). ORs then show a pattern of decline through IPIs of 18 to 20 months; however, CIs are wide and include 1.0, indicating that at higher IPIs, second-born children are not at significantly greater risk of autism relative to their firstborn siblings.
FIGURE 3.
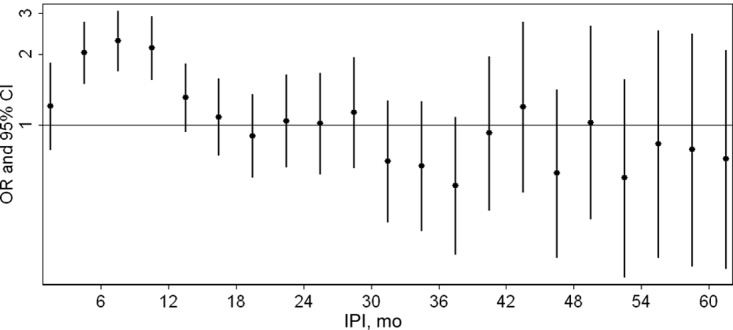
ORs and 95% CIs for the association of autism and birth order (second versus first) according to IPI among 5327 singleton full-sibling pairs born in California between 1992 and 2002. Model adjusted for the child's sex, birth year, maternal and paternal ages (categorical variables), Medi-Cal use, and maternal education. Autism diagnoses were identified using records of the California DDS.
DISCUSSION
This study provides evidence that IPIs of <24 months are associated with increased odds of autism in second-born children. Using pairs of full-sibling singleton births drawn from a large California population, we found an inverse association between autism and IPIs, with the greatest risk occurring for IPIs of <12 months. The association was not mediated by preterm birth or low birth weight and persisted across categories of sociodemographic characteristics, with some attenuation in the oldest and youngest parents. A case-sibling control analysis additionally suggests that although confounding by family-level factors may be present, it does not entirely account for the association, particularly for IPIs of <12 months. To our knowledge, this is the first study to specifically address the association between IPIs and autism risk.
One possible explanation for this association is some alteration of maternal physiology associated with IPI. The association of short IPIs with adverse pregnancy outcomes including low birth weight and preterm birth has been investigated previously, with maternal nutritional depletion, in particular of folate, representing a leading hypothesis.8 Folate is required during pregnancy for DNA synthesis and cell division. Without supplementation, serum and erythrocyte levels decrease from midpregnancy.14 O'Rourke et al15 found that erythrocyte folate levels, which are more representative of long-term status than serum levels, declined through at least 12 months postpartum. Our observation of the greatest relative odds of autism in second-born siblings in pregnancies after intervals of <1 year, with a rapid decline thereafter, is consistent with the hypothesis that folate status might also be related to autism risk. However, other possible mechanisms, such as maternal levels of iron and polyunsaturated fatty acids16 or stress17 should also be considered. Some attenuation of the IPI–autism association occurred among younger and older parents, which suggests an explanatory mechanism that is less correlated with IPIs in these groups. Dilution by greater baseline risk may also occur among children of older parents.12,18
Use of administrative records of the California DDS for identification of autism represents a strength of the study, facilitating population-based analyses over 11 years of birth records from this populous and diverse state. However, inclusion as a case subject depends on seeking services and receiving a qualifying diagnosis, with previous reports estimating that 75% to 80% of people with autism in California register with the DDS.19 This could potentially bias estimates if there was differential diagnosis with autism or use of DDS services by IPI. For example, parents of children similar in age may be more attuned to typical development and any delays in the second. In some,20,21 although not all,22 studies parents of children with autism have reported first having concerns about their child's development earlier when there was an older sibling. If this explains some of the association observed here, it may indicate a need for increased attention to developmental surveillance, especially where parents are less familiar with patterns of typical development. If this were the primary explanation for our results, we could expect a stronger effect among less severe cases, with the reasoning that more severe cases are less likely to escape diagnostic attention. Case subjects with a comorbid diagnosis of mental retardation had an OR for IPIs of <12 months of 3.51 (95% CI: 2.73–4.49) compared with 3.25 (95% CI: 2.82–3.75) for those with no recorded mental retardation diagnosis, suggesting that this is not the case. However, because a child with autism and mental retardation may not have both diagnoses in the DDS record,23 this merits additional investigation with more accurate measures of severity. Additional limitations related to the administrative nature of the data include potential errors in matching siblings and misestimation of IPIs because of incorrect reporting of gestational age. Although we took steps to minimize these sources of error, we cannot rule them out. To the extent to which such errors lead to nondifferential misclassification of IPIs, we would expect estimates to be biased toward the null. This may explain why ORs for IPIs of <6 months are lower than those between 6 and 12 months (Figs 2 and 3), if the shortest IPIs are more likely to be misclassified values.
Another concern is that autism diagnosis or symptoms in a first child may impact the decision to have a second child (“stoppage”) and that this would be more likely with longer IPIs. To avoid potential bias this would induce, we included in logistic regression analyses only subjects whose first sibling did not have an autism diagnosis; if the firstborn child does not have autism, stoppage cannot effect whether a second child is born. Our results, therefore, pertain to simplex families; whether differences would be observed in multiplex families or whether affected families in our sample later included additional children with autism is not addressed by our analyses. This approach could not be applied to the case-sibling control analysis (Fig 3), which rests on comparing diagnoses in first- versus second-born siblings. If stoppage among families with longer IPIs resulted in the observation of fewer pairs with affected firstborn children, we would expect ORs to be biased upward at longer IPIs. Because we observe elevated ORs at short, rather than long, IPIs, such a bias is unlikely to explain the results.
As in any epidemiologic study, this association could arise through uncontrolled confounding if families who tend to have shorter IPIs are also at greater risk of autism for other reasons (ie, parental genetic or hormonal factors or social influence on both autism diagnosis and decisions regarding family structure). We were able to analytically address family-level confounders (those to which all siblings within a family are equally exposed). If an unmeasured family-level factor associated with short IPIs and risk for autism was primarily responsible for the observed association, we would expect equal risk in first- and second-born children, because they are equally exposed. The fact that instead we see second-born siblings at disproportionately greater risk for short IPIs indicates that this is not the case. On the other hand, we cannot rule out confounding by unmeasured individual-level factors that vary between children within families. Social24 and environmental25,26 exposures have been associated with autism diagnosis in this population and may vary between children in families who move. However, we have no specific reason to believe that these are causally associated with IPIs.
Only first- and second-born children were included in this study. IPI as a preconceptional “exposure” is defined only for the second children; however, it may be correlated with measures that are relevant for all children or may serve as a marker at the family level of unmeasured factors associated with autism risk. An exploratory analysis of 122 202 third-born children whose previous 2 siblings did not have autism yielded an adjusted OR of 2.09 (95% CI: 1.47–2.97) for IPIs of <12 vs ≥36 months (ORs for 12–23 and 24–35 months did not significantly differ from 1.0), which suggests that an increased risk of autism at shorter IPIs persists for later-born children.
Finally, sibling pairs were included only if they were both born in California, with the same parents, within the time window from 1992 to 2002. These results may not pertain to half-siblings or other geographic locales. If nutritional factors are involved, the association may depend, for example, on background nutritional status of the population, use of supplements, and prevalence of breastfeeding that may vary across populations. If differential recognition is involved, it may depend on medical and educational practices and general awareness among parents. We did not have the data to address these factors in the current analysis.
CONCLUSIONS
This study provides evidence of an inverse association between IPIs and autism risk, with a more than threefold elevated odds in pregnancies conceived within a year of a previous birth. This finding is particularly important given trends in birth spacing in the United States. Between 1995 and 2002, the proportion of births occurring within 24 months of a previous birth increased from 11% to 18%.27 Closely spaced births occur in some part because of unintended pregnancies but also by choice, particularly among women who delay childbearing.28,29 Therefore, additional research to confirm this association in other populations and to undercover underlying mechanisms is particularly critical.
ACKNOWLEDGMENTS
Financial support was provided by the Robert Wood Johnson Foundation Health and Society Scholars Program and the National Institutes of Health Director's Pioneer Award Program, part of the NIH Roadmap for Medical Research (grant 1 DP1 OD003635-01).
We thank Christine Fountain, Kerry Keyes, Marissa King, Soumya Mazumdar, and Ezra Susser for helpful comments on earlier versions of this article and the California Department of Developmental Services for support of the study.
All authors confirm that they meet criteria for authorship and have approved the version of the manuscript submitted.
FINANCIAL DISCLOSURE: The authors have indicated they have no personal financial relationships relevant to this article to disclose.
- IPI
- interpregnancy interval
- DDS
- Department of Developmental Services
- OR
- odds ratio
- CI
- confidence interval
REFERENCES
- 1. London EA. The environment as an etiologic factor in autism: a new direction for research. Environ Health Perspect. 2000;108(suppl 3):401–404 [DOI] [PMC free article] [PubMed] [Google Scholar]
- 2. Bilder D, Pinborough-Zimmerman J, Miller J, McMahon W. Prenatal, perinatal, and neonatal factors associated with autism spectrum disorders. Pediatrics. 2009;123(5):1293–1300 [DOI] [PubMed] [Google Scholar]
- 3. Kolevzon A, Gross R, Reichenberg A. Prenatal and perinatal risk factors for autism: a review and integration of findings. Arch Pediatr Adolesc Med. 2007;161(4):326–333 [DOI] [PubMed] [Google Scholar]
- 4. Conde-Agudelo A, Rosas-Bermudez A, Kafury-Goeta AC. Birth spacing and risk of adverse perinatal outcomes: a meta-analysis. JAMA. 2006;295(15):1809–1823 [DOI] [PubMed] [Google Scholar]
- 5. Zhu BP. Effect of interpregnancy interval on birth outcomes: findings from three recent US studies. Int J Gynaecol Obstet. 2005;89(suppl 1):S25–S33 [DOI] [PubMed] [Google Scholar]
- 6. King JC. The risk of maternal nutritional depletion and poor outcomes increases in early or closely spaced pregnancies. J Nutr. 2003;133(5 suppl 2):1732S–1736S [DOI] [PubMed] [Google Scholar]
- 7. Smits LJ, Essed GG. Short interpregnancy intervals and unfavourable pregnancy outcome: role of folate depletion. Lancet. 2001;358(9298):2074–2077 [DOI] [PubMed] [Google Scholar]
- 8. van Eijsden M, Smits LJ, van der Wal MF, Bonsel GJ. Association between short interpregnancy intervals and term birth weight: the role of folate depletion. Am J Clin Nutr. 2008;88(1):147–153 [DOI] [PubMed] [Google Scholar]
- 9. Conde-Agudelo A, Belizan JM. Maternal morbidity and mortality associated with interpregnancy interval: cross sectional study. BMJ. 2000;321(7271):1255–1259 [DOI] [PMC free article] [PubMed] [Google Scholar]
- 10. Mikolajczyk RT, Zhang J, Ford J, Grewal J. Effects of interpregnancy interval on blood pressure in consecutive pregnancies. Am J Epidemiol. 2008;168(4):422–426 [DOI] [PMC free article] [PubMed] [Google Scholar]
- 11. Smits L, Pedersen C, Mortensen P, van Os J. Association between short birth intervals and schizophrenia in the offspring. Schizophr Res. 2004;70(1):49–56 [DOI] [PubMed] [Google Scholar]
- 12. Croen LA, Grether JK, Selvin S. Descriptive epidemiology of autism in a California population: who is at risk? J Autism Dev Disord. 2002;32(3):217–224 [DOI] [PubMed] [Google Scholar]
- 13. Greenland S, Rothman KJ. Introduction to stratified analysis. In: Rothman KJ, Greenland S, Lash TL. Eds. Modern Epidemiology. 3rd ed. Philadelphia, PA: Lippincott, Williams & Wilkins; 2008:258–282 [Google Scholar]
- 14. Milman N, Byg KE, Hvas AM, Bergholt T, Eriksen L. Erythrocyte folate, plasma folate and plasma homocysteine during normal pregnancy and postpartum: a longitudinal study comprising 404 Danish women. Eur J Haematol. 2006;76(3):200–205 [DOI] [PubMed] [Google Scholar]
- 15. O'Rourke KM, Redlinger TE, Waller DK. Declining levels of erythrocyte folate during the postpartum period among Hispanic women living on the Texas-Mexico border. J Womens Health Gend Based Med. 2000;9(4):397–403 [DOI] [PubMed] [Google Scholar]
- 16. Abu-Saad K, Fraser D. Maternal nutrition and birth outcomes. Epidemiol Rev. 2010;32(1):5–25 [DOI] [PubMed] [Google Scholar]
- 17. Klerman LV, Cliver SP, Goldenberg RL. The impact of short interpregnancy intervals on pregnancy outcomes in a low-income population. Am J Public Health. 1998;88(8):1182–1185 [DOI] [PMC free article] [PubMed] [Google Scholar]
- 18. Grether JK, Anderson MC, Croen LA, Smith D, Windham GC. Risk of autism and increasing maternal and paternal age in a large north American population. Am J Epidemiol. 2009;170(9):1118–1126 [DOI] [PubMed] [Google Scholar]
- 19. Croen LA, Grether JK, Hoogstrate J, Selvin S. The changing prevalence of autism in California. J Autism Dev Disord. 2002;32(3):207–215 [DOI] [PubMed] [Google Scholar]
- 20. De Giacomo A, Fombonne E. Parental recognition of developmental abnormalities in autism. Eur Child Adolesc Psychiatry. 1998;7(3):131–136 [DOI] [PubMed] [Google Scholar]
- 21. Siperstein R, Volkmar F. Brief report: parental reporting of regression in children with pervasive developmental disorders. J Autism Dev Disord. 2004;34(6):731–734 [DOI] [PubMed] [Google Scholar]
- 22. Chawarska K, Paul R, Klin A, Hannigen S, Dichtel LE, Volkmar F. Parental recognition of developmental problems in toddlers with autism spectrum disorders. J Autism Dev Disord. 2007;37(1):62–72 [DOI] [PubMed] [Google Scholar]
- 23. Grether JK, Rosen NJ, Smith KS, Croen LA. Investigation of shifts in autism reporting in the California Department of Developmental Services. J Autism Dev Disord. 2009;39(10):1412–1419 [DOI] [PubMed] [Google Scholar]
- 24. Liu KY, King M, Bearman PS. Social influence and the autism epidemic. AJS. 2010;115(5):1387–1434 [DOI] [PMC free article] [PubMed] [Google Scholar]
- 25. Roberts EM, English PB, Grether JK, Windham GC, Somberg L, Wolff C. Maternal residence near agricultural pesticide applications and autism spectrum disorders among children in the California Central Valley. Environ Health Perspect. 2007;115(10):1482–1489 [DOI] [PMC free article] [PubMed] [Google Scholar]
- 26. Windham GC, Zhang L, Gunier R, Croen LA, Grether JK. Autism spectrum disorders in relation to distribution of hazardous air pollutants in the San Francisco Bay area. Environ Health Perspect. 2006;114(9):1438–1444 [DOI] [PMC free article] [PubMed] [Google Scholar]
- 27. Centers for Disease Control and Prevention, National Center for Health Statistics Data 2010: the Healthy People 2010 database (Objective: 09-02). Available at: http://wonder.cdc.gov/data2010 Accessed August 5, 2010
- 28. Kaharuza FM, Sabroe S, Basso O. Choice and chance: determinants of short interpregnancy intervals in Denmark. Acta Obstet Gynecol Scand. 2001;80(6):532–538 [PubMed] [Google Scholar]
- 29. Nabukera SK, Wingate MS, Salihu HM, et al. Pregnancy spacing among women delaying initiation of childbearing. Arch Gynecol Obstet. 2009;279(5):677–684 [DOI] [PubMed] [Google Scholar]