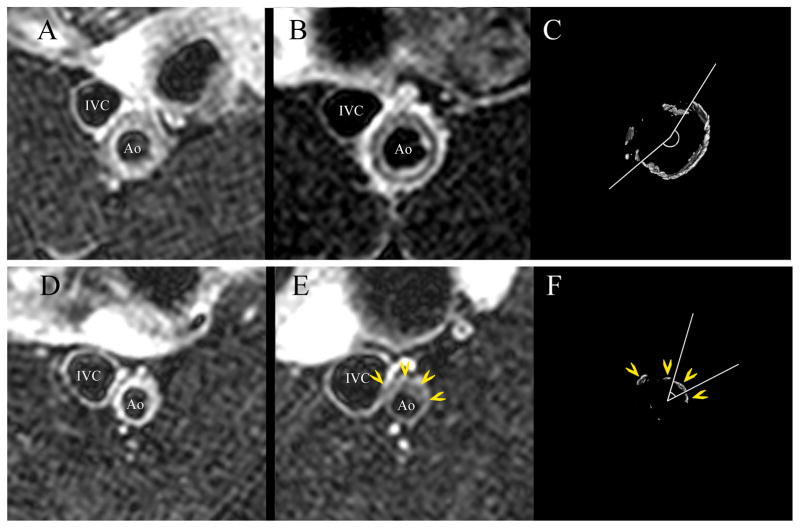
Figure 1.
Representative axial MRI and μCT images of the abdominal aorta. Raloxifene treatment (upper panels) resulted in a ring of calcification seen as low signal intensity within the vessel wall in the T2-weighted image (B) and confirmed in the matching μCT image (C). The distribution of calcification in the control OVX aortas was less organized and more nodular (E, F); yellow arrowheads identify matching calcifications. Corresponding pre-treatment MR images are seen in panels (A) and (D). The largest arc of calcification was measured for each μCT image (C, F). Ao: aorta; IVC: inferior vena cava.

