

Abstract
Objective
To empirically assess the concept that Alzheimer’s disease (AD) biomarkers significantly depart from normality in a temporally ordered manner.
Design
Validation sample
Setting
Multi-site, referral centers
Patients
We studied 401 elderly cognitively normal (CN), Mild Cognitive Impairment (MCI) and AD dementia subjects from the Alzheimer’s Disease Neuroimaging Initiative. We compared the proportions of three AD biomarkers – CSF Aβ42, CSF total tau (t-tau), and hippocampal volume adjusted by intra-cranial volume (HVa) - that were abnormal as cognitive impairment worsened. Cut-points demarcating normal vs. abnormal for each biomarker were established by maximizing diagnostic accuracy in independent autopsy samples.
Interventions
None
Main Outcome measures
AD biomarkers
Results
Within each clinical group in the entire sample (n=401) CSF Aβ42 was abnormal more often than t-tau or HVa. Among the 298 subjects with both baseline and 12 month data, the proportion of subjects with abnormal Aβ42 did not change from baseline to 12 months in any group. The proportion of subjects with abnormal t-tau increased from baseline to 12 months in CN (p=0.05) but not in MCI or dementia. In 209 subjects with abnormal CSF AB42 at baseline, the percent abnormal HVa, but not t-tau, increased from baseline to 12 months in MCI.
Conclusions
Reduction in CSF Aβ42 denotes a pathophysiological process that significantly departs from normality (i.e., becomes dynamic) early, while t-tau and HVa are biomarkers of downstream pathophysiological processes. T-tau becomes dynamic before HVa, but HVa is more dynamic in the clinically symptomatic MCI and dementia phases of the disease than t-tau.
Keywords: Alzheimer’s disease biomarkers, Magnetic Resonance Imaging, CSF tau, CSF Abeta, Alzheimer’s disease staging
Introduction
Biomarkers of Alzheimer’s disease (AD) occupy an essential place in recently formulated diagnostic criteria for AD (1–5) where their role is to identify the pathophysiological processes underlying cognitive impairment or to help predict time to dementia (6–15). AD biomarkers are also increasingly used in clinical trials both as inclusion criteria and as outcome measures.
At present five AD biomarkers are sufficiently validated to be employed in therapeutic trials, large observational research studies and, on occasion, for clinical diagnostic purposes (16–19). The major biomarkers of brain Aβ deposition are low CSF Aβ42 and positive PET amyloid imaging (20–30). Biomarkers of neuronal injury or neurodegeneration are elevated CSF total tau (t-tau) and phosphorylated tau (31–33), decreased FDG uptake on PET in temporo-parietal cortex (34–36), and atrophy on structural MRI (sMRI) in medial, basal and lateral temporal lobes, and medial parietal isocortex (37–43).
Some of the authors recently proposed a hypothetical model of Alzheimer’s pathophysiology (44, 45) describing the temporal evolution of these five biomarkers based on the assumption that they do not change suddenly or simultaneously but rather over many years in an ordered, more sequential, manner and like-wise approach a pathological level in an ordered manner. The model does not assume a strict sequence whereby one biomarker changes then stops, the next changes then stops, etc. Rather the model assumes that the maximum rate of change moves from one class of biomarker to the next, and, as the disease progresses all biomarkers become progressively more abnormal simultaneously, albeit at rates that change over time in an ordered manner. It was proposed as a hypothetical biomarker cascade with validation awaiting additional data.
Empirical testing of this hypothetical biomarker cascade model (44, 45) can be approached in various ways (46); however all require that different biomarkers be directly compared with each other in the same subjects. This can be conceptualized as plotting all biomarker values on a common graph with the vertical axis representing biomarker severity and the horizontal axis representing disease stage and/or time. Our present objective was to evaluate some aspects of the hypothetical biomarker cascade model by characterizing the prevalence of biomarker abnormalities at different disease stages defined by clinical cohort and by MMSE. Comparing the proportions of subjects with abnormal biomarker values allowed us to express significant biomarker deviations from normal in the same units for each biomarker. Cut points denoting abnormality for each biomarker were derived from independent autopsy cohorts which limited our analysis to three of the five major AD biomarkers – CSF Aβ, CSF tau, and sMRI. Our objective was to test the hypothesis that CSF Aβ, CSF tau, and sMRI significantly depart from normality in a temporally ordered manner as disease progresses.
Methods
Subjects
All Alzheimer’s Disease Neuroimaging Initiative (ADNI) subjects who had usable baseline CSF and sMRI data were considered for our analysis. We also analyzed serial (baseline and 12 month) data if both CSF and sMRI were obtained at the 12 month visit. Written informed consent was obtained for participation in these studies, as approved by the Institutional Review Board (IRB) at each of the participating centers http://www.ADNI-info.org.
CSF Methods
A standardized protocol was implemented in ADNI to quantify biomarker concentrations in each of the CSF baseline aliquots using a multiplex xMAP Luminex platform (Luminex Corp, Austin, TX) with Innogenetics (INNO-BIA AlzBio3, Ghent, Belgium) immunoassay kit-based reagents which was validated in Vanderstichele et al (47) and Shaw et al (32). Details can be found at (http://www.adni-info.org/index.php).
MRI Methods
All subjects were scanned at 1.5T with a 3D magnetization prepared rapid acquisition gradient echo (MPRAGE) imaging sequence (48). All images were corrected for image distortion due to gradient non-linearity using “GradWarp” (49), for B1 non-uniformity as necessary (48), and for residual inhomogeneity using “N3” (50) with a software pipeline running at the Mayo Clinic Rochester. Hippocampal and intracranial volumes for both the autopsy sample (see below) and the main ADNI analysis sample were measured at Mayo Clinic using FreeSurfer software (version 4.5.0) (51). Each subject’s raw hippocampal volume (HV) was adjusted by his/her total intracranial volume (HVa) (52).
Method of Defining Cut Points
In order to create a common analytic framework to compare different biomarkers we elected to define each biomarker measure as either normal or abnormal. This requires that a cut point be established in the continuous distribution of values for each biomarker. Arguably the least biased and most valid approach to establishing biomarker cut points is to use an independent cohort in which ground truth is established by autopsy. Cut points for CSF Aβ and t-tau were established by Shaw et al (32, 53) using an ADNI-independent autopsy cohort of subjects followed in the University of Pennsylvania Alzheimer’s Disease Core Center who were diagnosed by NIA-Reagan criteria (20). The cut points were chosen in order to maximize accuracy in separating high from low probability autopsy proven AD.
To our knowledge, however, cut points have not been established for hippocampal atrophy using an independent autopsy data set that employed imaging methods identical to those used in ADNI. To obtain a HVa cut point we used an independent sample of 53 subjects at the Mayo Clinic who had ante mortem MRI within 3.5 years of death and an autopsy diagnosis of high or low probability of AD using NIA-Reagan criteria. These subjects had been enrolled in the Mayo Alzheimer’s Disease Patient Registry or the Alzheimer’s Disease Research Center. Our cut point was based on first calculating an adjusted hippocampal volume using the formula HVa = HV − (2.546201 + 0.002139314 * intra-cranial volume). Here, HVa is the residual value obtained after regressing hippocampal volume versus intra-cranial volume. Next we performed a receiver operating characteristic (ROC) curve analysis and chose a cut point in order to maximize accuracy in separating high from low probability autopsy proven AD. That is, we chose the cut point to maximize Sensitivity − (1-Specificity).
Statistical Methods
Each subject had three binary outcomes for their baseline visit defined as normal (y = 0) or abnormal (y = 1) for each of the three biomarkers. Because these can be considered repeated measures data having a binary outcome, we used generalized estimating equations (GEE) with the logit link and an exchangeable working correlation matrix to estimate and compare the proportion of subjects having an abnormal biomarker. Our predictors were clinical group (CN vs. MCI vs. AD), biomarker and their interaction. We used likelihood ratio tests to perform a global test of biomarker differences after including clinical group in the model and to test for an interaction between clinical group and biomarker. We used Wald tests to perform pair-wise comparisons of abnormality of a biomarker separately within each clinical group. This analysis was then repeated replacing clinical group with MMSE, modeled as a restricted cubic spline with knots at the 10th, 50th, and 90th percentiles of the MMSE distribution. We also performed a subset analysis among those with abnormal baseline CSF Aβ and examined t-tau and HVa within group.
Among those subjects who also had a 12-month visit, we used baseline and 12-month data and fit a GEE model that included group, visit, and biomarker along with all interactions. From this model we estimate separate rates of biomarker abnormality by group, time point, and biomarker. We also performed a subset analysis among those with abnormal baseline CSF Aβ and examined within group change in t-tau and HVa from baseline to 12 months.
Results
Biomarker Cut Point Values
The cut point for defining abnormal hippocampal volume was based on a sample of 43 Mayo subjects with ante mortem sMRI and autopsy diagnoses of high-probability AD (56% women, median age at death 85 years) and 10 low probability (60% women, median age at death 85 years) (Supplementary Table S1). The optimal HVa ratio cut point value was 0.48 (Supplementary Fig. S1). With this cut point, NIA-Reagan low AD probability subjects in the MRI training sample were separated from high AD probability with a classification accuracy of 79%, sensitivity of 74%, and specificity of 100%. Overall discrimination was high with an area under the ROC curve of 0.90. Previously established CSF cut point values of Aβ42 192 pg/ml and t-tau 92 pg/ml were used to define abnormal studies (32).
Main Analysis
The main analysis of 401 ADNI subjects included 116 CN, 196 MCI, and 89 AD subjects with baseline data. In total, 298 subjects had baseline and 12 month data. The baseline age distributions varied somewhat among the three groups of subjects (ANOVA p = 0.026) and there were differences in the proportion of women that ranged from 33% of MCI to 49% of CN (Table 1). MMSE score and proportion of APOE e4 carriers varied by clinical group in the expected manner.
Table 1.
Characteristics of subjects at baseline and 12 months by baseline diagnosis
| Baseline group | ||||||
|---|---|---|---|---|---|---|
| CN | MCI | AD | ||||
| Characteristic | Baseline (n = 116) | 12 month (n = 93) | Baseline (n = 196) | 12 month (n = 146) | Baseline (n = 89) | 12 month (n = 59) |
| Number of women (%) | 57 (49) | 45 (48) | 65 (33) | 46 (32) | 37 (42) | 25 (42) |
| Number of APOE ε4 carriers (%) | 27 (23) | 22 (24) | 107 (55) | 80 (55) | 64 (72) | 46 (78) |
| Age, years | ||||||
| Median (IQR) | 76 (72, 78) | 76 (73, 79) | 75 (70, 80) | 76 (72, 81) | 77 (72, 81) | 79 (74, 82) |
| Range | 62 to 90 | 63 to 91 | 55 to 89 | 59 to 90 | 65 to 89 | 67 to 89 |
| MMSE | ||||||
| Median (IQR) | 29 (29, 30) | 29 (28, 30) | 27 (25, 28) | 27 (24, 28) | 24 (22, 25) | 23 (19, 25) |
| Range | 25 to 30 | 25 to 30 | 23 to 30 | 17 to 30 | 20 to 27 | 5 to 27 |
| Aβ1-42, pg/mL | ||||||
| Median (IQR) | 221 (157, 248) | 222 (160, 244) | 146 (129, 201) | 143 (124, 168) | 140 (119, 153) | 135 (125, 148) |
| Range | 79 to 298 | 84 to 299 | 48 to 299 | 80 to 296 | 75 to 289 | 75 to 271 |
| Number < 192 pg/mL (%) | 47 (41) | 38 (41) | 145 (74) | 114 (78) | 82 (92) | 58 (98) |
| Total tau, pg/mL | ||||||
| Median (IQR) | 63 (48, 85) | 67 (51, 95) | 87 (64, 128) | 96 (66, 139) | 115 (80, 144) | 115 (90, 146) |
| Range | 29 to 200 | 27 to 175 | 28 to 463 | 32 to 363 | 32 to 349 | 35 to 273 |
| Number > 93 pg/mL (%) | 24 (21) | 25 (27) | 88 (45) | 75 (51) | 59 (66) | 42 (71) |
| HVa | ||||||
| Median (IQR) | 1.65 (1.16, 2.19) | 1.53 (1.06, 2.16) | 0.58 (0.03, 1.33) | 0.17 (−0.41, 1.06) | −0.22 (−0.75, 0.50) | −0.65 (−1.04, 0.08) |
| Range | −0.34 to 3.50 | −0.20 to 3.94 | −1.81 to 3.81 | −2.12 to 4.00 | −2.00 to 1.94 | −2.33 to 1.64 |
| Number < 0.48 (%) | 9 (8) | 8 (9) | 87 (44) | 88 (60) | 66 (74) | 49 (83) |
Abbreviations: APOE, apolipoprotein E; IQR, inter-quartile range; ADAS-Cog, Alzheimer’s Disease Assessment Scale-Cognitive Subscale; MMSE, Mini Mental State Exam; HVa, Hippocampal Volume Adjusted for Intra-cranial Volume
For each of the three biomarkers evaluated, the median baseline group values became more abnormal (p<0.001, linear trend test) (Table 1, Fig. 1) and the percentage of subjects with abnormal biomarker studies (Table 1, Fig. 2A) increased in an ordered manner in the CN, MCI, AD groups. The same pattern held at 12 months. The percentage of subjects with abnormal biomarker studies increased monotonically for each biomarker with decreasing MMSE (Fig. 2B). A Supplement to Figure 2 shows plots of individual patient trajectories for each biomarker within clinical diagnosis.
Figure 1.

Box plots and superimposed data points showing the distribution of biomarkers by baseline diagnosis and visit. Boxes indicate the quartiles and have whiskers extending to the furthest data point within 1.5 inter-quartile ranges of the box. T-tau is shown on the log scale. In subjects with both baseline and 12 month data, CSF Aβ42 is not changing from baseline to 12 months (CN, p=0.52; MCI, p=0.13; AD, p=0.51). T-tau is increasing from baseline to 12 months in CN subjects (p=0.002) but not in MCI or AD (p=0.12, p=0.36). HVa is decreasing in all clinical groups (p<0.001).
Figure 2.
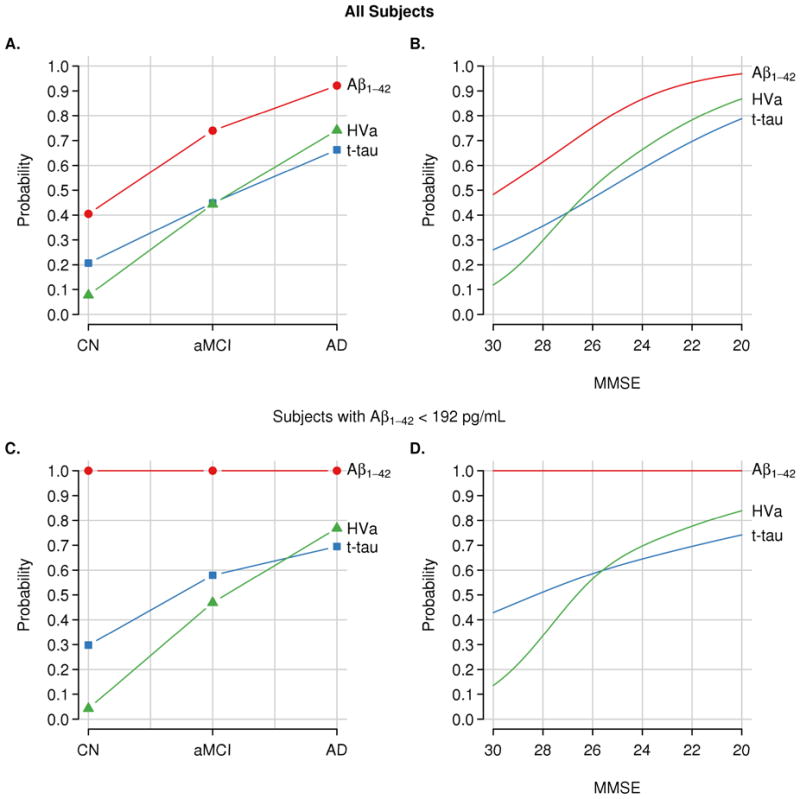
Estimated percentages of abnormality for each biomarker in all subjects (n=401) and within the subset of subjects with abnormal baseline CSF Aβ (n=274). Panels A & C show abnormality by clinical diagnosis and panels B & D show abnormality by MMSE score. Cutoffs used are 192 pg/mL for Aβ1–42, 93 for total tau, and 0.48 for HVa.
Among all 401 subjects at baseline, CSF Aβ42 was abnormal more often than t-tau or HVa in each clinical group (p<0.001 across all pair-wise tests, Table 2). The percentage of abnormal t-tau was greater than the percentage of HVa among CN (21% vs. 8%, p=0.003) but did not differ among MCI or AD dementia subjects (Table 2).
Table 2.
Proportions of abnormality between biomarkers by clinical group and P-values from pair-wise hypothesis tests comparing abnormality between two markers for a given clinical group.a
| Comparison | CN | aMCI | AD |
|---|---|---|---|
| All Subjects | |||
| Aβ1-42 vs. T-tau | 41% vs. 21% <0.001 |
74% vs. 45% <0.001 |
92% vs. 66% <0.001 |
| Aβ1-42 vs. HVa | 41% vs. 8% <0.001 |
74% vs. 44% <0.001 |
92% vs. 74% <0.001 |
| T-tau vs. HVa | 21% vs. 8% 0.003 |
45% vs. 44% 0.92 |
66% vs. 74% 0.16 |
| Subjects with baseline Aβ1-42 < 192 pg/mL | |||
| T-tau vs. HVa | 30% vs. 4% 0.003 |
58% vs. 47% 0.07 |
70% vs. 77% 0.20 |
Based on generalized estimating equations (GEE) logistic model with an exchangeable correlation structure
We performed a sub-analysis of baseline CSF t-tau and HVa among only those subjects (47 CN, 145, MCI and 82 AD) who had abnormal CSF Aβ42 values at baseline (Supplementary Table S2). The percentage of these CSF Aβ42 positive subjects with abnormal t-tau and HVa increased monotonically by clinical group in the following order, CN, MCI, AD dementia (Fig. 2C) and increased monotonically with decreasing MMSE (Fig. 2D). In this sub-analysis, t-tau was abnormal more often than HVa in CN. There was a trend for more abnormal t-tau than HVa in MCI but no difference in AD dementia (Table 2).
Among the 298 subjects with both baseline and 12 month data, the proportion of subjects with abnormal CSF Aβ42 did not change from baseline to 12 months in any diagnosis group (CN: p=0.15, MCI: p=0.15, AD: p=0.33) (Fig. 3A). The proportion of subjects with abnormal t-tau increased from baseline to 12 months in CN subjects (p=0.05) but not in MCI or AD dementia subjects (p=0.40, p>0.99) although the absolute levels of t-tau in the CN group were far lower than in the MCI group. There was no difference in the proportion of subjects with abnormal HVa in CN subjects (p>0.99) or AD dementia subjects (p=0.16) from baseline to 12 months, but a significant increase in the proportion of subjects with abnormal HVa for MCI.
Figure 3.
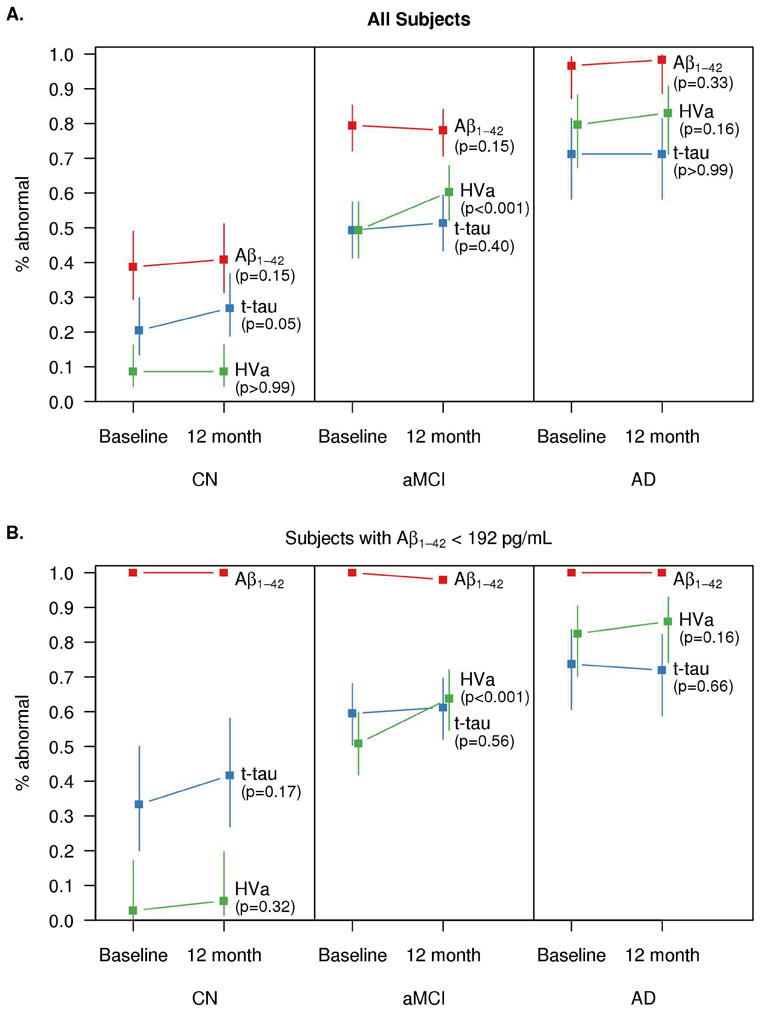
Estimated percentages of abnormality for each biomarker at baseline and 12 months by baseline clinical diagnosis for the subset of subjects with serial data (panel A, n=298) and those with serial data who were CSF Aβ positive at baseline (panel B, n=209). Values are shifted slightly along the x-axis for the middle biomarker to reduce overlap in lines. Cutoffs used are 192 pg/mL for Aβ1–42, 93 for total tau, and 0.48 for HVa.
The preceding paragraph describes the proportion of subjects by group with abnormal biomarker values at baseline and 12 months. The change in biomarker values in native units is seen in Fig 1. CSF Aβ42 did not change from baseline to 12 months in any group (p=0.52, p=0.13, p=0.51 for CN, MCI, and AD). T-tau increased in CN (p=0.002) but not in MCI or AD (p=0.12, p=0.36). HVa decreased in all groups (p<0.001).
We also performed a sub-analysis among only those subjects (n=209) who had abnormal CSF Aβ42 values at baseline and who also had both baseline and 12 month data (Fig. 3B). Neither the proportion of subjects with abnormal Aβ42 nor t-tau changed from baseline to 12 months in any diagnosis group. The proportion of subjects with abnormal HVa increased from baseline to 12 months for MCI (p<0.001) but did not differ for CN or AD dementia subjects (p=0.32, p=0.16).
Discussion
Our overall objective was to test for evidence of temporal ordering of CSF AB42, t-tau, and HVa (54, 55). We were limited to evaluating these three AD biomarkers for which independent autopsy cohorts were available to select normal/abnormal cut points in an unbiased manner. A biomarker value for an individual subject at a given point in time (and by extension, the percent abnormal across a group at a given disease stage) is a function of two phenomena: the elapsed time from the initial deviation of the biomarker away from normality to the present, and the average rate of change of the biomarker over this period of time. An analogy to motion would be distance traveled from abnormality, average rate of change, and elapsed time. Our data consisted of measures of each biomarker value at a fixed point or points in time in subjects who entered the study at different stages of the disease. We observed whether a subject had reached a certain distance from normality, but cannot individually identify the contributions from average rate of change and elapsed time. We can, however, draw valid inferences from our data about the combined effect of time elapsed from onset and average rate of change, and refer to this as relative dynamic ordering of biomarkers.
The data presented here supports several key principles in our recently proposed hypothetical biomarker cascade model (44, 45). These include: 1) all biomarkers become progressively more abnormal as subjects worsen clinically. 2) Reduction in CSF Aβ42 denotes an upstream pathophysiological process that significantly departs from normality (i.e., is dynamic) early in the pathophysiological cascade while subjects are clinically asymptomatic, but does not change greatly during the clinically symptomatic MCI and dementia phases of the disease. 3) T-tau and HVa are biomarkers of downstream neurodegenerative pathophysiological process that are dynamic later as subjects approach and move through the clinically symptomatic phases of the disease (56–64). 4) Cognitive decline is more closely related to biomarkers of neuronal injury than brain Aβ load (65–72). 5) T-tau is more dynamic earlier than HVa, but the proportion of abnormal biomarker studies are similar in symptomatic subjects such that HVa “catches up” to t-tau as symptoms worsen. This is supported visually by the steeper slope of HVa vs ttau in Fig 2.
The hypothetical model represents an idealized trajectory of an individual subject who progresses to pathologically pure AD dementia. Our sample, however, almost certainly consists of a mixture of subjects, many of whom are on the AD pathway, but many, particularly in the CN and MCI groups, who are not (73–78). The fact that both elevated t-tau and hippocampal atrophy can occur in other conditions that lead to dementia (79) such as cerebro-vascular disease has led to the belief that of the three biomarkers we examined, CSF Aβ42 should have the greatest specificity for AD (80). Consequently, we performed a sub-analysis of subjects with abnormal CSF Aβ at baseline in order to isolate those subjects who we were somewhat more confident were in the AD pathophysiological pathway (56, 81–86). Our results concerning evidence for biomarker ordering led to similar conclusions in the “all-subjects” and the abnormal CSF Aβ 42 samples.
Using the percent-abnormal metric might not seem to be an obvious first choice for comparing biomarkers. Other options however prove to be untenable. For example, using biomarker values in native measurement units precludes direct comparisons of biomarkers because they are not on a common scale. Z scores or percentiles are also not tenable since by construction half the subjects in the sample must be above and half below average for each biomarker. This constraint would make it impossible to test our major question – i.e., is one biomarker abnormal more often than another at different stages of the disease. The obvious advantage of comparing biomarkers on a percent-abnormal basis is that the scoring method is standardized for all biomarkers over the entire cognitive continuum. A limitation is that the results are highly sensitive to the cut point values and hence the validity of the analysis depends on selecting valid cut points for each biomarker. We used cut point values for each biomarker that were based on an independent autopsy verified sample, and used the same pathological criteria for all biomarkers – i.e., NIA Reagan low vs. high AD probability. While using cut points based on diagnostic sensitivity, rather than accuracy, in the autopsy reference standard might seem a better approach, that is not the case. Imagine a biomarker with identical distributions in autopsy proven high vs low probability AD. Fixing a cut point at a sensitivity of 90% in high probability autopsy proven AD would lead to the conclusion that 90% of autopsy low probability AD cases had abnormal biomarker values, and the biomarker in question comes “early” in the pathophysiological cascade. This would clearly be erroneous. Thus our choice of selecting cut points for this study in a manner that is constrained by both sensitivity and specificity, as is done for all clinically applied diagnostic tests, seems prudent.
Our hypothetical model (44, 45) was intended to represent an idealized trajectory that an individual subject follows from a time prior to appearance of any AD pathophysiology in the brain through end stage AD dementia when all biomarkers have become maximally abnormal. The optimal way to test this model would be to follow the trajectory of multiple biomarkers over several decades in a large group of subjects who enter the study prior to the first appearance of any AD pathophysiology, are followed through the symptomatic stages of the disease to autopsy. Given that the total course of the disease may span 30 years or more it will take many years to accumulate the necessary data to construct a temporally accurate disease model. While the data is being accumulated, perhaps the only realistic approach to empirical analysis is to attempt to build models of disease in a piece-wise fashion from individual subjects who are at various stages in the disease as we have done here.
Supplementary Material
Acknowledgments
Support from NIH AG11378 and ADNI. All authors had full access to all of the data in the study and take responsibility for the integrity of the data and the accuracy of the data analysis. Manuscript preparation by Samantha Wille.
Footnotes
Data used in preparation of this article were obtained from the Alzheimer’s Disease Neuroimaging Initiative (ADNI) database (adni.loni.ucla.edu). As such, the investigators within the ADNI contributed to the design and implementation of ADNI and/or provided data but did not participate in analysis or writing of this report. A complete listing of ADNI investigators can be found at: http://adni.loni.ucla.edu/wp-content/uploads/how_to_apply/ADNI_Authorship_List.pdf
References
- 1.Dubois B, Feldman HH, Jacova C, et al. Revising the definition of Alzheimer’s disease: a new lexicon. Lancet Neurol. 2010 doi: 10.1016/S1474-4422(10)70223-4. [DOI] [PubMed] [Google Scholar]
- 2.Jack CR, Jr, Albert MS, Knopman DS, et al. Introduction to the recommendations from the National Institute on Aging and the Alzheimer Association workgroup on diagnostic guidelines for Alzheimer’s disease. Alzheimers Dement. 2011 doi: 10.1016/j.jalz.2011.03.004. (Epub ahead of print) [DOI] [PMC free article] [PubMed] [Google Scholar]
- 3.McKhann GM, Knopman DS, Chertkow H, et al. The diagnosis of dementia due to Alzheimer’s disease: Recommendations from the National Institute on Aging and the Alzheimer’s Assocation Workgroup. Alzheimers Dement. 2011 doi: 10.1016/j.jalz.2011.03.005. (Epub ahead of print) [DOI] [PMC free article] [PubMed] [Google Scholar]
- 4.Sperling RA, Aisen PS, Beckett LA, et al. Toward defining the preclinical stages of Alzheimer’s disease: Recommendations from the National Institute on Aging and the Alzheimer Assocation Workgroup. Alzheimers Dement. 2011 doi: 10.1016/j.jalz.2011.03.003. (Epub ahead of print) [DOI] [PMC free article] [PubMed] [Google Scholar]
- 5.Albert MS, DeKosky ST, Dickson D, et al. The diagnosis of mild cognitive impairment due to Alzheimer’s disease: Recommendations from the National Institute on Aging and Alzheimer’s Association Workgroup. Alzheimers Dement. 2011 doi: 10.1016/j.jalz.2011.03.008. (Epub ahead of print) [DOI] [PMC free article] [PubMed] [Google Scholar]
- 6.Jack CR, Jr, Petersen RC, Xu YC, et al. Prediction of AD with MRI-based hippocampal volume in mild cognitive impairment. Neurology. 1999;52(7):1397–403. doi: 10.1212/wnl.52.7.1397. [DOI] [PMC free article] [PubMed] [Google Scholar]
- 7.Killiany RJ, Gomez-Isla T, Moss M, et al. Use of structural magnetic resonance imaging to predict who will get Alzheimer’s disease. Ann Neurol. 2000;47(4):430–9. [PubMed] [Google Scholar]
- 8.Mattsson N, Zetterberg H, Hansson O, et al. CSF biomarkers and incipient Alzheimer disease in patients with mild cognitive impairment. JAMA. 2009;302(4):385–93. doi: 10.1001/jama.2009.1064. [DOI] [PubMed] [Google Scholar]
- 9.Jagust WJ, Haan MN, Eberling JL, Wolfe N, Reed BR. Functional imaging predicts cognitive decline in Alzheimer’s disease. J Neuroimaging. 1996;6(3):156–60. doi: 10.1111/jon199663156. [DOI] [PubMed] [Google Scholar]
- 10.Visser PJ, Verhey F, Knol DL, et al. Prevalence and prognostic value of CSF markers of Alzheimer’s disease pathology in patients with subjective cognitive impairment or mild cognitive impairment in the DESCRIPA study: a prospective cohort study. Lancet Neurol. 2009;8(7):619–27. doi: 10.1016/S1474-4422(09)70139-5. [DOI] [PubMed] [Google Scholar]
- 11.Okello A, Koivunen J, Edison P, et al. Conversion of amyloid positive and negative MCI to AD over 3 years: an 11C-PIB PET study. Neurology. 2009;73(10):754–60. doi: 10.1212/WNL.0b013e3181b23564. [DOI] [PMC free article] [PubMed] [Google Scholar]
- 12.Dickerson BC, Goncharova I, Sullivan MP, et al. MRI-derived entorhinal and hippocampal atrophy in incipient and very mild Alzheimer’s disease. Neurobiol Aging. 2001;22(5):747–54. doi: 10.1016/s0197-4580(01)00271-8. [DOI] [PubMed] [Google Scholar]
- 13.McEvoy LK, Fennema-Notestine C, Roddey JC, et al. Alzheimer disease: quantitative structural neuroimaging for detection and prediction of clinical and structural changes in mild cognitive impairment. Radiology. 2009;251(1):195–205. doi: 10.1148/radiol.2511080924. [DOI] [PMC free article] [PubMed] [Google Scholar]
- 14.Snider BJ, Fagan AM, Roe C, et al. Cerebrospinal fluid biomarkers and rate of cognitive decline in very mild dementia of the Alzheimer type. Arch Neurol. 2009;66(5):638–45. doi: 10.1001/archneurol.2009.55. [DOI] [PMC free article] [PubMed] [Google Scholar]
- 15.Wallin AK, Blennow K, Zetterberg H, Londos E, Minthon L, Hansson O. CSF biomarkers predict a more malignant outcome in Alzheimer disease. Neurology. 2010;74(19):1531–7. doi: 10.1212/WNL.0b013e3181dd4dd8. [DOI] [PubMed] [Google Scholar]
- 16.Hampel H, Frank R, Broich K, et al. Biomarkers for Alzheimer’s disease: academic, industry and regulatory perspectives. Nat Rev Drug Discov. 2010;9(7):560–74. doi: 10.1038/nrd3115. [DOI] [PubMed] [Google Scholar]
- 17.Rinne JO, Brooks DJ, Rossor MN, et al. 11C-PiB PET assessment of change in fibrillar amyloid-beta load in patients with Alzheimer’s disease treated with bapineuzumab: a phase 2, double-blind, placebo-controlled, ascending-dose study. Lancet Neurol. 2010;9(4):363–72. doi: 10.1016/S1474-4422(10)70043-0. [DOI] [PubMed] [Google Scholar]
- 18.Blennow K. Biomarkers in Alzheimer’s disease drug development. Nat Med. 2010;16(11):1218–22. doi: 10.1038/nm.2221. [DOI] [PubMed] [Google Scholar]
- 19.Blennow K, Zetterberg H. Is it time for biomarker-based diagnostic criteria for prodromal Alzheimer’s disease? Alzheimers Res Ther. 2010;2(2):8. doi: 10.1186/alzrt31. [DOI] [PMC free article] [PubMed] [Google Scholar]
- 20.Clark CM, Xie S, Chittams J, et al. Cerebrospinal fluid tau and beta-amyloid: how well do these biomarkers reflect autopsy-confirmed dementia diagnoses? Arch Neurol. 2003;60(12):1696–702. doi: 10.1001/archneur.60.12.1696. [DOI] [PubMed] [Google Scholar]
- 21.Arai H, Terajima M, Miura M, et al. Tau in cerebrospinal fluid: a potential diagnostic marker in Alzheimer’s disease. Ann Neurol. 1995;38(4):649–52. doi: 10.1002/ana.410380414. [DOI] [PubMed] [Google Scholar]
- 22.Strozyk D, Blennow K, White LR, Launer LJ. CSF Abeta 42 levels correlate with amyloid-neuropathology in a population-based autopsy study. Neurology. 2003;60(4):652–6. doi: 10.1212/01.wnl.0000046581.81650.d0. [DOI] [PubMed] [Google Scholar]
- 23.Schoonenboom NS, van der Flier WM, Blankenstein MA, et al. CSF and MRI markers independently contribute to the diagnosis of Alzheimer’s disease. Neurobiol Aging. 2008;29(5):669–75. doi: 10.1016/j.neurobiolaging.2006.11.018. [DOI] [PubMed] [Google Scholar]
- 24.Fagan AM, Mintun MA, Mach RH, et al. Inverse relation between in vivo amyloid imaging load and cerebrospinal fluid Abeta42 in humans. Ann Neurol. 2006;59(3):512–9. doi: 10.1002/ana.20730. [DOI] [PubMed] [Google Scholar]
- 25.Jagust WJ, Landau SM, Shaw LM, et al. Relationships between biomarkers in aging and dementia. Neurology. 2009;73(15):1193–9. doi: 10.1212/WNL.0b013e3181bc010c. [DOI] [PMC free article] [PubMed] [Google Scholar]
- 26.Grimmer T, Riemenschneider M, Forstl H, et al. Beta amyloid in Alzheimer’s disease: increased deposition in brain is reflected in reduced concentration in cerebrospinal fluid. Biol Psychiatry. 2009;65(11):927–34. doi: 10.1016/j.biopsych.2009.01.027. [DOI] [PMC free article] [PubMed] [Google Scholar]
- 27.Tolboom N, van der Flier WM, Yaqub M, et al. Relationship of cerebrospinal fluid markers to 11C-PiB and 18F-FDDNP binding. J Nucl Med. 2009;50(9):1464–70. doi: 10.2967/jnumed.109.064360. [DOI] [PubMed] [Google Scholar]
- 28.Klunk WE, Engler H, Nordberg A, et al. Imaging brain amyloid in Alzheimer’s disease with Pittsburgh Compound-B. Ann Neurol. 2004;55(3):306–19. doi: 10.1002/ana.20009. [DOI] [PubMed] [Google Scholar]
- 29.Rabinovici GD, Jagust WJ. Amyloid imaging in aging and dementia: testing the amyloid hypothesis in vivo. Behav Neurol. 2009;21(1):117–28. doi: 10.3233/BEN-2009-0232. [DOI] [PMC free article] [PubMed] [Google Scholar]
- 30.Degerman Gunnarsson M, Lindau M, Wall A, et al. Pittsburgh compound-B and Alzheimer’s disease biomarkers in CSF, plasma and urine: An exploratory study. Dement Geriatr Cogn Disord. 2010;29(3):204–12. doi: 10.1159/000281832. [DOI] [PubMed] [Google Scholar]
- 31.Buerger K, Ewers M, Pirttila T, et al. CSF phosphorylated tau protein correlates with neocortical neurofibrillary pathology in Alzheimer’s disease. Brain. 2006;129(Pt 11):3035–41. doi: 10.1093/brain/awl269. [DOI] [PubMed] [Google Scholar]
- 32.Shaw LM, Vanderstichele H, Knapik-Czajka M, et al. Cerebrospinal fluid biomarker signature in Alzheimer’s disease neuroimaging initiative subjects. Ann Neurol. 2009;65(4):403–13. doi: 10.1002/ana.21610. [DOI] [PMC free article] [PubMed] [Google Scholar]
- 33.Tapiola T, Overmyer M, Lehtovirta M, et al. The level of cerebrospinal fluid tau correlates with neurofibrillary tangles in Alzheimer’s disease. Neuroreport. 1997;8(18):3961–3. doi: 10.1097/00001756-199712220-00022. [DOI] [PubMed] [Google Scholar]
- 34.Jagust W, Reed B, Mungas D, Ellis W, Decarli C. What does fluorodeoxyglucose PET imaging add to a clinical diagnosis of dementia? Neurology. 2007;69(9):871–7. doi: 10.1212/01.wnl.0000269790.05105.16. [DOI] [PubMed] [Google Scholar]
- 35.Minoshima S, Giordani B, Berent S, Frey KA, Foster NL, Kuhl DE. Metabolic reduction in the posterior cingulate cortex in very early Alzheimer’s disease. Ann Neurol. 1997;42(1):85–94. doi: 10.1002/ana.410420114. [DOI] [PubMed] [Google Scholar]
- 36.Hoffman JM, Welsh-Bohmer KA, Hanson M, et al. FDG PET imaging in patients with pathologically verified dementia. J Nucl Med. 2000;41(11):1920–8. [PubMed] [Google Scholar]
- 37.Jack CR, Jr, Petersen RC, O’Brien PC, Tangalos EG. MR-based hippocampal volumetry in the diagnosis of Alzheimer’s disease. Neurology. 1992;42(1):183–8. doi: 10.1212/wnl.42.1.183. [DOI] [PubMed] [Google Scholar]
- 38.Killiany RJ, Moss MB, Albert MS, Sandor T, Tieman J, Jolesz F. Temporal lobe regions on magnetic resonance imaging identify patients with early Alzheimer’s disease. Arch Neurol. 1993;50(9):949–54. doi: 10.1001/archneur.1993.00540090052010. [DOI] [PubMed] [Google Scholar]
- 39.Vemuri P, Whitwell JL, Kantarci K, et al. Antemortem MRI based STructural Abnormality iNDex (STAND)-scores correlate with postmortem Braak neurofibrillary tangle stage. Neuroimage. 2008;42(2):559–67. doi: 10.1016/j.neuroimage.2008.05.012. [DOI] [PMC free article] [PubMed] [Google Scholar]
- 40.Desikan RS, Cabral HJ, Hess CP, et al. Automated MRI measures identify individuals with mild cognitive impairment and Alzheimer’s disease. Brain. 2009;132(Pt 8):2048–57. doi: 10.1093/brain/awp123. [DOI] [PMC free article] [PubMed] [Google Scholar]
- 41.Silbert LC, Quinn JF, Moore MM, et al. Changes in premorbid brain volume predict Alzheimer’s disease pathology. Neurology. 2003;61(4):487–92. doi: 10.1212/01.wnl.0000079053.77227.14. [DOI] [PubMed] [Google Scholar]
- 42.Whitwell JL, Josephs KA, Murray ME, et al. MRI correlates of neurofibrillary tangle pathology at autopsy: a voxel-based morphometry study. Neurology. 2008;71(10):743–9. doi: 10.1212/01.wnl.0000324924.91351.7d. [DOI] [PMC free article] [PubMed] [Google Scholar]
- 43.Frisoni GB, Fox NC, Jack CR, Jr, Scheltens P, Thompson PM. The clinical use of structural MRI in Alzheimer disease. Nat Rev Neurol. 2010;6(2):67–77. doi: 10.1038/nrneurol.2009.215. [DOI] [PMC free article] [PubMed] [Google Scholar]
- 44.Jack CR, Jr, Knopman DS, Jagust WJ, et al. Hypothetical model of dynamic biomarkers of the Alzheimer’s pathological cascade. Lancet Neurol. 2010;9(1):119–28. doi: 10.1016/S1474-4422(09)70299-6. [DOI] [PMC free article] [PubMed] [Google Scholar]
- 45.Jack CR, Jr, Lowe VJ, Weigand SD, et al. Serial PIB and MRI in normal, mild cognitive impairment and Alzheimer’s disease: implications for sequence of pathological events in Alzheimer’s disease. Brain. 2009;132(Pt 5):1355–65. doi: 10.1093/brain/awp062. [DOI] [PMC free article] [PubMed] [Google Scholar]
- 46.Caroli A, Frisoni GB. The dynamics of Alzheimer’s disease biomarkers in the Alzheimer’s Disease Neuroimaging Initiative cohort. Neurobiol Aging. 2010;31(8):1263–74. doi: 10.1016/j.neurobiolaging.2010.04.024. [DOI] [PMC free article] [PubMed] [Google Scholar]
- 47.Vanderstichele H, De Meyer G, Shapiro F, et al. Hauppauge; NY: Nova Science Publishers, Inc; 2008. Biomarkers For Early Diagnosis Of Alzheimer’s Disease; pp. 81–122. [Google Scholar]
- 48.Jack CR, Jr, Bernstein MA, Fox NC, et al. The Alzheimer’s Disease Neuroimaging Initiative (ADNI): MRI methods. J Magn Reson Imaging. 2008;27(4):685–91. doi: 10.1002/jmri.21049. [DOI] [PMC free article] [PubMed] [Google Scholar]
- 49.Jovicich J, Czanner S, Greve D, et al. Reliability in multi-site structural MRI studies: effects of gradient non-linearity correction on phantom and human data. Neuroimage. 2006;30(2):436–43. doi: 10.1016/j.neuroimage.2005.09.046. [DOI] [PubMed] [Google Scholar]
- 50.Sled JG, Zijdenbos AP, Evans AC. A nonparametric method for automatic correction of intensity nonuniformity in MRI data. IEEE Trans Med Imaging. 1998;17(1):87–97. doi: 10.1109/42.668698. [DOI] [PubMed] [Google Scholar]
- 51.Fischl B, Salat DH, Busa E, et al. Whole brain segmentation: automated labeling of neuroanatomical structures in the human brain. Neuron. 2002;33(3):341–55. doi: 10.1016/s0896-6273(02)00569-x. [DOI] [PubMed] [Google Scholar]
- 52.Jack CR, Jr, Twomey CK, Zinsmeister AR, Sharbrough FW, Petersen RC, Cascino GD. Anterior temporal lobes and hippocampal formations: normative volumetric measurements from MR images in young adults. Radiology. 1989;172(2):549–54. doi: 10.1148/radiology.172.2.2748838. [DOI] [PubMed] [Google Scholar]
- 53.De Meyer G, Shapiro F, Vanderstichele H, et al. Diagnosis-Independent Alzheimer Disease Biomarker Signature in Cognitively Normal Elderly People. Arch Neurol. 2010;67(8):949–956. doi: 10.1001/archneurol.2010.179. [DOI] [PMC free article] [PubMed] [Google Scholar]
- 54.Ingelsson M, Fukumoto H, Newell KL, et al. Early Abeta accumulation and progressive synaptic loss, gliosis, and tangle formation in AD brain. Neurology. 2004;62(6):925–31. doi: 10.1212/01.wnl.0000115115.98960.37. [DOI] [PubMed] [Google Scholar]
- 55.Perrin RJ, Fagan AM, Holtzman DM. Multimodal techniques for diagnosis and prognosis of Alzheimer’s disease. Nature. 2009;461(7266):916–22. doi: 10.1038/nature08538. [DOI] [PMC free article] [PubMed] [Google Scholar]
- 56.Fagan AM, Roe CM, Xiong C, Mintun MA, Morris JC, Holtzman DM. Cerebrospinal fluid tau/beta-amyloid(42) ratio as a prediction of cognitive decline in nondemented older adults. Arch Neurol. 2007;64(3):343–9. doi: 10.1001/archneur.64.3.noc60123. [DOI] [PubMed] [Google Scholar]
- 57.Vemuri P, Wiste HJ, Weigand SD, et al. MRI and CSF biomarkers in normal, MCI, and AD subjects: Diagnostic discrimination and cognitive correlations. Neurology. 2009;73(4):287–293. doi: 10.1212/WNL.0b013e3181af79e5. [DOI] [PMC free article] [PubMed] [Google Scholar]
- 58.Vemuri P, Wiste HJ, Weigand SD, et al. Serial MRI and CSF Biomarkers in Normal Aging, MCI and AD. Neurology. 2010;75(2):143–151. doi: 10.1212/WNL.0b013e3181e7ca82. [DOI] [PMC free article] [PubMed] [Google Scholar]
- 59.Peskind ER, Li G, Shofer J, et al. Age and apolipoprotein E*4 allele effects on cerebrospinal fluid beta-amyloid 42 in adults with normal cognition. Arch Neurol. 2006;63(7):936–9. doi: 10.1001/archneur.63.7.936. [DOI] [PubMed] [Google Scholar]
- 60.Scheinin NM, Aalto S, Koikkalainen J, et al. Follow-up of [11C]PIB uptake and brain volume in patients with Alzheimer disease and controls. Neurology. 2009;73(15):1186–92. doi: 10.1212/WNL.0b013e3181bacf1b. [DOI] [PubMed] [Google Scholar]
- 61.Fox NC, Crum WR, Scahill RI, Stevens JM, Janssen JC, Rossor MN. Imaging of onset and progression of Alzheimer’s disease with voxel-compression mapping of serial magnetic resonance images. Lancet. 2001;358(9277):201–5. doi: 10.1016/S0140-6736(01)05408-3. [DOI] [PubMed] [Google Scholar]
- 62.Carlson NE, Moore MM, Dame A, et al. Trajectories of brain loss in aging and the development of cognitive impairment. Neurology. 2008;70(11):828–33. doi: 10.1212/01.wnl.0000280577.43413.d9. [DOI] [PubMed] [Google Scholar]
- 63.Sperling RA, Laviolette PS, O’Keefe K, et al. Amyloid deposition is associated with impaired default network function in older persons without dementia. Neuron. 2009;63(2):178–88. doi: 10.1016/j.neuron.2009.07.003. [DOI] [PMC free article] [PubMed] [Google Scholar]
- 64.Hedden T, Van Dijk KR, Becker JA, et al. Disruption of functional connectivity in clinically normal older adults harboring amyloid burden. J Neurosci. 2009;29(40):12686–94. doi: 10.1523/JNEUROSCI.3189-09.2009. [DOI] [PMC free article] [PubMed] [Google Scholar]
- 65.Mormino EC, Kluth JT, Madison CM, et al. Episodic memory loss is related to hippocampal-mediated beta-amyloid deposition in elderly subjects. Brain. 2009;132(Pt 5):1310–23. doi: 10.1093/brain/awn320. [DOI] [PMC free article] [PubMed] [Google Scholar]
- 66.DeKosky ST, Scheff SW. Synapse loss in frontal cortex biopsies in Alzheimer’s disease: correlation with cognitive severity. Ann Neurol. 1990;27(5):457–64. doi: 10.1002/ana.410270502. [DOI] [PubMed] [Google Scholar]
- 67.Savva GM, Wharton SB, Ince PG, Forster G, Matthews FE, Brayne C. Age, neuropathology, and dementia. N Engl J Med. 2009;360(22):2302–9. doi: 10.1056/NEJMoa0806142. [DOI] [PubMed] [Google Scholar]
- 68.Terry RD, Masliah E, Salmon DP, et al. Physical basis of cognitive alterations in Alzheimer’s disease: synapse loss is the major correlate of cognitive impairment. Ann Neurol. 1991;30(4):572–80. doi: 10.1002/ana.410300410. [DOI] [PubMed] [Google Scholar]
- 69.Bennett DA, Schneider JA, Wilson RS, Bienias JL, Berry-Kravis E, Arnold SE. Amyloid mediates the association of apolipoprotein E e4 allele to cognitive function in older people. J Neurol Neurosurg Psychiatry. 2005;76(9):1194–9. doi: 10.1136/jnnp.2004.054445. [DOI] [PMC free article] [PubMed] [Google Scholar]
- 70.Rowe CC, Ellis KA, Rimajova M, et al. Amyloid imaging results from the Australian ng, Biomarkers and Lifestyle (AIBL) study of aging. Neurobiol Aging. 2010;31(8):1275–83. doi: 10.1016/j.neurobiolaging.2010.04.007. [DOI] [PubMed] [Google Scholar]
- 71.Pike KE, Ellis KA, Villemagne VL, et al. Cognition and beta-amyloid in preclinical Alzheimer’s disease: Data from the AIBL study. Neuropsychologia. 2011 doi: 10.1016/j.neuropsychologia.2011.04.012. (Epub ahead of print) [DOI] [PubMed] [Google Scholar]
- 72.Villemagne VL, Pike KE, Chetelat G, et al. Longitudinal assessment of Abeta and cognition in aging and Alzheimer disease. Ann Neurol. 2011;69(1):181–92. doi: 10.1002/ana.22248. [DOI] [PMC free article] [PubMed] [Google Scholar]
- 73.Jicha GA, Parisi JE, Dickson DW, et al. Neuropathologic outcome of mild cognitive impairment following progression to clinical dementia. Arch Neurol. 2006;63(5):674–81. doi: 10.1001/archneur.63.5.674. [DOI] [PubMed] [Google Scholar]
- 74.Bennett DA, Schneider JA, Bienias JL, Evans DA, Wilson RS. Mild cognitive impairment is related to Alzheimer disease pathology and cerebral infarctions. Neurology. 2005;64(5):834–41. doi: 10.1212/01.WNL.0000152982.47274.9E. [DOI] [PubMed] [Google Scholar]
- 75.Schneider JA, Arvanitakis Z, Leurgans SE, Bennett DA. The neuropathology of probable Alzheimer disease and mild cognitive impairment. Ann Neurol. 2009;66(2):200–8. doi: 10.1002/ana.21706. [DOI] [PMC free article] [PubMed] [Google Scholar]
- 76.Schneider JA, Aggarwal NT, Barnes L, Boyle P, Bennett DA. The neuropathology of older persons with and without dementia from community versus clinic cohorts. J Alzheimers Dis. 2009;18(3):691–701. doi: 10.3233/JAD-2009-1227. [DOI] [PMC free article] [PubMed] [Google Scholar]
- 77.Markesbery WR, Schmitt FA, Kryscio RJ, Davis DG, Smith CD, Wekstein DR. Neuropathologic substrate of mild cognitive impairment. Arch Neurol. 2006;63(1):38–46. doi: 10.1001/archneur.63.1.38. [DOI] [PubMed] [Google Scholar]
- 78.White L, Small BJ, Petrovitch H, et al. Recent clinical-pathologic research on the causes of dementia in late life: update from the Honolulu-Asia Aging Study. J Geriatr Psychiatry Neurol. 2005;18(4):224–7. doi: 10.1177/0891988705281872. [DOI] [PubMed] [Google Scholar]
- 79.Jack CR, Jr, Dickson DW, Parisi JE, et al. Antemortem MRI findings correlate with hippocampal neuropathology in typical aging and dementia. Neurology. 2002;58(5):750–7. doi: 10.1212/wnl.58.5.750. [DOI] [PMC free article] [PubMed] [Google Scholar]
- 80.Schott JM, Bartlett JW, Fox NC, Barnes J. Increased brain atrophy rates in cognitively normal older adults with low cerebrospinal fluid Abeta1-42. Ann Neurol. 2010;68(6):825–834. doi: 10.1002/ana.22315. [DOI] [PubMed] [Google Scholar]
- 81.Fagan AM, Head D, Shah AR, et al. Decreased cerebrospinal fluid Abeta(42) correlates with brain atrophy in cognitively normal elderly. Ann Neurol. 2009;65(2):176–83. doi: 10.1002/ana.21559. [DOI] [PMC free article] [PubMed] [Google Scholar]
- 82.Morris JC, Roe CM, Grant EA, et al. Pittsburgh Compound B imaging and prediction of progression from cognitive normality to symptomatic Alzheimer disease. Arch Neurol. 2009;66(12):1469–75. doi: 10.1001/archneurol.2009.269. [DOI] [PMC free article] [PubMed] [Google Scholar]
- 83.Rabinovici GD, Furst AJ, O’Neil JP, et al. 11C-PIB PET imaging in Alzheimer disease and frontotemporal lobar degeneration. Neurology. 2007;68(15):1205–12. doi: 10.1212/01.wnl.0000259035.98480.ed. [DOI] [PubMed] [Google Scholar]
- 84.Becker JA, Hedden T, Carmasin J, et al. Amyloid-beta associated cortical thinning in clinically normal elderly. Ann Neurol. 2010 doi: 10.1002/ana.22333. (Epub ahead of print) [DOI] [PMC free article] [PubMed] [Google Scholar]
- 85.Dickerson BC, Bakkour A, Salat DH, et al. The cortical signature of Alzheimer’s disease: regionally specific cortical thinning relates to symptom severity in very mild to mild AD dementia and is detectable in asymptomatic amyloid-positive individuals. Cereb Cortex. 2009;19(3):497–510. doi: 10.1093/cercor/bhn113. [DOI] [PMC free article] [PubMed] [Google Scholar]
- 86.Dickerson BC, Stoub TR, Shah RC, et al. Alzheimer-signature MRI biomarker predicts AD dementia in cognitively normal adults. Neurology. 2011;76(16):1395–402. doi: 10.1212/WNL.0b013e3182166e96. [DOI] [PMC free article] [PubMed] [Google Scholar]
Associated Data
This section collects any data citations, data availability statements, or supplementary materials included in this article.