Neurodegenerative disorders such as Alzheimer’s, Parkinson’s, and Huntington’s diseases are all associated with protein misfolding, aggregation, and the accumulation of insoluble amyloid aggregates in neurons.[1] Huntington’s disease is caused by expansion of a polyglutamine (polyQ) tract within exon 1 of the huntingtin (Htt) protein beyond a threshold of approximately 40 glutamine residues. An expanded polyQ tract enhances Htt propensity for aggregation and leads to the neuronal dysfunction and loss associated with Huntington’s disease.[2] Characterization of Htt aggregate species is critical for understanding the mechanism of Huntington’s disease and identifying potential therapies.
The globular and fibrillar aggregates formed by Htt-exon1 in vitro have been imaged by the non-optical high-resolution methods of electron microscopy and atomic force microscopy (AFM).[3,4] Diffraction-limited (DL) single-molecule and single-fibril optical fluorescence imaging with labelled protein monomers and thioflavin T binding have been used to measure in vitro amyloid fibril growth in real-time of yeast prion,[5, 6] β2-microgobulin,[7] glucagon,[8] and Alzheimer’s amyloid β-peptide.[8] However, the evolving morphologies of Htt assemblies during aggregate growth in aqueous environments are not well understood. Unlike the long, continuous fibers (some growing to tens of microns in length) formed by the proteins in the kinetics studies listed above, Htt proteins typically form short, broom-like aggregates in vitro that have a great deal of fine structure below the optical diffraction limit (of ~200 nm resolution). An emerging tool for obtaining protein structural information on the 20–100 nm scale is single-molecule super-resolution (SR) fluorescence imaging. SR imaging breaks the optical diffraction limit by repeatedly localizing sparse subsets of fluorescent single molecules with nm accuracy, and then summing the localizations to reconstruct the image (e.g., FPALM, PALM, STORM).[9] SR imaging has been used to reveal the shapes of protein superstructures in bacterial[10, 11] and mammalian[9, 12–14] cells. SR adds increased resolution to the advantages of fluorescence imaging over AFM and electron microscopy, which include imaging of large fields of view in aqueous environments, low perturbation of the system, and the ability to image in near real-time (limited by the time required for SR’s sequential imaging). The intricate nanostructures formed by fibrillar Htt aggregates in vitro and the sub-diffraction widths of individual Htt fibers mark Htt amyloids as important targets for high-resolution optical imaging. Here, we demonstrate the power of SR imaging for characterizing the morphology of Htt fibrils in buffer and validate the resulting structures by correlation with AFM imaging.
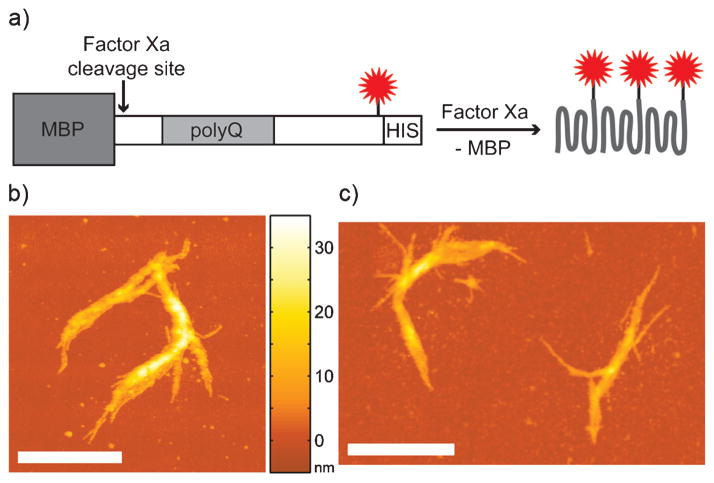
We utilized purified, polyQ-expanded Htt-exon1, a naturally occurring N-terminal proteolytic fragment of Htt that is sufficient for Huntington’s disease pathogenesis[15] and has been identified as a major component of neuronal inclusion bodies in individuals with Huntington’s disease.[16] Maltose-binding protein (MBP)-HttQ44-exon1-S112C-histag[17] (where Q44 specifies the length of the polyQ tract and S112C indicates the position of the single cysteine mutation in the protein) was labelled with ATTO 655 maleimide (Figure 1a). Fusion of MBP to Htt prevents aggregation of Htt until MBP is cleaved away by the protease Factor Xa. The C-terminal 112 labelling position was selected because it is not believed to play a large role in the protein-protein interactions that lead to aggregation.[17]
Figure 1.
The in vitro Htt aggregation system: a) Fluorescent Htt aggregates (red star =ATTO 655) form after Factor Xa cleavage. AFM images of fibers after one day of aggregation containing b) only unlabeled Htt and c) Htt:Htt-ATTO 655 =100:1. Color scale between images indicates height (z direction). Scale bars: 1 μm.
Aggregates consisting of fluorescently labeled Htt and unlabeled Htt at a 1:100 ratio were adsorbed to clean glass or quartz slides and characterized with AFM and phase-contrast imaging (Supporting Information Figure S1). Htt fibers appeared starting approximately 4 h after Factor Xa addition, and SR images were collected after 1 day of aggregation. Figure 1b and c show that incorporation of Htt-ATTO 655 at a 100 0 dilution did not affect aggregate morphology, and our AFM images agree well with previous work.[4]
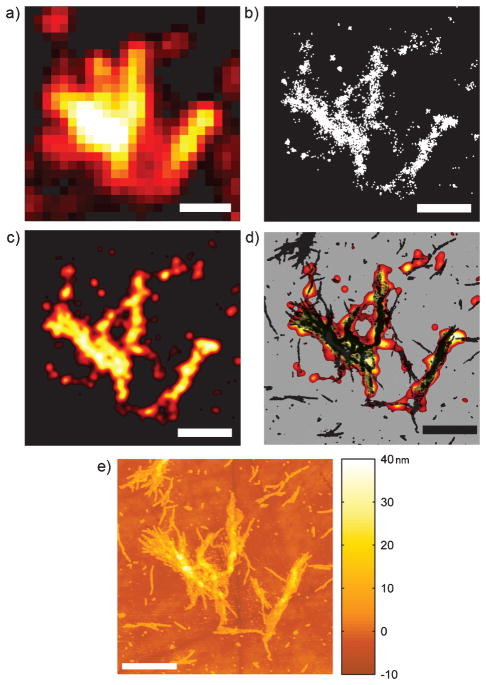
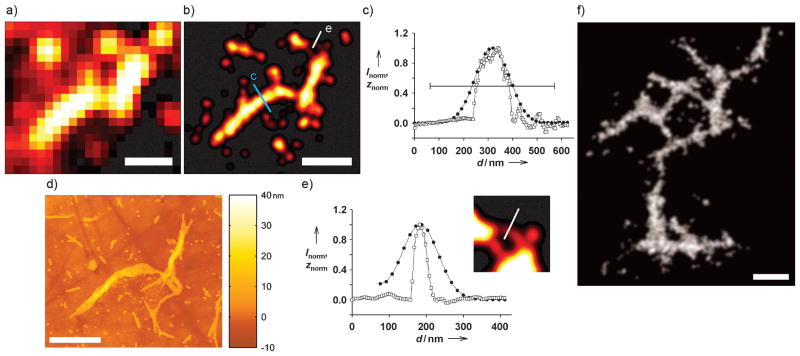
To obtain fluorescence images beyond the optical diffraction limit, we employed Blink-Microscopy, an SR technique based on dyes such as ATTO 655 that repeatedly enter a dark state between cycles of fluorescence emission (“blink”) in the presence of reductants and oxidants.[18–20] Htt samples in an aqueous environment of PBS pH 7.4 buffer containing 50 μM of the reducing agent ascorbic acid were imaged for typically 90–100 s at 7.5 ms frame−1. Figures 2a and 3 a show typical DL sums of frames of the single-molecule movies, where fine detail is obscured. The positions of the blinking molecules for the SR reconstructions were determined using a previously described fitting algorithm (Figure 2b).[10] The localization precision was defined as half of the statistical 95 % confidence interval of the center of the 2D Gaussian fit to each single-molecule image. The average localization precisions of 43–48 nm were used as the standard deviations (σ) of the plotted Gaussians (see Supporting Information, Table S1, for full statistics of the fits). The goal of the SR reconstructions was to illuminate the contiguous structures of the aggregates, thus the Gaussian fits were plotted with constant amplitude after application of a “thinout” algorithm that removed fits from oversampled areas (see Supporting Information, discussion and Figure S2). Comparison of Figures 2c and 3 b with the conventional DL images in Figures 2a and 3 a, respectively, demonstrates a striking improvement in resolution and reveals morphological details such as the diagonal fiber spanning the interior of the V-shaped aggregate in Figure 2c. Sub-diffraction SR images of many aggregates with a range of shapes were successfully captured (Figure 3 f and Supporting Information, Figures S3 and S4).
Figure 2.
Sub-diffraction images of an Htt aggregate: a) DL sum of movie frames that were processed to create the SR reconstruction. b) Points representing the centers of the single-molecule fits. c) SR image displayed with color scale (fit density increases from black to red through to white). d) AFM (black) and SR overlay image displayed on a gray background. e) AFM image of aggregate. Scale bars: 1 μm.
Figure 3.
Comparison of SR and AFM images. The DL data in (a) yielded the SR reconstruction in (b) for the aggregate imaged by AFM in (d). c) Comparison of cross-sectional profiles of SR intensity (●) and AFM topography (□) for the blue line in (b). The horizontal bar is the FWHM of the same cross-section in the DL image. e) Profiles for the white line in (b) [same symbols as (c)]. The inset is a 2x magnification of the region in (b) with enhanced contrast. f) Representative SR image of a large Htt aggregate in gray scale. Scale bars: 1 μm.
To validate the accuracy of our SR reconstructions, we performed correlative AFM imaging on the same aggregates using gold alignment marks on the slides (Figures 2e and 3 d). AFM is accepted as a standard high-resolution technique for amyloid fiber imaging. The overlay image in Figure 2d displays excellent agreement between the SR and AFM images. The concordance between SR and AFM was quantified in Figure 3, where cross-sectional profiles of the main regions of the fiber show remarkable similarity (Figure 3c). Full-width-at-half-maximum (FWHM) values were calculated from a Gaussian fit to the SR reconstruction (162.7 nm) and estimated from the AFM topography trace (~132 nm; base width =169 nm). The horizontal bar shows the 506.5 nm FWHM from the corresponding DL image (Figure 3a), highlighting the dramatic increase in resolution made possible by SR. The thin fibers at the top of the structure were successfully detected in the SR data, although the width discrepancy with the high-resolution AFM image (Figure 3e) shows the natural limitation of the SR measurement arising ultimately from the number of detected photons from each single molecule (see Supporting Information). The FWHM for the SR and AFM profiles were 120.2 nm and ~40 nm (base width =75 nm), respectively. The minimum SR FWHM attainable here, which is given by the uncertainty associated with localizing an individual single molecule, is 113 nm based on the average localization precision of 48 nm in Figure 3.
Careful examination of the AFM and SR images in Figures 2 and 3 reveals some small features which do not co-localize. This was likely due to perturbation of small aggregates (which are not expected to be as strongly adsorbed to the quartz as larger fibers) during the washing and drying steps between SR and AFM imaging. In some cases, it appears that small fibers may have been translated across the quartz surface or desorbed completely.
The extent of Htt-ATTO 655 incorporation into the aggregates was determined from the AFM and fluorescence data. The AFM topography data in Figure 3d made it possible to calculate the volume of the Htt fiber (6.86 × 10⁶ nm3). The volume of a misfolded Htt monomer in an amyloid environment was calculated from the typical packing density of globular proteins, 1.35 g cm−3.[21] The Htt fiber was found to contain 3.72 × 10⁵ Htt monomers; of this, 3680 monomers should be labeled with ATTO 655 at the 100:1 aggregation reaction ratio. Assuming uniform distribution of the Htt-ATTO 655, the separation between labeled Htt monomers in three-dimensions would be approximately 12 nm. The actual number of fluorophores present in the fiber was estimated from the initial fluorescence counts of the fiber and the average counts of a single molecule of ATTO 655 in this experiment (see Supporting Information). The fiber was found to contain 2000 ± 1000 fluorophores. Based on this analysis, we concluded that Htt-ATTO 655 incorporation into the aggregate reflected the ratio of unlabelled to labeled protein that was initially mixed together. Our calculation of the spacing of labeled Htt monomers in the fibers and the number of localizations also allowed us to confirm that our study satisfied the Nyquist sampling criterion (see Supporting Information).
The SR images presented herein represent the first single-molecule, sub-diffraction fluorescence examination of amyloid disease protein aggregates. The SR Htt aggregate structures agree well with the high-resolution topography maps produced by conventional AFM imaging. Our work demonstrates the power of SR to reveal morphological details not accessible by standard DL fluorescence microscopy and paves the way for real-time in vivo SR characterization of Htt aggregates.
Experimental Section
The MBP-HttQ44-exon1-S112C-histag construct was prepared and purified according to previously described protocols,[4,17] with the modifications of protein expression in BL21 E. coli by autoinduction and amylose column purification following histag purification. Protein was exchanged into Buffer C (25 mM HEPES-KOH pH 7.4, 100 mM NaCl, 10 % glycerol) following purification. Labeling of the MBP-Htt was carried out in Buffer C pH 7.0 with tris-(2-carboxyethyl)phosphine hydrochloride (1 mM, TCEP, Invitrogen) and a tenfold molar excess of ATTO 655 maleimide (ATTO-TEC). The reaction proceeded overnight at 4°C on a microcentrifuge tube rotator. The reaction was quenched with dithiothreitol (3 mM, DTT) and free dye was removed following a 30,000 RCF centrifugation (10 min, 4 °C) by Micro Bio-Spin 30 columns (Bio-Rad). Final protein and dye concentrations were calculated from the absorbance at 280 nm and 663 nm. Typical dye:protein labeling ratios were in the range of 0.2 to 0.7. All protein was stored at −80 °C.
Aggregation reactions with an 100:1 ratio of MBP-Htt to MBP-Htt-ATTO 655 at a total protein concentration of 4.2 μM were prepared in modified cleavage buffer (50mM Tris-HCl pH 8, 100 mM NaCl, 5 mM CaCl2, 10 % glycerol). MBP-Htt stocks were centrifuged for 10 min at 30,000 RCF (4 °C) to pellet any aggregates formed during storage or thawing. Cleavage of MBP away from Htt by 1 μg of Factor Xa protease (Novagen, EMD Chemicals) for every 12 μg of MBP-Htt initiated aggregation. The aggregation reactions were incubated at room temperature, in the dark, on a gently rocking Nutator mixer (Adams). Aliquots removed at various time points were adsorbed to clean glass slides (or quartz slides with nanometer-scale arrays of gold fiduciary features on them fabricated by electron beam lithography)[22] that were fitted with adhesive silicone isolator barriers (Grace Bio-Labs) to form open-top chambers. After 1 min of incubation, the slide was washed repeatedly with nano-pure water or PBS pH 7.4 buffer (Gibco). PBS pH 7.4 buffer containing ascorbic acid (50 μM) was then added to the chamber for the Blink-Microscopy experiments. The dye ATTO 655 exhibits tuneable continuous blinking in the presence of ascorbic acid and ambient oxygen through the stabilization of a dark radical anion state.[18–20]
Single-molecule fluorescence movies were acquired with an Olympus IX71 microscope equipped with a 100 0 oil immersion objective (Olympus UPLSAPO, 1.4 NA) and an Andor Ixon+ EMCCD camera. The laser power and camera exposure time were optimized based on the on-times of the ATTO 655 in the presence of ascorbic acid. The blinking of the ATTO 655 molecules under constant 638 nm laser excitation was captured in movies of 12,000–13,000 frames acquired at 7.5 ms exposure time. The mechanical drift of the stage (Semprex) was negligible during this 90–100 s recording time. Imaging was performed in either epi or pseudo-TIR configurations with laser intensities of 2–13 kW cm−2. Additional details of the imaging setup are in the Supporting Information.
For samples to be imaged by AFM, the silicone isolators were carefully removed. The quartz slides were rinsed with nanopure water and dried with a stream of nitrogen gas. Alignment by gold fiduciary marks made it possible to collect AFM images of the same regions that had been imaged by fluorescence (note: the gold fiduciary marks were just barely visible in the fluorescence images). Samples were imaged with a Park Systems XE-70 AFM operating in non-contact mode. AFM images were flattened using first- or second-order fits in XEI (Park Systems) and plotted using a custom MATLAB (MathWorks) script. The volume of Htt aggregates was also extracted in XEI.
Supplementary Material
Acknowledgments
This work was supported by Award Number PN2EY016525 from the National Eye Institute of the U.S. National Institutes of Health, a U.S. National Science Foundation Graduate Research Fellowship (W.C.D.), and The Gabilan Stanford Graduate Fellowship (W.C.D.). We acknowledge Anika Kinkhabwala for fabrication of the quartz-gold fiduciary slides and Michael A. Thompson and Steven F. Lee for advice and helpful discussions.
Footnotes
Supporting information for this article is available on the WWW under http://dx.doi.org/10.1002/cphc.201100392.
References
- 1.Soto C. Nat Rev Neurosci. 2003;4:49–60. doi: 10.1038/nrn1007. [DOI] [PubMed] [Google Scholar]
- 2.Zoghbi HY, Orr HT. Annu Rev Neurosci. 2000;23:217–247. doi: 10.1146/annurev.neuro.23.1.217. [DOI] [PubMed] [Google Scholar]
- 3.Scherzinger E, Sittler A, Schweiger K, Heiser V, Lurz R, Hasenbank R, Bates GP, Lehrach H, Wanker EE. Proc Natl Acad Sci USA. 1999;96:4604–4609. doi: 10.1073/pnas.96.8.4604. [DOI] [PMC free article] [PubMed] [Google Scholar]
- 4.Poirier MA, Li H, Macosko J, Cai S, Amzel M, Ross CA. J Biol Chem. 2002;277:41032–41037. doi: 10.1074/jbc.M205809200. [DOI] [PubMed] [Google Scholar]
- 5.Inoue Y, Kishimoto A, Hirao J, Yoshida M, Taguchi H. J Biol Chem. 2001;276:35227–35230. doi: 10.1074/jbc.C100304200. [DOI] [PubMed] [Google Scholar]
- 6.Collins SR, Douglass A, Vale RD, Weissman JS. PLoS Biol. 2004;2:e321. doi: 10.1371/journal.pbio.0020321. [DOI] [PMC free article] [PubMed] [Google Scholar]
- 7.Ban T, Hamada D, Hasegawa K, Naiki H, Goto Y. J Biol Chem. 2003;278:16462–16465. doi: 10.1074/jbc.C300049200. [DOI] [PubMed] [Google Scholar]
- 8.Andersen CB, Yagi H, Manno M, Martorana V, Ban T, Christiansen G, Otzen DE, Goto Y, Rischel C. Biophys J. 2009;96:1529–1536. doi: 10.1016/j.bpj.2008.11.024. [DOI] [PMC free article] [PubMed] [Google Scholar]
- 9.Huang B, Babcock H, Zhuang X. Cell. 2010;143:1047–1058. doi: 10.1016/j.cell.2010.12.002. [DOI] [PMC free article] [PubMed] [Google Scholar]
- 10.Biteen JS, Thompson MA, Tselentis NK, Bowman GR, Shapiro L, Moerner WE. Nat Methods. 2008;5:947–949. doi: 10.1038/NMETH.1258. [DOI] [PMC free article] [PubMed] [Google Scholar]
- 11.Ptacin JL, Lee SF, Garner EC, Toro E, Eckart M, Comolli LR, Moerner WE, Shapiro L. Nat Cell Biol. 2010;12:791–798. doi: 10.1038/ncb2083. [DOI] [PMC free article] [PubMed] [Google Scholar]
- 12.Shroff H, Galbraith CG, Galbraith JA, Betzig E. Nat Methods. 2008;5:417–423. doi: 10.1038/nmeth.1202. [DOI] [PMC free article] [PubMed] [Google Scholar]
- 13.Lee HD, Lord SJ, Iwanaga S, Zhan K, Xie H, Williams JC, Wang H, Bowman GR, Goley ED, Shapiro L, Twieg RJ, Rao J, Moerner WE. J Am Chem Soc. 2010;132:15099– 15101. doi: 10.1021/ja1044192. [DOI] [PMC free article] [PubMed] [Google Scholar]
- 14.Wombacher R, Heidbreder M, van de Linde S, Sheetz MP, Heilemann M, Cornish VW, Sauer M. Nat Methods. 2010;7:717–719. doi: 10.1038/nmeth.1489. [DOI] [PubMed] [Google Scholar]
- 15.Mangiarini L, Sathasivam K, Seller M, Cozens B, Harper A, Hetherington C, Lawton M, Trottier Y, Lehrach H, Davies SW, Bates GP. Cell. 1996;87:493–506. doi: 10.1016/s0092-8674(00)81369-0. [DOI] [PubMed] [Google Scholar]
- 16.DiFiglia M, Sapp E, Chase KO, Davies SW, Bates GP, Vonsattel JP, Aronin N. Science. 1997;277:1990–1993. doi: 10.1126/science.277.5334.1990. [DOI] [PubMed] [Google Scholar]
- 17.Tam S, Spiess C, Auyeung W, Joachimiak L, Chen B, Poirier MA, Frydman J. Nat Struct Mol Biol. 2009;16:1279–1285. doi: 10.1038/nsmb.1700. [DOI] [PMC free article] [PubMed] [Google Scholar]
- 18.Vogelsang J, Cordes T, Forthmann C, Steinhauer C, Tinnefeld P. Proc Natl Acad Sci USA. 2009;106:8107–8112. doi: 10.1073/pnas.0811875106. [DOI] [PMC free article] [PubMed] [Google Scholar]
- 19.Cordes T, Strackharn M, Stahl SW, Summerer W, Steinhauer C, Forthmann C, Puchner EM, Vogelsang J, Gaub HE, Tinnefeld P. Nano Lett. 2010;10:645–651. doi: 10.1021/nl903730r. [DOI] [PubMed] [Google Scholar]
- 20.van de Linde S, Endesfelder U, Mukherjee A, Schuttpelz M, Wiebusch G, Wolter S, Heilemann M, Sauer M. Photochem Photobiol Sci. 2009;8:465–469. doi: 10.1039/b822533h. [DOI] [PubMed] [Google Scholar]
- 21.Fischer H, Polikarpov I, Craievich AF. Protein Sci. 2004;13:2825–2828. doi: 10.1110/ps.04688204. [DOI] [PMC free article] [PubMed] [Google Scholar]
- 22.Lee JK, J3ckel F, Moerner WE, Bao Z. Small. 2009;5:2418–2423. doi: 10.1002/smll.200900494. [DOI] [PubMed] [Google Scholar]
Associated Data
This section collects any data citations, data availability statements, or supplementary materials included in this article.


