Abstract
White matter fiber bundles form a spatial pattern defined by anatomical and functional architecture. Structural lesions in the white matter may cause clinical symptoms because of disruption of fiber tracts. The clinical significance will depend on the anatomic location of such lesions and whether the functional integrity of specific fiber bundles is affected. Unlike more acute lesions of stroke or multiple sclerosis that may cause sudden sensorimotor deficits, white matter lesions of aging manifest with more subtle and gradual symptoms that are often cognitive in nature. Such cognitive symptoms have been explained by strategically located white matter lesions in the deep forebrain that may disrupt cholinergic projection fibers at their proximal origin. Recent in vivo imaging studies provide supportive evidence that periventricular white matter lesions are associated with cortical cholinergic deafferentation in elderly with leukoaraiosis. White matter lesions at the frontal horns, so-called “capping,” are in close proximity to cholinergic axons that originate in the basal forebrain. Therefore, these lesions may result in more significant cortical deafferentation because of the more proximal axonal disruption. A unique anatomic feature common to all cortical projections from subcortical neuromodulator systems (that not only include the cholinergic but also the monoaminergic systems, such as dopamine, serotonin, and norepinephrine) is that the proximal axons largely pass through the deep forebrain before fanning out to the cortex. It is thus plausible that deep frontal white matter lesions may result in not only cholinergic but also variable monoaminergic cortical deafferentation.
A. Introduction
White matter lesions (WML) are commonly observed on MRI scans in older adults and are thought to occur in the context of cardiovascular disease (1). These age-associated WML have been affiliated with cognitive decline, including dementia, and, also, depression and impaired mobility (2–4). Given the diverse nature of these neurological consequences of WML, we postulate the hypothesis that the clinical sequelae of WML in part reflect the disruption of axonal projection fibers of neuromodulator systems that travel from subcortical nuclei to the cortex. In this paper we will mainly focus on the cholinergic pathways and present indirect and more direct evidence for the disruption of cholinergic fibers by WML. Anatomic evidence for similar white matter disruptive mechanisms of mono-aminergic neuromodulator systems (dopamine, serotonin, norepinephrine) is also discussed.
B. Anatomy of cholinergic pathways and WML
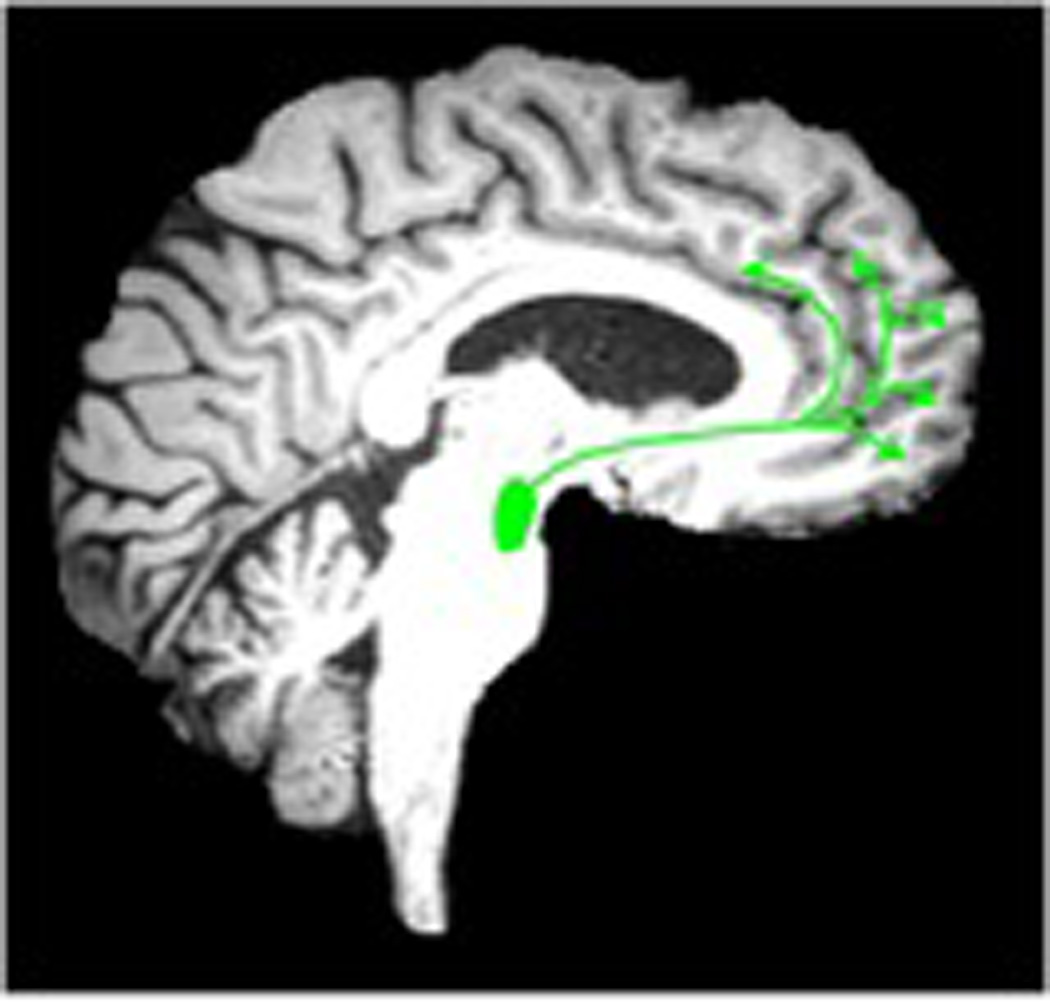
Several sites within the basal forebrain supply cholinergic innervation to the brain (5). The medial septal nucleus (Ch1 cell group) and the vertical limb nucleus of the diagonal band (Ch2) provide the major cholinergic input to the hippocampus. Cholinergic neurons of the horizontal limb nucleus of the diagonal band (Ch3) provide the major cholinergic input of the olfactory bulb, and cholinergic neurons of the nucleus basalis or Meynert (nbM; Ch4) provide the principal cholinergic input of the remaining cerebral cortex and amygdala (6). The trajectories of white matter pathways linking the nbM with the cerebral cortex have been traced immunohistochemically in the human brain (5). These cholinergic pathways arise from the deep forebrain looping closely around the anterior corpus callosum and the frontal horns of the ventricles. The lateral pathway passes lateral to the ventricles through the external capsule before fanning out to innervate the cerebral cortex. The medial pathway passes through the white matter deep to the cingulate gyrus (5).
WML are typically located in more superficial subcortical areas but are also prominent adjacent to the ventricles, in particular at the frontal and occipital horns (7). Structural lesions in the white matter may cause symptoms because of disruption of fiber tracts. The more superficial or subcortical WML may disrupt the functional connectivity of association fibers that convey cortico-cortical connections. However, the more deeply located lesions may disrupt long axonal projection fibers of neuromodulator systems that travel from sub-cortical nuclei to the cortex, such as the cholinergic system. As fibers entering the deep forebrain from lower brain centers radiate fan-like through the cerebral white matter to the cortex, their density per unit of brain tissue volume decreases along the way from their source to destination (8). Hence, it is plausible that WML that are in close proximity to the cholinergic pathways, especially at their more proximal origin, are most likely to disrupt these cholinergic projection axons (Figure 1). This is consistent with evidence suggesting that WML within the frontal white matter tracts are especially detrimental relative to WML in other lobar locations (9).
Figure 1.
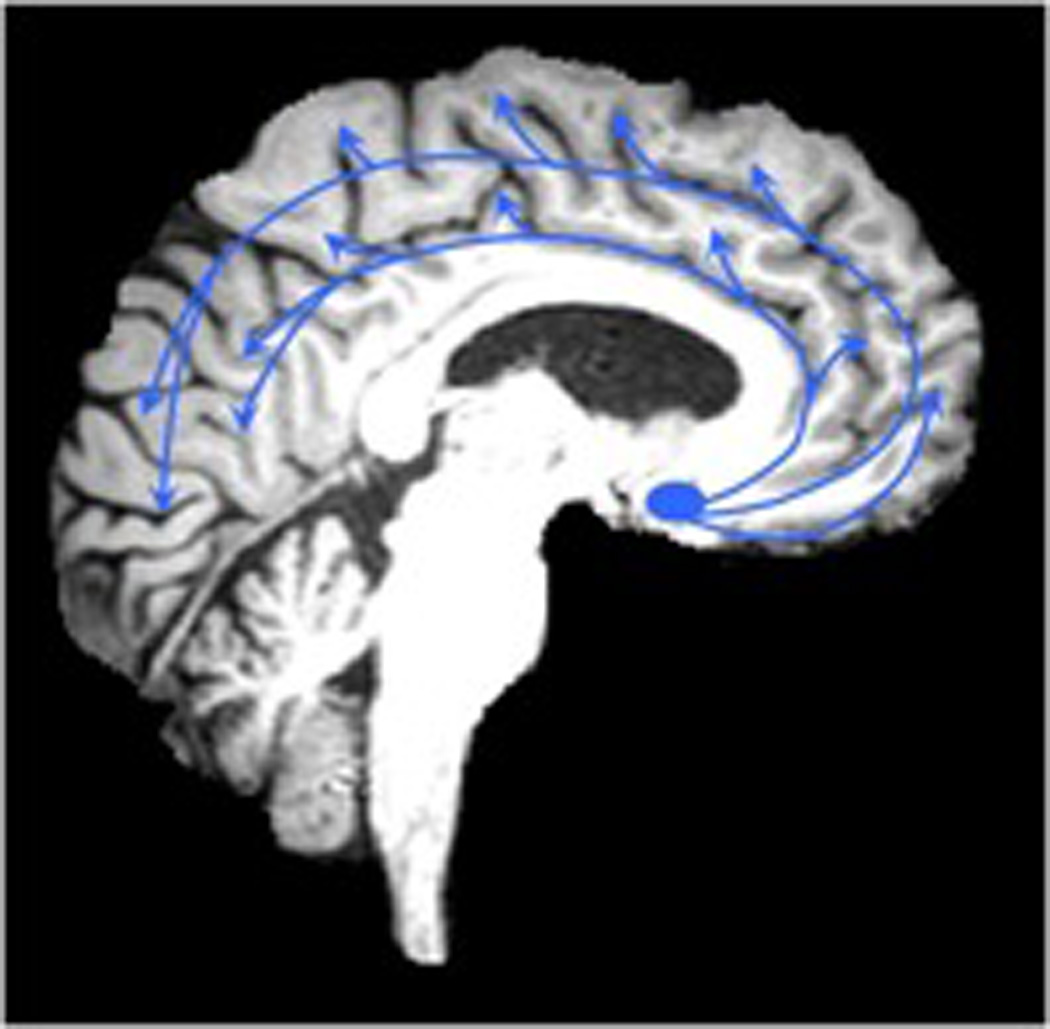
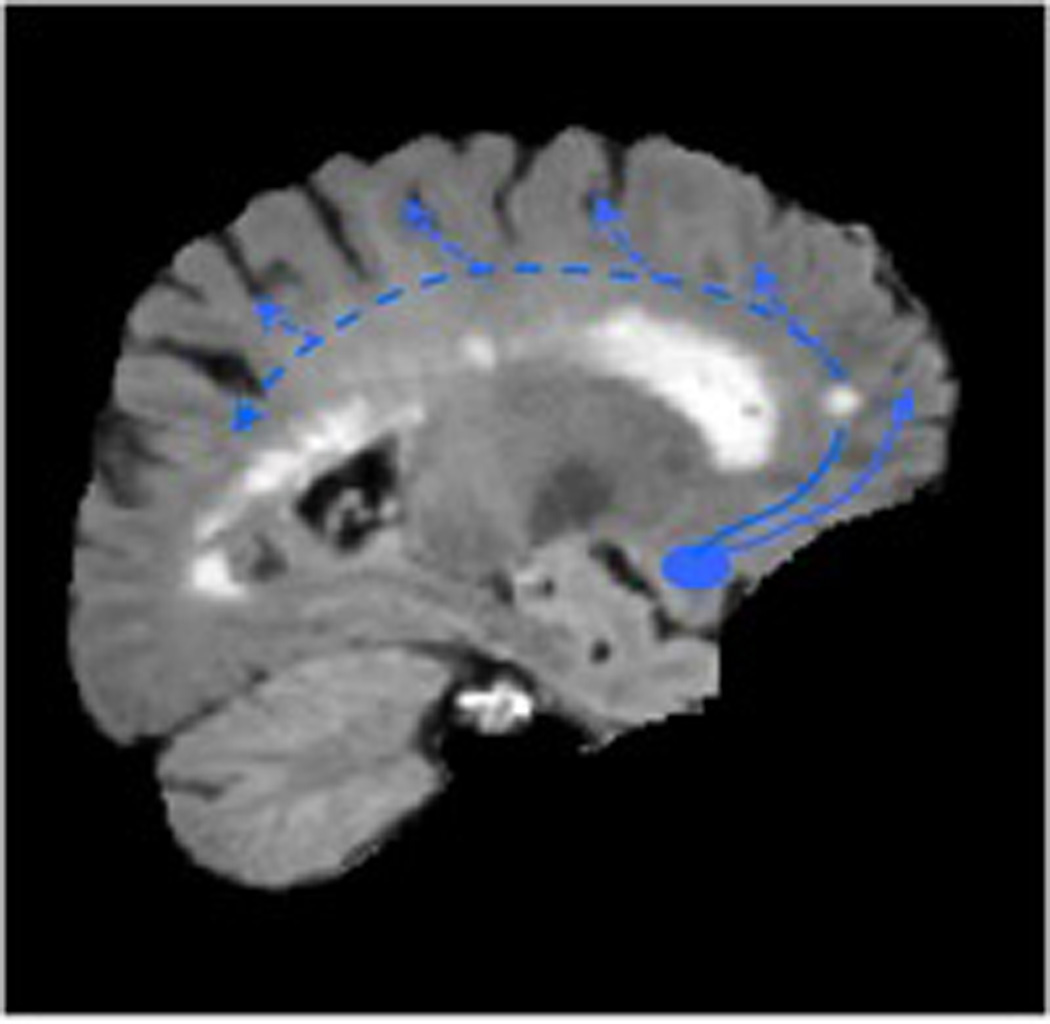
Cholinergic axonal projections in the brain originating from the nucleus basalis of Meynert (Figure 1A, left). White matter lesions in the deep forebrain identified on FLAIR MRI may partially disrupt these cholinergic pathways (Figure 1B, right)
C. Indirect clinical and imaging evidence of the cholinergic fiber disruption hypothesis by WML
There are several observations that may provide support for the notion that strategically located WML may disrupt cholinergic output fibers from the nbM. For example, a single case post-mortem study of Cerebral Autosomal Dominant Arteriopathy with Subcortical Infarcts and Leukoencephalopathy (CADASIL) demonstrated that cortical cholinergic projections from the nbM could be affected by purely subcortical ischemic lesions in the absence of Alzheimer pathology (10).
WML have also been recognized as a significant pathology in Alzheimer disease (AD), i.e. small vessel cerebrovascular disease may increase the likelihood of expressing dementia in those with co-occurring AD pathology (11). A possible mechanism to explain this observation is that WML may affect cholinergic projections and may exacerbate co-existing cortical cholinergic deficits that are typical for AD. For example, Bocti et al. found that ratings of such strategic locations of WML correlated better with cognitive impairment in AD than more global measures of WML (12). More findings in this line were provided Swartz et al. who showed that strategically located WML at the intersection with cholinergic pathways, contribute to cognitive, especially executive, impairment in patients with AD (13). In their study, Swartz and colleagues compared ratings of regional WML on brain MRI in a large series of elderly with cognitive impairment to published immunohistochemical tracings of cholinergic pathways. They found that moderate to severe cholinergic pathway involvement by WML was identified in 30% of patients with AD and in 60% of patients with vascular dementia (13).
Finally, with respect to cholinergic treatment, patients with AD who had strategically located subcortical WML affecting cholinergic projections had a better cognitive response, especially executive and working memory functions, to cholinesterase inhibitors compared to patients without such WML (14). Thus, cerebrovascular compromise of the cholinergic pathways may be a factor that contributes more selectively than does total non-selective white matter lesion burden in response to cholinergic therapy in AD.
D. In vivo imaging support for the cholinergic fiber disruption hypothesis by WML
D.1 Cholinergic in vivo imaging using PET or SPECT techniques
Positron emission tomography (PET) or single-photon emission computed tomography (SPECT) imaging studies allow the assessment of the regional distribution and quantitative measurement of neurotransmitters, enzymes or receptors in the living brain, and can be applied to examine cholinergic expression in vivo. Choline acetyltransferase (ChAT) and acetylcholinesterase (AChE) are the two ubiquitous constituents of cholinergic pathways of the human brain (15). A traditional presynaptic marker of cholinergic neurons, ChAT, has not been imaged successfully in vivo. Although there are no radioligands for ChAT, there are radiotracers for the vesicular acetylcholine transporter (VAChT) and AChE, that have been shown to map acetylcholine cells in the brain and to have a good correspondence with ChAT (15, 16).
AChE has been recognized since 1966 as a reliable marker for brain cholinergic pathways, including in the human brain (5, 17). AChE is localized predominantly in cholinergic cell bodies and axons. In the cortex, AChE is present in axons innervating it from the basal forebrain (5). There also is AChE in intrinsic cortical neurons and low levels of AChE are probably present in the non-cholinergic structures post-synaptic to the nucleus basalis innervation (18). AChE activity in the human brain has been mapped using PET with the [11C]PMP (19, 20) and [11C]MP4A (21) radioligands. These radioligands are acetylcholine analogues that serve as a selective substrate for AChE hydrolysis (22). The hydrolyzed radioligand becomes trapped as a hydrophilic product locally in the brain following the AChE biodistribution. Kuhl and colleagues (19) using [11C]PMP found a distribution of AChE activity that closely correlated with post–mortem histochemical distribution in normal volunteers (Figure 2).
Figure 2.
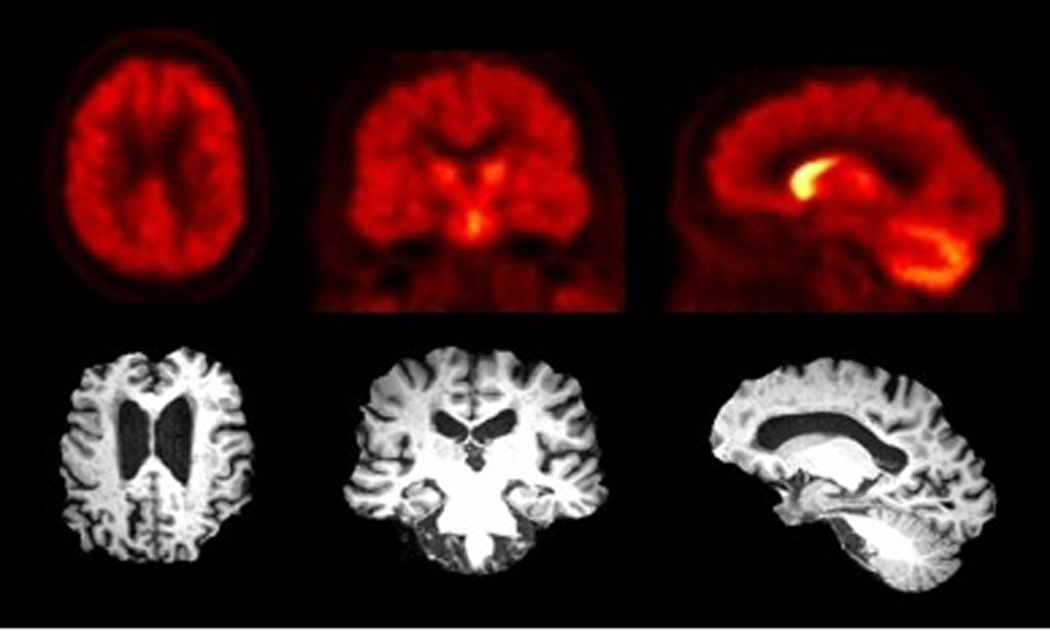
Transaxial (left), coronal (middle), and sagittal (right) slices of [11C]PMP AChE PET images (summed radioactivity images 0–25 minutes post-injection) and corresponding MRI slices showing normal AChE biodistribution with most intense uptake in the basal ganglia, followed by the cerebellum, with lower levels in the cortex.
The VAChT is localized in the acetylcholine nerve terminals and carry acetylcholine from the cytoplasm into the vesicles. Radiolabeling of these vesicular transporters would therefore provide a presynaptic marker of cholinergic innervation. Several radioligands that target the VAChT have been labeled (23). Of these, only (−)-5-[123I]iodobenzovesamicol ([IBVM), a SPECT radiotracer, has been used to image the living human brain (23). VAChT SPECT could also be used to study the integrity of cholinergic nerve terminals.
D.2 Visual assessment of periventricular and lobar WML on MRI
Although WML can be recognized on CT scans, MRI scans are most commonly used to identify WML, in particular T2-weighted or Fluid-Attenuated Inverse Recovery (FLAIR) sequences. WML appear as punctuate or more confluent hyperintense areas on these sequences and are, therefore, also often referred to as white matter hyperintensities. Several visual rating scales have been developed to estimate WML burden (24–27), each with an emphasis on different aspects of WML. A comprehensive scale was developed by Scheltens et al. (27), in which WML burden is assessed based on size and quantity of WML in a given neuroanatomical location, including periventricular and non-periventricular WML. Periventricular hyperintensities are further separated into frontal, occipital, and lateral aspects. Other rating scales of WML are the Brant-Zawadzki et al. scale (24) and the Cardiovascular Health Study Scale (26), both of which place relatively more emphasis on periventricular WML. However, unlike the Scheltens scale, the latter two rating scales do not specifically assess regional periventricular areas.
Periventricular WML are often proportional to overall burden of WML (28, 29). Given the neuroanatomical propensity to disrupt several projection axons, burden of WML around the frontal ventricular horns may be of particular interest. A recent study by our group found evidence that visual detection of frontal horn “capping” of WML, as defined by the Scheltens et al. scale, may serve as a simple screening biomarker for functionally more significant WML in the context of cortical cholinergic deafferentation (30).
Volumetric assessment of the volume of WML around the frontal horns may provide a more precise alternative to the Scheltens et al. scale for measuring frontal periventricular burden of WML. For example, the volume of frontal horns caps on FLAIR or T2-weighted MR images can be determined by tracing the volume of interest (VOI) around the outline of the hyperintense caps on multiple slices and summing the individual tracings into a single volume (Figure 3).
Figure 3.
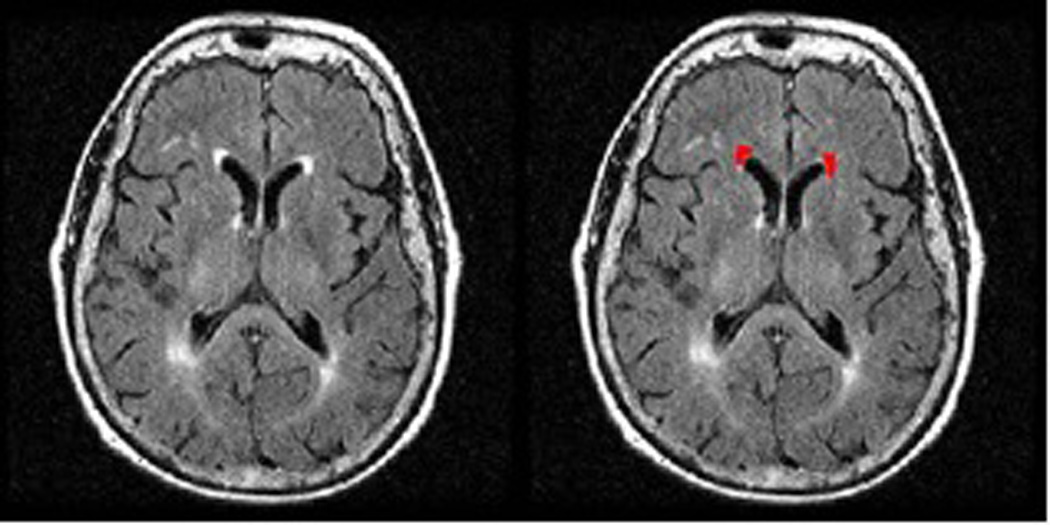
Example of volumetric assessment of WML burden of the periventricular frontal horn caps. VOIS are drawn on the FLAIR MRI slices and summed to get an estimate of WML volume of the frontal horns.
The above-described methods of semi-quantitative visual assessment of WML burden are limited by the fact that they are grader dependent. Inter-grader variability may affect the reliability of these measures and limit comparison across studies. Furthermore, with increasing magnet strength, white matter abnormalities become more detailed on MRI. Punctuate and confluent white matter areas can often be observed that appear to be below a sub-threshold hyperintensity, which sometimes are referred to as ‘dirty’ white matter. Inclusion of these ‘dirty’ white matter areas may result in relative overestimation of WML burden. More objective methods are therefore needed for a more reliable WML burden assessment.
D.3 Reference-based automated assessment of supratentorial hyperintense white matter voxels
Automated routines have been developed to define WML burden. These methods are typically based on segmentation of white matter MRI series, thresholding hyperintense white matter voxels, or “fuzzy” neighboring cluster-based voxel analysis. A different approach is based on the use of a reference region or tissue, such as intensity of normal gray matter (31) or the cerebellum. We have developed a routine where we use the mean intensity of cerebellar white matter voxels as a reference to define hyperintense supratentorial voxels. The cerebellum was chosen as a reference because of the clinical observation that age-associated WML, unlike diseases like multiple sclerosis, relatively spares the cerebellum. For example, we reviewed brain MRI FLAIR sequences of 104 community-dwelling subjects between the ages of 20–85. Ratings of the Scheltens et al. scale confirmed that the cerebellum is overall spared for age-associated white matter lesions. Ninety-five subjects had a cerebellar score of 0; 6 subjects had a score of 1; and 3 subjects has a score of 3. The mean score of cerebellar lesions was 0.1±0.5 which was <1% (0.66%) of the total supratentorial white matter ratings in these subjects (15.1±12.7).
We will now follow with a short technical description of our automated reference-based WML identification method. Volumetric SPGR (Spoiled Gradient Recall) sequences (TE=5, TR=25, flip angle=40 degrees, NEX=1, slice thickness=1.5 mm) and fast fluid-attenuated inversion recovery (FLAIR) (TR/TE = 9002/56 ms Ef; TI = 2200 ms, NEX = 1; slice thickness=5 mm) brain MRI sequences (without contrast) were obtained on a Signa 1.5 T GE scanner (GE Medical Systems, Milwaukee, WI). All axial sequences were obtained with a 24 cm field of view and a 192 × 256 pixel matrix.
Spatial preprocessing and WML identification was done using standard routines and functions in the software package SPM5 (32, 33). All MR images were normalized to the Montreal Neurological Institute (MNI) standard ICBM-152 template brain. The following steps were performed in SPM5 using default settings (Figure 4):
Co-registration of FLAIR image to SPGR image for each subject.
Normalization of SPGR images to the ICBM-152 template brain and application of SPGR normalization parameters to the FLAIR image.
Segmentation of SPGR images into white matter, grey matter, and cerebrospinal fluid. The white matter segmentation image is an underestimate of the white matter because some WML appear as grey matter on the SPGR. Therefore, step 8 is performed below to accurately identify WML not included in the original identification.
Masking of FLAIR image by SPGR white matter segmentation to produce a FLAIR white matter image (FLAIR WM image).
Masking of FLAIR WM image using template cerebellum VOI based on an averaged SPGR image from 16 older healthy controls.
Calculation of mean and standard deviation (SD) of voxel intensities within masked image of FLAIR cerebellum white matter.
Thresholding of FLAIR WM image to create FLAIR WML mask based on cerebellar white matter threshold (mean + 3SD). The FLAIR WML mask identifies WML on the FLAIR; however, it is an underestimate of burden of WML due to the issue of SPGR white matter segmentation described in step 3. Hence, step 8 is performed to identify WML adjacent to the FLAIR WML mask.
Overlaying of FLAIR WML mask on normalized FLAIR image and thresholding (mean + 3SD) of voxels immediately surrounding identified WML to create a more accurate FLAIR WML image.
Identification of region specific WML by masking of FLAIR WML image using regional masks included in the Wake Forest University PickAtlas software toolbox for SPM5 which includes the Talairach Daemon database;
Summing suprathreshold voxels in each volume of interest from the masked FLAIR WML image. Brain regions were summed for left and right hemispheres.
Figure 4.
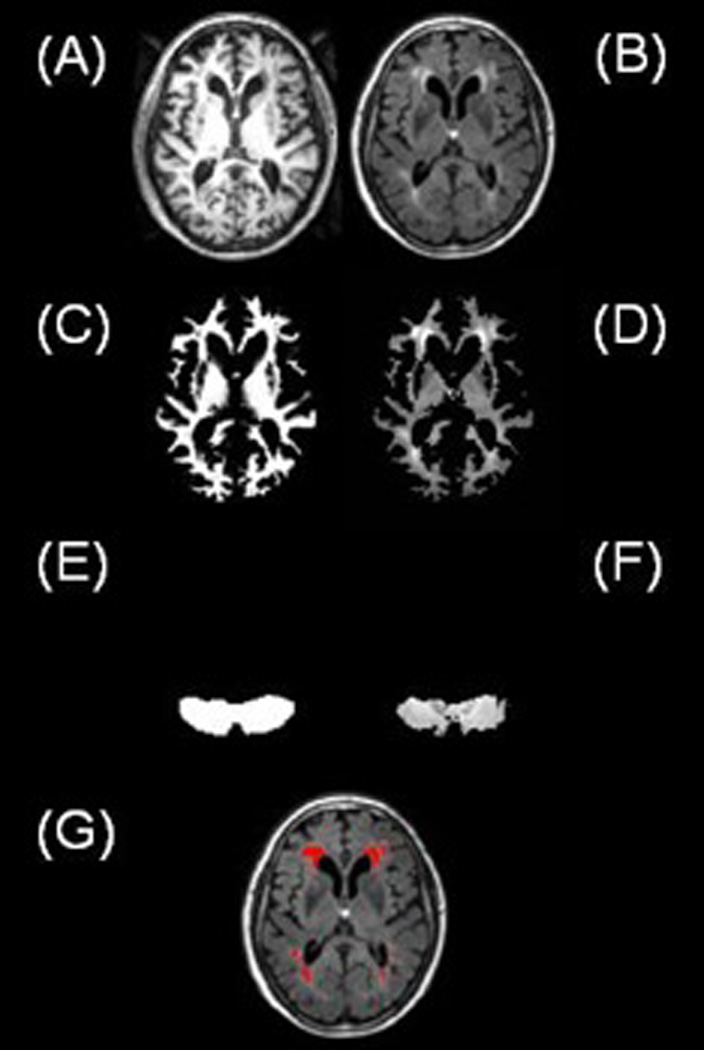
Main steps involved in the automated method of identifying FLAIR hyperintensities showing normalized SPGR (A) and normalized, coregistered FLAIR (B) slices. SPGR segmented white matter mask (C) is used to exclude cortical gray matter and extracerebral tissue on the coregistered FLAIR volume (D). The template brain cerebellar mask (E) is used to identify the cerebellum volume that is used for quantitative assessment of white matter signal intensities on the FLAIR volume (F). Suprathreshold voxels in the thresholded FLAIR white matter volume are depicted in red color (G).
D.4 Combined PET and MRI studies of age-associated WML and cortical cholinergic denervation
We recently reported on the in vivo findings of cortical AChE activity in subjects with variable degree of age-associated WML (30). Non-demented community dwelling middle-aged and elderly subjects (mean age 71.0±9.2; 55–84 years; n=18) underwent brain MRI and AChE PET imaging. The severity of periventricular and non-periventricular WMH on FLAIR MRI images was scored using the semi-quantitative rating scale of Scheltens et al (27). [11C]PMP AChE PET imaging was used to assess cortical AChE activity (34). The results of this study showed that the severity of periventricular (Rs= −0.52, P=0.04), but not non-periventricular (Rs= −0.20, ns), WML was inversely related to global cortical AChE activity. Regional cortical cholinergic effects of periventricular WML were most significant for the occipital lobe (30). There was no significant effect of cerebral atrophy to explain the study findings. These findings support a regionally specific disruption of cholinergic projection fibers by WML. Furthermore, the study found evidence that visual detection of frontal horn “capping” of WML may serve as a simple screening biomarker for functionally more significant WML in the context of cortical cholinergic deafferentation (30).
To further explore the utility of alternative WML burden assessment methods we performed additional MRI analyses of this data set using volumetric assessment of the frontal horn caps and our above described automated reference-based method.
We found that larger volume of frontal horn capping was associated with lower cortical AChE activity (Table 1; Figure 5). We also found that quantitative assessment of increased number of frontal lobe WML hyperintense voxels was associated with lower cortical AChE levels (Table 1). However, the Scheltens et al. rating scale for burden of WML in the frontal lobe was not significantly associated with cortical AChE activity, which may indicate a higher sensitivity of the automated method to identify WML.
Table 1.
Mean (SD) of measures of WML burden and their age-corrected partial correlation coefficients and significance levels with overall cortical AChE activity. Burden of frontal lobe WML (natural log transformation of the number of hyperintense voxels) from our reference-based automated method are expressed as percentage of the total white matter volume.
| Frontal periventricular WML Scheltens et al. ratings (27) |
Volume of frontal horn capping (mm3) |
Automated assessment of frontal lobe WML (% hyperintense voxels relative to cerebellum) |
||||
|---|---|---|---|---|---|---|
| Cortical | Mean (SD) | R= −0.517 | Mean (SD) | R= −0.511 | Mean (SD) | R= −0.592 |
| AChE activity |
2.33 (1.28) | P< 0.05 | 0.87 (0.65) | P< 0.05 | 0.67 (0.88) | P< 0.05 |
Figure 5.
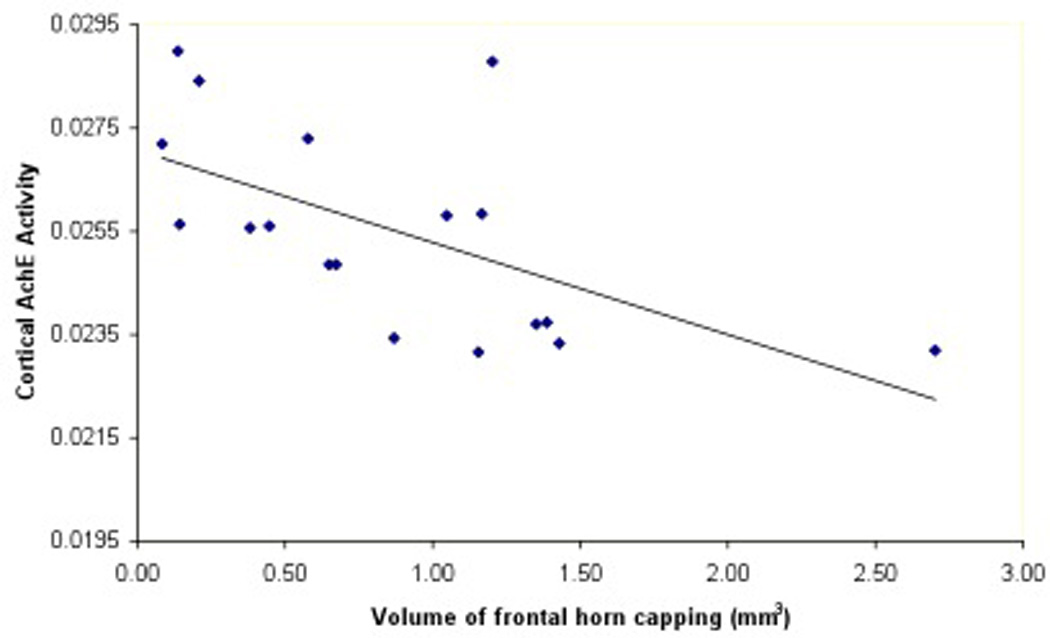
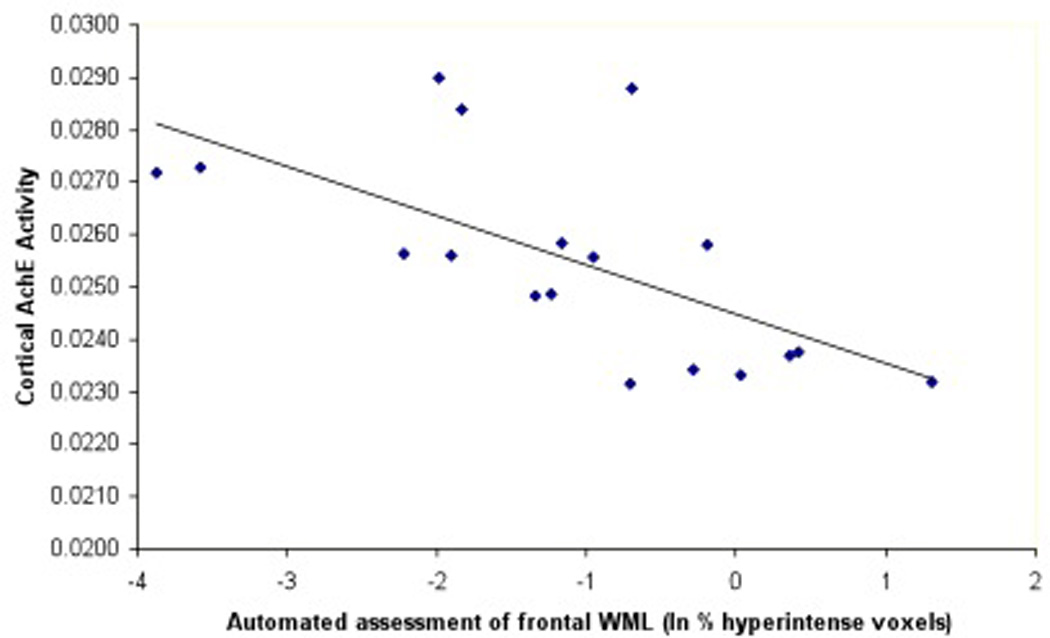
Scatter plots showing cortical AChE activity with frontal cap volume (5A) and cortical AChE activity with reference-based automated frontal lobe WML assessment (5B).
Although detailed ratings scales have been developed to provide semi-quantitative ratings of strategic locations of WML that may disrupt cholinergic projections (12), our data indicate that limited assessment of periventricular WML provides a simplified rating tool to estimate the impact on cortical cholinergic hypofunction. Furthermore, volumetric assessment of frontal horn “capping” of WMH may serve as a simple screening biomarker for functionally more significant leukoaraiosis (30).
E. Frontal periventricular white matter lesions may also disrupt non-cholinergic neuromodulatory axonal projections
Vertebrates have subcortical structures, known as neuromodulatory systems, which regulate fundamental behavior and provide the foundation for cognitive function in higher organisms. Attention, emotion, goal-directed behavior, and decision making all derive from the interaction between the neuromodulatory systems and areas such as the amygdala, cortex, and hippocampus (35). Ascending neuromodulatory systems include noradrenergic, dopaminergic, serotonergic, and cholinergic projections from the brainstem and basal forebrain regions to broad areas of the central nervous system (36). Each of these neuromodulator systems has a subcortical origin and projects a specific neurotransmitter to variable, often broad, areas of the cortex (Figure 6).
Figure 6.
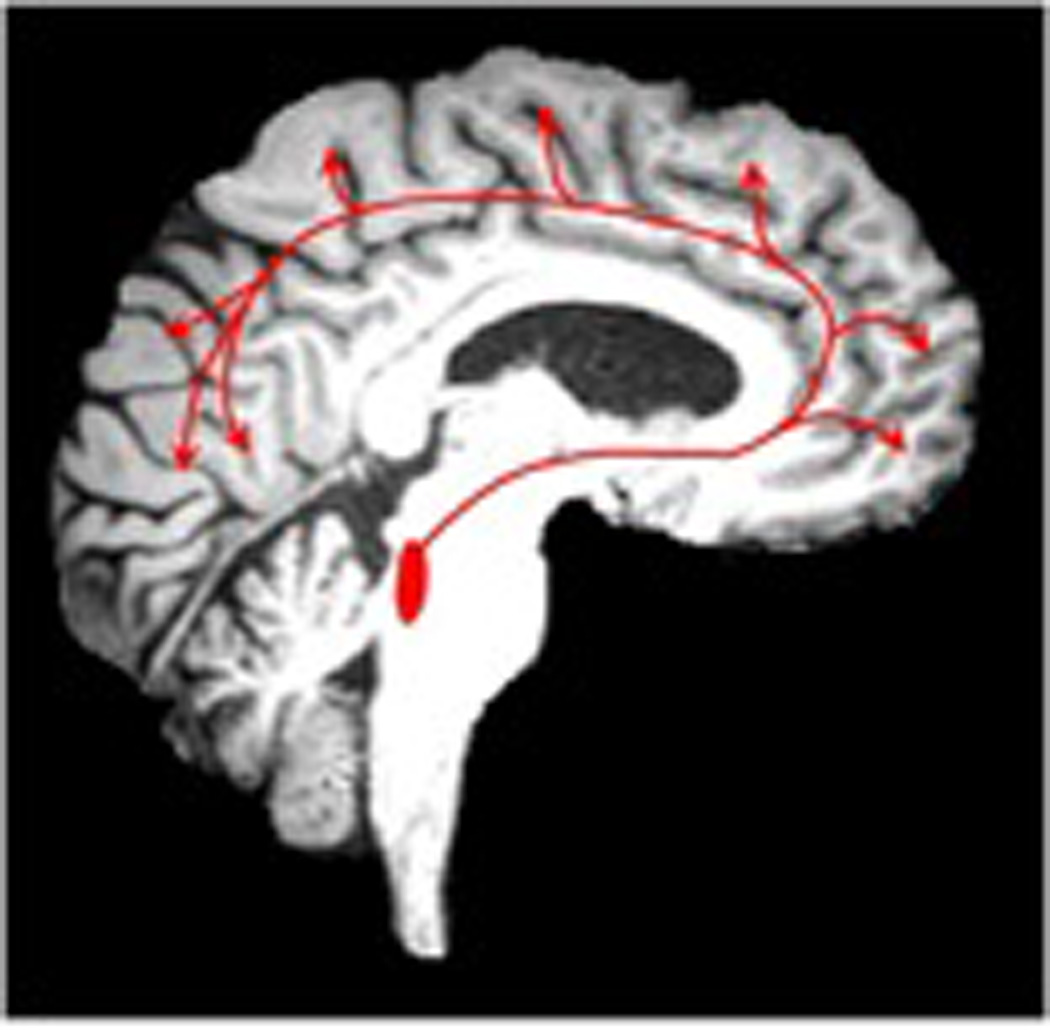
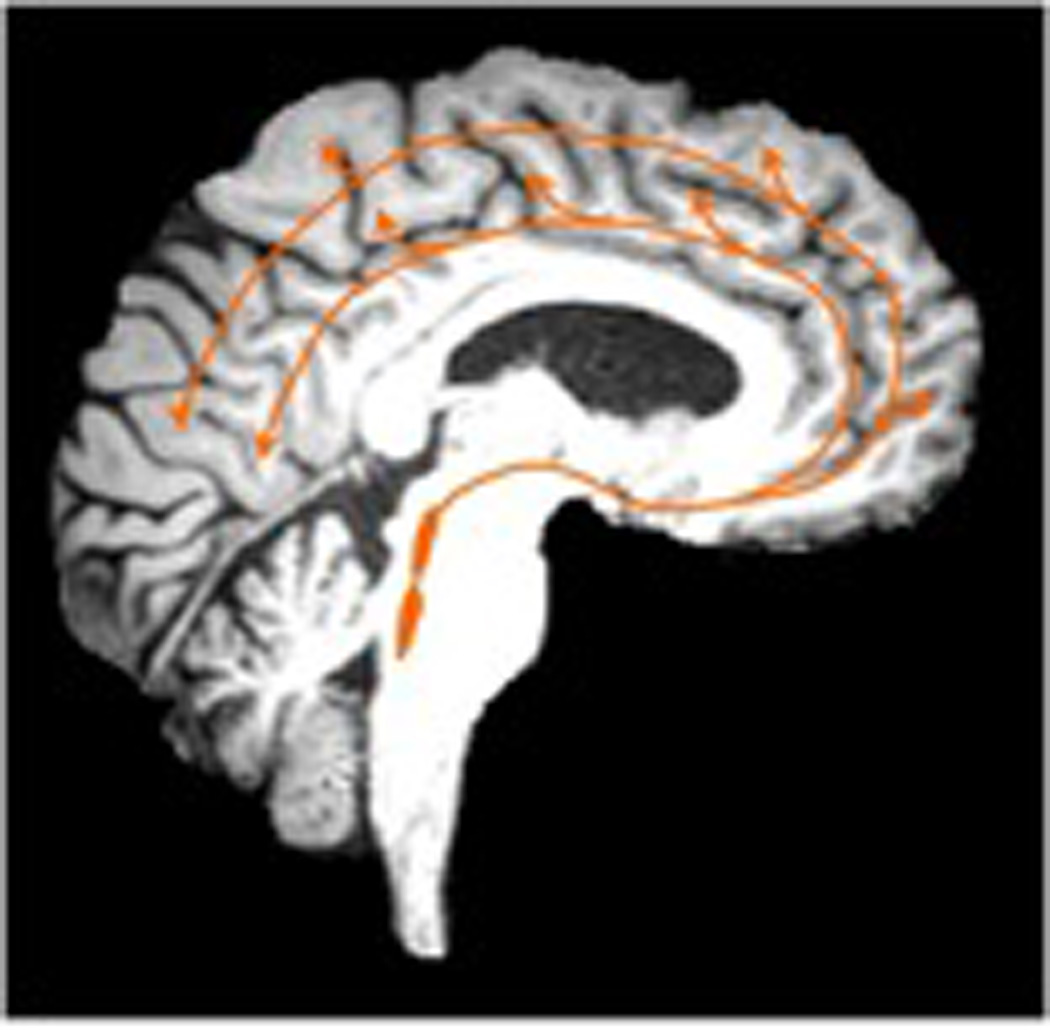
Cortical pathways of monoaminergic neurotransmitter systems. The dopamine cortical pathways (image left, green color, 6A) originate from the ventral tegmental area. Norepinephrine cortical pathways (middle image, red color, 6B) originate from the locus ceruleus. Serotonin cortical pathways (right) originate from the raphe nuclei (image right, orange color, 6C). Dopaminergic cortical projections are more limited to the mesiofrontal cortex whereas the other monoaminergic systems have more widespread cortical projects.
E.1 The mesocortical dopamine (DA) system
There are two major subtypes of dopaminergic neurons in the brain: the neurons of the substantia nigra pars compacta (A9 neurons) (37), which give rise to the nigrostriatal pathway; and the A10 neurons of the ventral tegmental area (VTA), which give rise to the mesolimbic and mesocortical pathways that innervate parts of the limbic system and the neocortex (38). The nucleus accumbens is the only non-cortical innervation area of the mesocortical dopamine system (39). The mesocortical projections include isocortical areas, including the mesial frontal, anterior cingulate, entorhinal, and perirhinal cortices, as well as allocortical areas including the olfactory tubercle and bulb, piriform cortex, nucleus accumbens and amygdaloid complex (39).
E.2 Cortical projections of norepinephrine (NE)
Norepinephrine in the central nervous system is produced by the locus ceruleus, which projects to virtually all brain regions with the exception of the basal ganglia, nucleus accumbens and olfactory tubercle (40, 41). It was the work of Ungerstedt in particular that demonstrated the extensive innervation of telencephalic structures by locus ceruleus neurons (42). The ascending fibers of the locus ceruleus projection that enter the medial forebrain bundle give rise to several distinct group of fibers. The largest of these is made up of fascicles of fibers that leave the medial forebrain bundle laterally and part of these enter basal telencephalic areas, whereas others continue into the external capsule. Finally, there is a group of fibers that turn around the genu of the corpus callosum and then run caudally in the cingulum (40).
E.3 Cortical projections of serotonin (5HT)
Serotonergic projections, which mainly originate in the raphe nuclei of the brainstem have broad cortical projections. Serotonergic projections to the cortex arise primarily from the dorsal raphe nucleus and medial raphe nucleus (43). The dorsal raphe nucleus consists primarily of ipsilateral projections to the frontal cortex while the medial raphe nucleus projects bilaterally to frontal, parietal and occipital cortices (43).
E.4 Monoaminergic pathways and WML
The NE and 5HT pathways have more widespread cortical projects whereas DA cortical projections are more limited to the mesiofrontal cortex. WML may also interrupt these monoaminergic pathways, which could explain some of the other behavioral consequences of age-associated WML such as depression and increased risk of falling. Although specific in vivo cortical assessment of presynaptic DA and NE functions is limited because of low binding levels at the cortex (44), [18F]6-Fluorodopa (FDOPA) PET could be used to assess for combined monoaminergic cortical deafferentation in the presence of white matter lesions (45). Serotonin transporter ligands, such as [11C]DASB (46), can be used for specific assessment of serotonergic cortical cholinergic deafferentation. Future studies are needed to further explore the effects of WML on the deafferentation of cortical monoaminergic pathways and the behavioral or clinical consequences thereof.
Conclusions
Recent in vivo imaging findings indicate that WML previously described as “non-specific”, when in strategic locations such as the frontal or periventricular regions, can be associated with cortical cholinergic deafferentation. These findings support a regionally specific disruption of cholinergic projection fibers by WML and may augur novel therapeutic approaches to treating cognitive symptoms of WML in the elderly. Neurochemical imaging techniques are available to test the hypothesis that frontal or periventricular forebrain WML may also disrupt monoaminergic projections that pass through the deep forebrain before innervating the neocortex.
Abbreviations
- AChE
acetylcholinesterase
- AD
Alzheimer’s disease
- CADASIL
Cerebral Autosomal Dominant Arteriopathy with Subcortical Infarcts and Leukoencephalopathy
- ChAT
choline acetyl-transferase
- DA
dopamine
- DTI
diffusion tensor imaging
- MRI
magnetic resonance imaging
- nbM
nucleus basalis of Meynert
- NE
norepinephrine
- 5HT
serotonin
- SPECT
single photon emission computed tomography
- PET
positron emission tomography
- VAChT
vesicular acetylcholine transporter
- VOI
volume of interest
- WML
white matter lesions
References
- 1.Pantoni L, Garcia JH. Pathogenesis of leukoaraiosis. Stroke. 1997;28:652–659. doi: 10.1161/01.str.28.3.652. [DOI] [PubMed] [Google Scholar]
- 2.Gunning-Dixon FM, Raz N. The cognitive correlates of white matter abnormalities in normal aging: A quantitative review. Neuropsychology. 2000;14:224–232. doi: 10.1037//0894-4105.14.2.224. [DOI] [PubMed] [Google Scholar]
- 3.Au R, Massaro JM, Wolf PA, Young ME, Beiser A, Seshadri S, et al. Association of white matter hyperintensity volume with decreased cognitive functioning: the Framingham Heart Study. Arch Neurol. 2006;63:246–250. doi: 10.1001/archneur.63.2.246. [DOI] [PubMed] [Google Scholar]
- 4.Baezner H, Blahak C, Poggesi A, Pantoni L, Inzitari D, Chabriat H, et al. Association of gait and balance disorders with age-related white matter changes: the LADIS study. Neurology. 2008;70:935–942. doi: 10.1212/01.wnl.0000305959.46197.e6. [DOI] [PubMed] [Google Scholar]
- 5.Selden NR, Gitelman DR, Salamon-Murayama N, Parrish TB, Mesulam MM. Trajectories of cholinergic pathways within the cerebral hemispheres of the human brain. Brain. 1998;121:2249–2257. doi: 10.1093/brain/121.12.2249. [DOI] [PubMed] [Google Scholar]
- 6.Mesulam MM, Geula C. Nucleus basalis (Ch4) and cortical cholinergic innervation in the human brain: Observations based on the distribution of acetylcholinesterase and choline acetyltransferase. J Comp Neurol. 1988;275:216–240. doi: 10.1002/cne.902750205. [DOI] [PubMed] [Google Scholar]
- 7.Wen W, Sachdev P. The topography of white matter hyperintensities on brain MRI in healthy 60- to 64-year-old individuals. Neuroimage. 2004;22:144–154. doi: 10.1016/j.neuroimage.2003.12.027. [DOI] [PubMed] [Google Scholar]
- 8.Pawlak M, Krejza J. A new visual scale to assess white matter hyperintensities within cholinergic pathways. Stroke. 2005;36:2064–2065. [PubMed] [Google Scholar]
- 9.Schuff N, Capizzano AA, Du AT, Amend DL, O'Neill J, Norman D, et al. Different patterns of N-acetylaspartate loss in subcortical ischemic vascular dementia and AD. Neurology. 2003;61:358–364. doi: 10.1212/01.wnl.0000078942.63360.22. [DOI] [PMC free article] [PubMed] [Google Scholar]
- 10.Mesulam M, Siddique T, Cohen B. Cholinergic denervation in a pure multi-infarct state: observations on CADASIL. Neurology. 2003;60:1183–1185. doi: 10.1212/01.wnl.0000055927.22611.eb. [DOI] [PubMed] [Google Scholar]
- 11.Snowdon DA, Greiner LH, Mortimer JA, Riley KP, Greiner PA, Markesbery WR. Brain infarction and the clinical expression of Alzheimer disease. The Nun Study. JAMA. 1997;277:813–817. [PubMed] [Google Scholar]
- 12.Bocti C, Swartz RH, Gao FQ, Sahlas DJ, Behl P, Black SE. A new visual rating scale to assess strategic white matter hyperintensities within cholinergic pathways in dementia. Stroke. 2005;36:2126–2131. doi: 10.1161/01.STR.0000183615.07936.b6. [DOI] [PubMed] [Google Scholar]
- 13.Swartz RH, Sahlas DJ, Black SE. Strategic involvement of cholinergic pathways and executive dysfunction: Does location of white matter signal hyperintensities matter? J Stroke Cerebrovasc Dis. 2003;12:29–36. doi: 10.1053/jscd.2003.5. [DOI] [PubMed] [Google Scholar]
- 14.Behl P, Bocti C, Swartz RH, Gao F, Sahlas DJ, Lanctot KL, et al. Strategic subcortical hyperintensities in cholinergic pathways and executive function decline in treated Alzheimer patients. Arch Neurol. 2007;64:266–272. doi: 10.1001/archneur.64.2.266. [DOI] [PubMed] [Google Scholar]
- 15.Mesulam MM, Geula C. Overlap between acetylcholinesterase-rich and choline acetyltransferase-positive (cholinergic) axons in human cerebral cortex. Brain Res. 1992;577:112–120. doi: 10.1016/0006-8993(92)90543-i. [DOI] [PubMed] [Google Scholar]
- 16.Weihe E, Tao-Cheng JH, Schafer MK, Erickson JD, Eiden LE. Visualization of the vesicular acetylcholine transporter in cholinergic nerve terminals and its targeting to a specific population of small synaptic vesicles. Proc Natl Acad Sci U S A. 1996;93:3547–3552. doi: 10.1073/pnas.93.8.3547. [DOI] [PMC free article] [PubMed] [Google Scholar]
- 17.Shute CC, Lewis PR. Electron microscopy of cholinergic terminals and acetylcholinesterase-containing neurones in the hippocampal formation of the rat. Z Zellforsch Mikrosk Anat. 1966;69:334–343. doi: 10.1007/BF00406286. [DOI] [PubMed] [Google Scholar]
- 18.Heckers S, Geula C, Mesulam MM. Acetylcholinesterase-rich pyramidal neurons in Alzheimer's disease. Neurobiol Aging. 1992;13:455–460. doi: 10.1016/0197-4580(92)90072-6. [DOI] [PubMed] [Google Scholar]
- 19.Kuhl D, Koeppe R, Snyder S, Minoshima S, Frey K, Kilbourn M. Mapping acetylcholinesterase activity in human brain using PET and N-[11C]Methylpiperidinyl propionate (PMP) J Nucl Med. 1996;37(Suppl):21P. [Google Scholar]
- 20.Kuhl DE, Koeppe RA, Minoshima S, Snyder SE, Ficaro EP, Foster NL, et al. In vivo mapping of cerebral acetylcholinesterase activity in aging and Alzheimer's disease. Neurology. 1999;52:691–699. doi: 10.1212/wnl.52.4.691. [DOI] [PubMed] [Google Scholar]
- 21.Iyo M, Namba H, Fukushi K, Shinotoh H, Nagatsuka S, Suhara T, et al. Measurement of acetylcholinesterase by positron emission tomography in the brain of healthy controls and patients with Alzheimer's disease. Lancet. 1997;349:1805–1809. doi: 10.1016/S0140-6736(96)09124-6. [DOI] [PubMed] [Google Scholar]
- 22.Irie T, Fukushi K, Akimoto Y, Tamagami H, Nozaki T. Design and evaluation of radioactive acetylcholine analogs for mapping brain acetylcholinesterase (AChE) in vivo. Nucl Med Biol. 1994;21:801–808. doi: 10.1016/0969-8051(94)90159-7. [DOI] [PubMed] [Google Scholar]
- 23.Kuhl DE, Koeppe RA, Fessler JA, Minoshima S, Ackermann RJ, Carey JE, et al. In vivo mapping of cholinergic neurons in the human brain using SPECT and IBVM. J Nucl Med. 1994;35:405–410. [PubMed] [Google Scholar]
- 24.Brant-Zawadzki M, Fein G, Van Dyke C, Kiernan R, Davenport L, de Groot J. MR imaging of the aging brain: patchy white-matter lesions and dementia. Am J Neuroradiol. 1985;6:675–682. [PMC free article] [PubMed] [Google Scholar]
- 25.Fazekas F, Chawluk JB, Alavi A, Hurtig HI, Zimmerman RA. MR signal abnormalities at 1.5 T in Alzheimer's dementia and normal aging. AJR Am J Roentgenol. 1987;149:351–356. doi: 10.2214/ajr.149.2.351. [DOI] [PubMed] [Google Scholar]
- 26.Longstreth WT, Manolio TA, et al. Clinical correlates of white matter findings on cranial magnetic resonance imaging of 3,301 elderly people: the cardiovascular health study. Stroke. 1996;27:1274–1282. doi: 10.1161/01.str.27.8.1274. [DOI] [PubMed] [Google Scholar]
- 27.Scheltens P, Barkhof F, Leys D, Pruvo JP, Nauta JJ, Vermersch P, et al. A semiquantative rating scale for the assessment of signal hyperintensities on magnetic resonance imaging. J Neurol Sci. 1993;114:7–12. doi: 10.1016/0022-510x(93)90041-v. [DOI] [PubMed] [Google Scholar]
- 28.DeCarli C, Fletcher E, Ramey V, Harvey D, Jagust WJ. Anatomical mapping of white matter hyperintensities (WMH): exploring the relationships between periventricular WMH, deep WMH, and total WMH burden. Stroke. 2005;36:50–55. doi: 10.1161/01.STR.0000150668.58689.f2. [DOI] [PMC free article] [PubMed] [Google Scholar]
- 29.Barkhof F, Scheltens P. Is the whole brain periventricular? J Neurol Neurosurg Psychiatry. 2006;77:143–144. doi: 10.1136/jnnp.2005.075101. [DOI] [PMC free article] [PubMed] [Google Scholar]
- 30.Bohnen NI, Muller ML, Kuwabara H, Constantine GM, Studenski SA. Age-associated leukoaraiosis and cortical cholinergic deafferentation. Neurology. 2009;72:1411–1416. doi: 10.1212/WNL.0b013e3181a187c6. [DOI] [PMC free article] [PubMed] [Google Scholar]
- 31.de Boer R, Vrooman HA, van der Lijn F, Vernooij MW, Ikram MA, van der Lugt A, et al. White matter lesion extension to automatic brain tissue segmentation on MRI. Neuroimage. 2009;45:1151–1161. doi: 10.1016/j.neuroimage.2009.01.011. [DOI] [PubMed] [Google Scholar]
- 32.Ashburner J, Friston K. Multimodal image coregistration and partitioning-a unified framework. Neuroimage. 1997;6:209–217. doi: 10.1006/nimg.1997.0290. [DOI] [PubMed] [Google Scholar]
- 33.Ashburner J, Friston KJ. Unified segmentation. Neuroimage. 2005;26:839–851. doi: 10.1016/j.neuroimage.2005.02.018. [DOI] [PubMed] [Google Scholar]
- 34.Nagatsuka S, Fukushi K, Shinotoh H, Namba H, Iyo M, Tanaka N, et al. Kinetic analysis of [(11)C]MP4A using a high-radioactivity brain region that represents an integrated input function for measurement of cerebral acetylcholinesterase activity without arterial blood sampling. J Cereb Blood Flow Metab. 2001;21:1354–1366. doi: 10.1097/00004647-200111000-00011. [DOI] [PubMed] [Google Scholar]
- 35.Krichmar JL. The neuromodulatory sysem: A framework for survival and adaptive behavior in a challenging world. Adaptive Behavior. 2008;16:385. [Google Scholar]
- 36.Briand LA, Gritton H, Howe WM, Young DA, Sarter M. Modulators in concert for cognition: modulator interactions in the prefrontal cortex. Prog Neurobiol. 2007;83:69–91. doi: 10.1016/j.pneurobio.2007.06.007. [DOI] [PMC free article] [PubMed] [Google Scholar]
- 37.Dahlstrom A, Fuxe K. Evidence for the existence of monoamine-containing neurons in the central nervous system. I. Demonstration of monoamines in the cell bodies of brain stem neurons. Acta Physiol Scand. 1964;62(Suppl 232):231–55. [PubMed] [Google Scholar]
- 38.Bjorklund A, Lindvall O. Bjorklund A, Hokfelt T. Handbook of chemical neuroanatomy. Amsterdam: Elsevier; 1984. Dopamine-containing systems in the CNS; pp. 55–122. [Google Scholar]
- 39.Moore RY, Bloom FE. Central catecholamine neuron systems: anatomy and physiology of the dopamine systems. Annu Rev Neurosci. 1978;1:129–169. doi: 10.1146/annurev.ne.01.030178.001021. [DOI] [PubMed] [Google Scholar]
- 40.Moore RY, Bloom FE. Central catecholamine neuron systems: anatomy and physiology of the norepinephrine and epinephrine systems. Annu Rev Neurosci. 1979;2:113–168. doi: 10.1146/annurev.ne.02.030179.000553. [DOI] [PubMed] [Google Scholar]
- 41.Berridge CW, Waterhouse BD. The locus coeruleus-noradrenergic system: modulation of behavioral state and state-dependent cognitive processes. Brain Res Brain Res Rev. 2003;42:33–84. doi: 10.1016/s0165-0173(03)00143-7. [DOI] [PubMed] [Google Scholar]
- 42.Ungerstedt U. Stereotaxic mapping of the monoamine pathways in the rat brain. Acta Physiol Scand. 1971;367:1–48. doi: 10.1111/j.1365-201x.1971.tb10998.x. [DOI] [PubMed] [Google Scholar]
- 43.O'Hearn E, Molliver ME. Organization of raphe-cortical projections in rat: a quantitative retrograde study. Brain Res Bull. 1984;13:709–726. doi: 10.1016/0361-9230(84)90232-6. [DOI] [PubMed] [Google Scholar]
- 44.Bohnen NI, Frey KA. Imaging of cholinergic and monoaminergic neurochemical changes in neurodegenerative disorders. Mol Imaging Biol. 2007;9:243–257. doi: 10.1007/s11307-007-0083-6. [DOI] [PubMed] [Google Scholar]
- 45.Garnett ES, Firnau G, Nahmias C. Dopamine visualized in the basal ganglia of living man. Nature. 1983;305:137–138. doi: 10.1038/305137a0. [DOI] [PubMed] [Google Scholar]
- 46.Frankle WG, Huang Y, Hwang DR, Talbot PS, Slifstein M, Van Heertum R, et al. Comparative evaluation of serotonin transporter radioligands 11C-DASB and 11C-McN 5652 in healthy humans. J Nucl Med. 2004;45:682–694. [PubMed] [Google Scholar]


