Abstract
The microflora-sparing properties of fidaxomicin were examined during the conduct of a randomized clinical trial comparing vancomycin 125 mg 4 times per day versus fidaxomicin 200 mg twice per day for 10 days as treatment of Clostridium difficile infection (CDI). Fecal samples were obtained from 89 patients (45 received fidaxomicin, and 44 received vancomycin) at study entry and on days 4, 10, 14, 21, 28, and 38 for quantitative cultures for C. difficile and cytotoxin B fecal filtrate concentrations. Additionally, samples from 10 patients, each receiving vancomycin or fidaxomicin, and 10 samples from healthy controls were analyzed by quantitative real-time polymerase chain reaction with multiple group-specific primers to evaluate the impact of antibiotic treatment on the microbiome. Compared with controls, patients with CDI at study entry had counts of major microbiome components that were 2–3-log10 colony-forming units (CFU)/g lower. In patients with CDI, fidaxomicin allowed the major components to persist, whereas vancomycin was associated with a further 2–4-log10 CFU reduction of Bacteroides/Prevotella group organisms, which persisted to day 28 of the study, and shorter term and temporary suppression of both Clostridium coccoides and Clostridium leptum group organisms. In the posttreatment period, C. difficile counts similarly persisted in both study populations, but reappearance of toxin in fecal filtrates was observed in 28% of vancomycin-treated patient samples (29 of 94), compared with 14% of fidaxomicin-treated patient samples (13 of 91; P = .03). Similarly, 23% of vancomycin-treated patients (10 of 44) and 11% of fidaxomicin-treated patients (5 of 44) had recurrence of CDI. Whereas vancomycin and fidaxomicin are equally effective in resolving CDI symptoms, preservation of the microflora by fidaxomicin is associated with a lower likelihood of CDI recurrence.
Clinical Trials Registration. NTC00314951.
In the past decade, clinical response rates for treatment of Clostridium difficile infection (CDI) with metronidazole have declined from an earlier high rate of approximately 90% [1] to rates in the 70% range [2–5]. Vancomycin has maintained its high cure rate over 3 decades of use for treatment of CDI. Both treatments are suboptimal because of recurrence rates of 20%–24% [6, 7] and select for vancomycin-resistant enterococci (VRE) acquisition [8]. Higher rates of recurrence are observed in patients who have multiple recurrences [9], with some patients resorting to fecal flora transplantation to arrest multiple recurrences [10]. These clinical challenges have been the driving force to discover and evaluate new treatments for CDI.
Fidaxomicin, a novel narrow-spectrum macrocycle antibiotic, recently was approved for treatment of CDI by the US Food and Drug Administration after results of 2 parallel randomized clinical trials showed that clinical cure rates for CDI were comparable to those of the comparator, vancomycin, but recurrence of CDI in respondents to therapy was reduced by almost 50% in the 28-day posttreatment observation interval [11, 12]. The biological basis of reduced recurrence is hypothesized to be due to (1) reduction in C. difficile vegetative and/or spore forms during and after treatment and/or (2) decreased impact on the normal protective microbiota (ie, less impairment of colonization resistance) [13].
The microflora-sparing properties of fidaxomicin were suggested on the basis of sustained cure of C. difficile challenge in the hamster model [14], the absence of activity against obligate gram-negative anaerobes and variable activity against gram-positive organisms [15, 16], a low recurrence rate of CDI in the phase II dose-ranging trial on the treatment of CDI [17], sparing of Bacteroides species as a marker of the normal flora [18], and persistence of Firmicutes with fluorescence in situ hybridization studies involving fecal samples obtained during the phase II study [19]. In this report, a subset of patients who were randomly assigned to receive vancomycin or fidaxomicin treatment of CDI in the first registration trial [11] submitted additional fecal samples for examination of the microflora-sparing properties of the study antibiotics and to quantify C. difficile counts and C. difficile cytotoxin B concentrations in fecal filtrates during and after treatment of CDI.
METHODS
As part of a 629-patient, randomized, double-blind, multicenter clinical trial [11], 89 patients seen at the Foothills Medical Center (Calgary, Canada) receive a 10-day course of vancomycin 125 mg 4 times daily or 200 mg twice daily of fidaxomicin orally as treatment of first episodes or first recurrences of CDI. Patients submitted fecal samples, >10 g/sample, at study entry; on days 4, 10, 14, 21, and 28; and on day 38–42 days. With the exception of specimens collected on weekends, which were refrigerated at 2°C–8°C for processing on the following Monday, 1-g aliquots of the samples were processed on the collection date for quantitative counts of C. difficile by serial dilution (10−2, 10−3, 10−5, and 10−7) and plated onto cycloserine cefoxitin fructose agar (CCFA), modified by using Fastidious Anaerobe Agar Base (LabM, Bury, United Kingdom). An additional 1-g aliquot was subjected to 100% ethyl alcohol shock (1:1 vol/vol × 1-hour exposure) and plated onto taurocholate-CCFA with the same dilution scheme as that used for total C. difficile counts. C. difficile cytotoxin B in fecal filtrates was measured by cell cytotoxicity assay, using Vero cells with neutralization of cytotoxicity (Techlab, Blacksburg, VA). The toxin titer end point was the concentration showing 50% cell rounding; titration range was 1/20–1/32 000. To avoid confounding by concomitant antibiotic therapy for other indications, patients who required such therapy were not recruited for the trial. Ten subjects who were in good health and using no antibiotics or medications donated fecal samples to serve as normal flora controls.
Fecal samples from 10 vancomycin- and 10 fidaxomicin-treated patients who had received no prior treatment for CDI before entry into the study, had sustained clinical cures of CDI (ie, cure with recurrence) and provided all samples to day 28 and variably to day 38–42 were selected for microbiome characterization. Additionally, patients who experienced recurrence of CDI were similarly tested. The state of the microbiome was evaluated by quantitative real-time polymerase chain reaction (qPCR), using previously published primers (Table 1) and methods [20–25]. Bacterial DNA from 250 mg of fecal sample was extracted using the QIAamp DNA Stool Mini Kit (QIAGEN, Mississauga, Canada). Following the addition of lysis buffer and 200 mg of zirconium beads (diameter, 0.2 mm), the sample was bead beaten. Purified genomic DNA (gDNA) was eluted off the columns with 200 μL of molecular-grade water. The bacterial gDNA was checked for purity and concentration, using the NanoDrop 2000 Spectrophotometer (Thermo Scientific, Wilmington, DE). Yield (in nanograms of DNA per milligram of stool) was calculated in samples, after which they were stored at −20°C for later analysis. qPCR was performed using iQ5 and CFX96 detection systems (Biorad, Mississauga, Canada). Amplification and detection were conducted in 96-well plates with SYBR Green 2 × qPCR Master Mix (BioRad). Each sample was run in duplicate in a final volume of 20 μL containing a final concentration of 0.3 μM of each primer and 5 μL of 4-ng/μL template gDNA. Amplifications were conducted using the 2-step template ramping profile: 1 cycle at 95°C for 5 minutes, followed by 49 cycles at 95°C for 30 seconds, 52°C–60°C for 30 seconds, and 72°C for 30 seconds.
Table 1.
16S Ribosomal RNA Probes Used for Quantitative Real-Time Polymerase Chain Reaction to Quantify Shifts in Major Components of the Fecal Flora During and After Treatment of Clostridium difficile Infection
| Group | Name | Sequence | Reference |
|---|---|---|---|
| Bacteroides | Bac303F | GAAGGTCCCCCACATTG | Bernhard et al [20], 2000 |
| Bacteroides | Bac708R | CAATCGGAGTTCTTCGTG | Bernhard et al [20], 2000 |
| Enterobacteriaceae | Eco1457F | CATTGACGTTACCCGCAGAAGAAGC | Bartosch et al [21], 2004 |
| Enterobacteriaceae | Eco1652 | CTCTACGAGACTCAAGCTTGC | Bartosch et al [21], 2004 |
| Clostridium leptum subgroup | sg-clept-F | GCACAAGCAGTGGAGT | Matsuki et al [22], 2002 |
| C. leptum subgroup | sg-clept-R | CTTCCTCCGTTTGTCAA | Matsuki et al [22], 2002 |
| Clostridium coccoides group | Erec482R | GCTTCTTAGTCARGTACCG | probeBase pB-00963 |
| C. coccoides group | Eub338F | ACTCCTACGGGAGGCAGC | probeBasepB-00159 |
| C. difficile | g-cdif-F | TTGAGCGATTTACTTCGGTAAAGA | Rinttilä et al [23], 2004 |
| C. difficile | g-cdif-R | CCATCCTGTACTGGCTCACCT | Rinttilä et al [23], 2004 |
| Desulfovibrio desulfuricans group | g-desulf-F | GGTACCTTCAAAGGAAGCAC | Rinttilä et al [23], 2004 |
| D. desulfuricans group | g-desulf-R | GGGATTTCACCCCTGACTTA | Rinttilä et al [23], 2004 |
| Enterococcus species | g-enter-F | CCCTTATTGTTAGTTGCCATCATT | Rinttilä et al [23], 2004 |
| Enterococcus species | g-enter-R | ACTCGTTGTACTTCCCATTGT | Rinttilä et al [23], 2004 |
| Veillonella species | g-veill-F | A(C/T)CAACCTGCCCTTCAGA | Rinttilä et al [23], 2004 |
| Veillonella species | g-veill-R | CGTCCCGATTAACAGAGCTT | Rinttilä et al [23], 2004 |
| Prevotella | CFB286F | GTAGGGGTTCTGAGAGGA | probeBase pB-00045 |
| Prevotella | CFB719R | AGCTGCCTTCGCAATCGG | probeBase pB-00047 |
| Lactobacillus | Uni331F | TCCTACGGGAGGCAGCAGT | Nadkarni et al [24], 2002 |
| Lactobacillus | Lacto371R | TGG AAG ATT CCC TAC TGC | probeBase pB-00195 |
| Bifidobacterium species | Bif551F | CGCGTCYGGTGTGAAAG | Delroisse et al [25], 2008 |
| Bifidobacterium species | Bif794R | CCCCACATCCAGCATCCA | Delroisse et al [25], 2008 |
Determination of Specificity and Limit of Detection
The specificity of the primers was determined by using purified template DNA from reference strains, including Bacteroides fragilis American Type Culture Collection (ATCC) 25825, Bacteroides thetaiotaomicron ATCC 29741, Bacteroides distasonis ATCC 8503, Bacteroides ovatus ATCC 8483, Bacteroides vulgatus ATCC 8482, Prevotella melaninogenica ATCC 25845, Clostridium coccoides ATCC 29236, Fusobacterium nucleatum subspecies nucleatum ATCC 25586, Peptostreptococcus anaerobius ATCC 27337, Bifidobacterium bifidum ATCC15696, and C. difficile ATCC 43255. Melting curve analysis was performed to ensure the specificity of the primer sets and subsequent qPCR amplification reactions. Positive and negative controls were included in each run to ensure reproducibility and consistency. The limit of detection for each assay was determined with concentrations of purified DNA of the reference strains ranging from 0.00002–20 ng. This range was also used to generate each standard curve using serial 10-fold dilutions.
Quantification of Target Bacterial DNA in Fecal Samples by Real-Time qPCR
To estimate the amounts of target bacterial DNA from fecal DNA extractions, threshold cycle (Ct) values were first converted into gDNA copies using the standard curve generated from each qPCR run. For construction of standard curves, 10-fold-dilution series of 102–106 target genomes from target species were prepared and run with samples. To calculate colony-forming units (CFU) per gram of stool, the target genomes calculated from 20 ng of gDNA (the amount used per qPCR reaction) were extrapolated into CFU per gram of stool by multiplying the CFU per nanogram of gDNA by the yield (total nanograms of gDNA extracted from 1 g of stool). The majority of the qPCR tests were designed to detect a wide range of related and diverse bacterial species that, most likely, did not have the same genome size or ribosomal DNA copy numbers. Therefore, average genome sizes for each bacterial group were used. In addition to the foregoing, 5 normal control samples were analyzed pair wise by quantitative cultures and by qPCR for Bacteroides group organisms, Enterobacteriaceae, and Enterococcus species.
Statistical Analyses
The quantitative bacterial counts of C. difficile and calculated CFU per gram of target organism group by real-time qPCR were log transformed, after which changes in each time of collection were compared between fidaxomicin and vancomycin treatments, using Wilcoxon signed-rank tests for nonparametric data (GraphPad Prism; GraphPad, San Diego, CA).
RESULTS
Of the 89 patients randomly assigned in the study, 44 vancomycin- and 45 fidaxomicin-treated patients responded to treatment. C. difficile strain typing showed that 13% of strains were ribotype 027. Recurrence was observed in 23% of vancomycin-treated patients (10 of 44) and in 11% of fidaxomicin-treated patients (5 of 44). Results of qPCR analysis of fecal samples obtained from healthy donors are summarized in Table 2. Paired tests showed that qPCR results were approximately 1 log10 CFU/g lower than results by quantitative culture.
Table 2.
Results of Quantitative Real-Time Polymerase Chain Reaction Detection of Components of the Microflora From 10 Healthy Control Donors of Stool
| Mean log10 CFU/g ± SD | Mean log10 CFU/g ± SD | ||
|---|---|---|---|
| Bacteroides | 9.66 ± 0.28 | Bifidobacterium | 6.78 ± 0.86 |
| Prevotella | 9.20 ± 0.50 | Veillonella | 5.80 ± 0.90 |
| Clostridium coccoides | 9.02 ± 0.53 | Desulfovibrio | 5.28 ± 1.24 |
| Clostridium leptum | 7.73 ± 0.77 | Enterobacteriaceae | 5.53 ± 0.75 |
| Lactobacillus | 7.59 ± 0.51 | Enterococcus species | 5.30 ± 0.75 |
Abbreviations: CFU, colony-forming unit; SD, standard deviation.
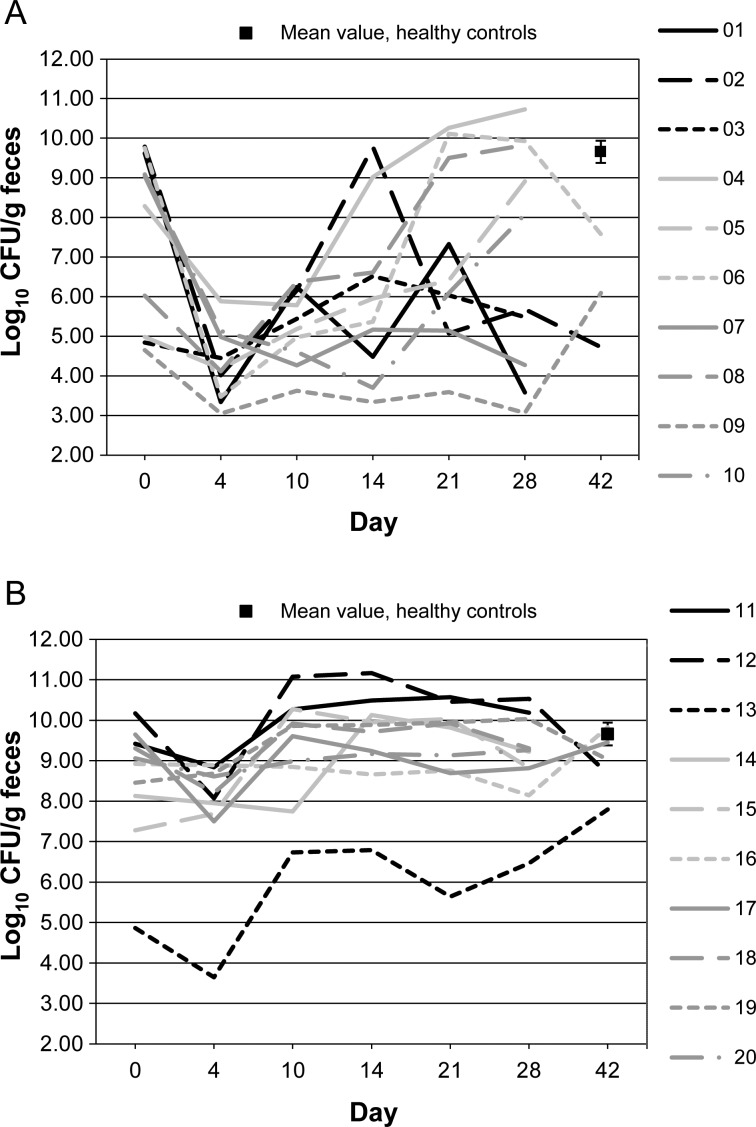
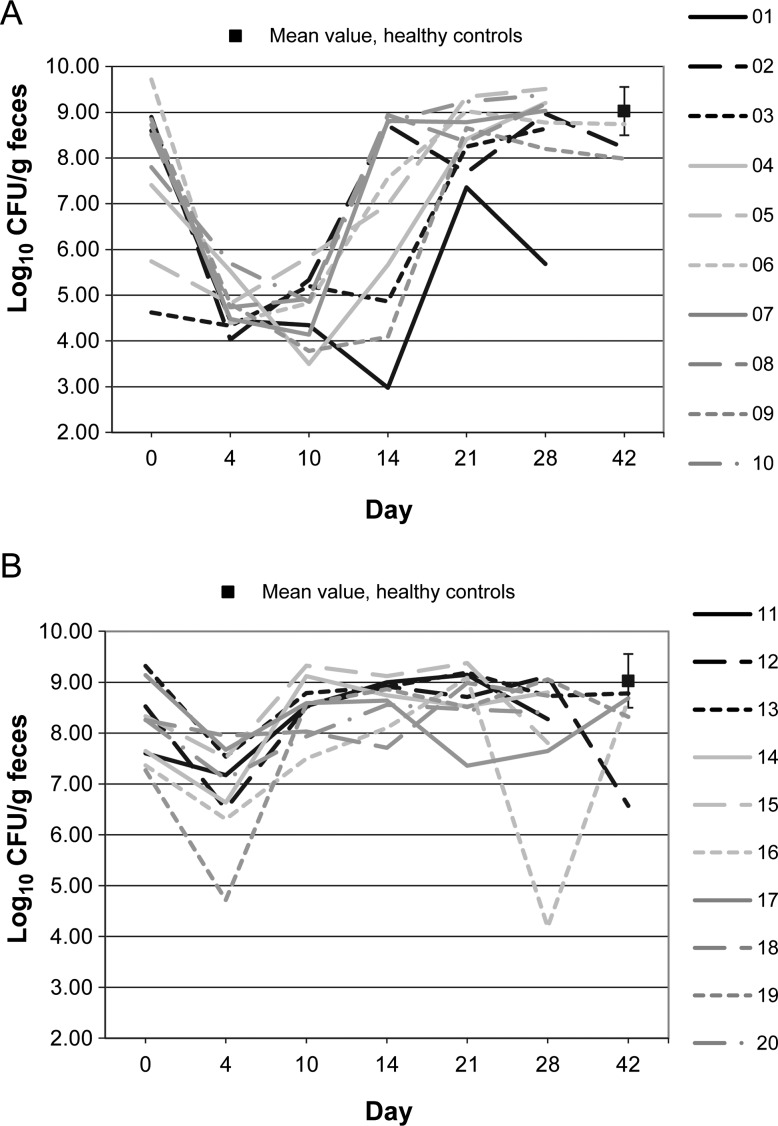
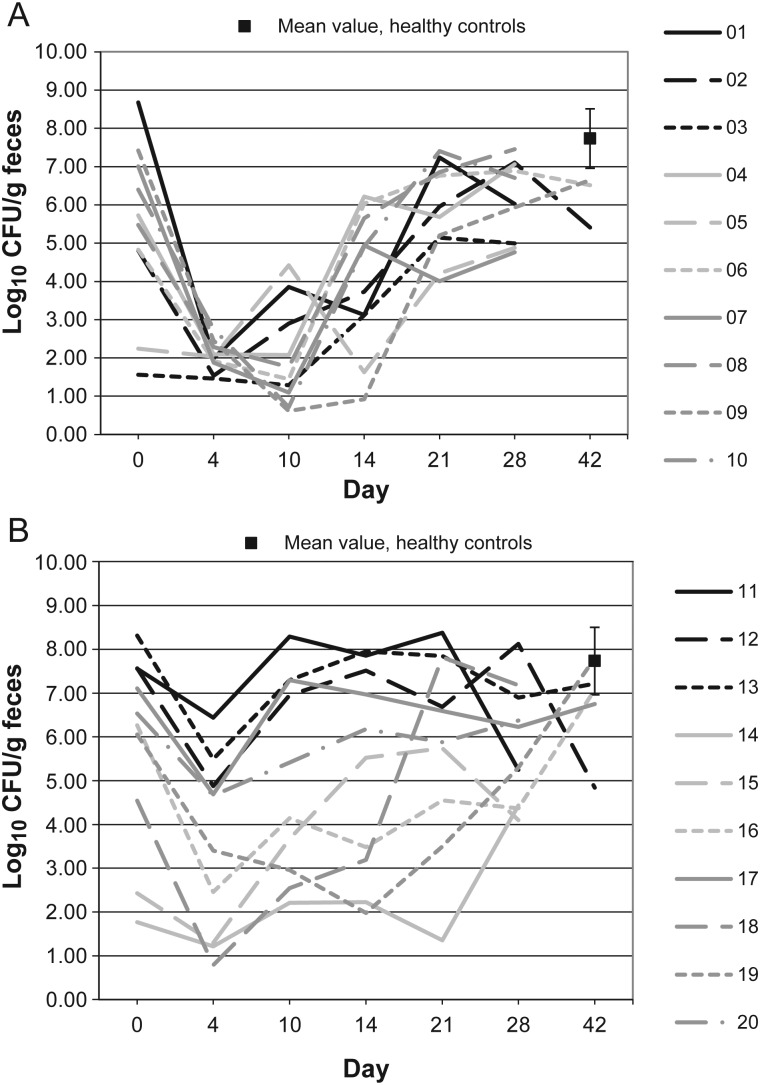
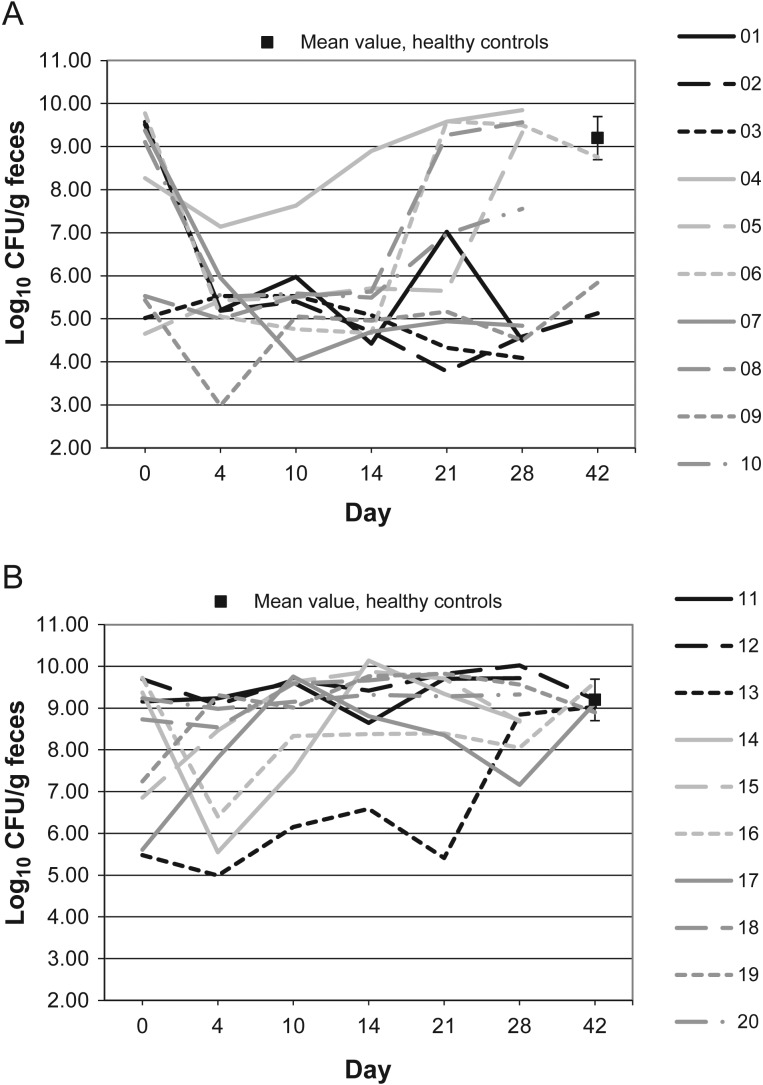
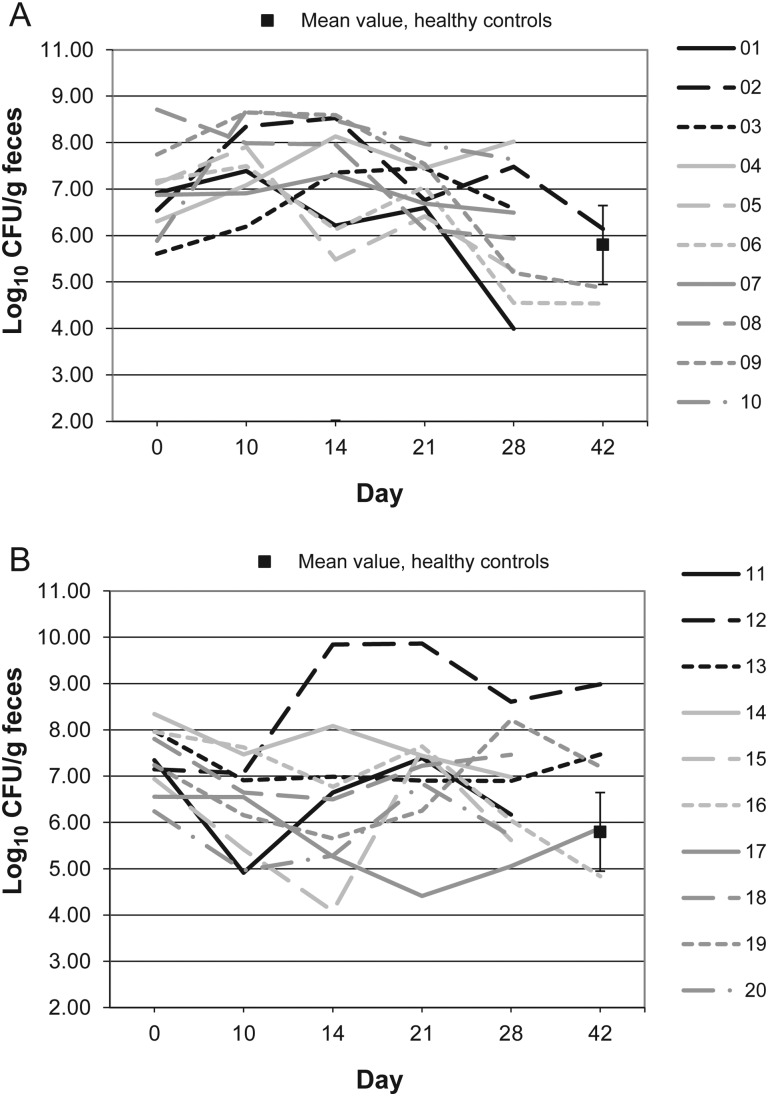
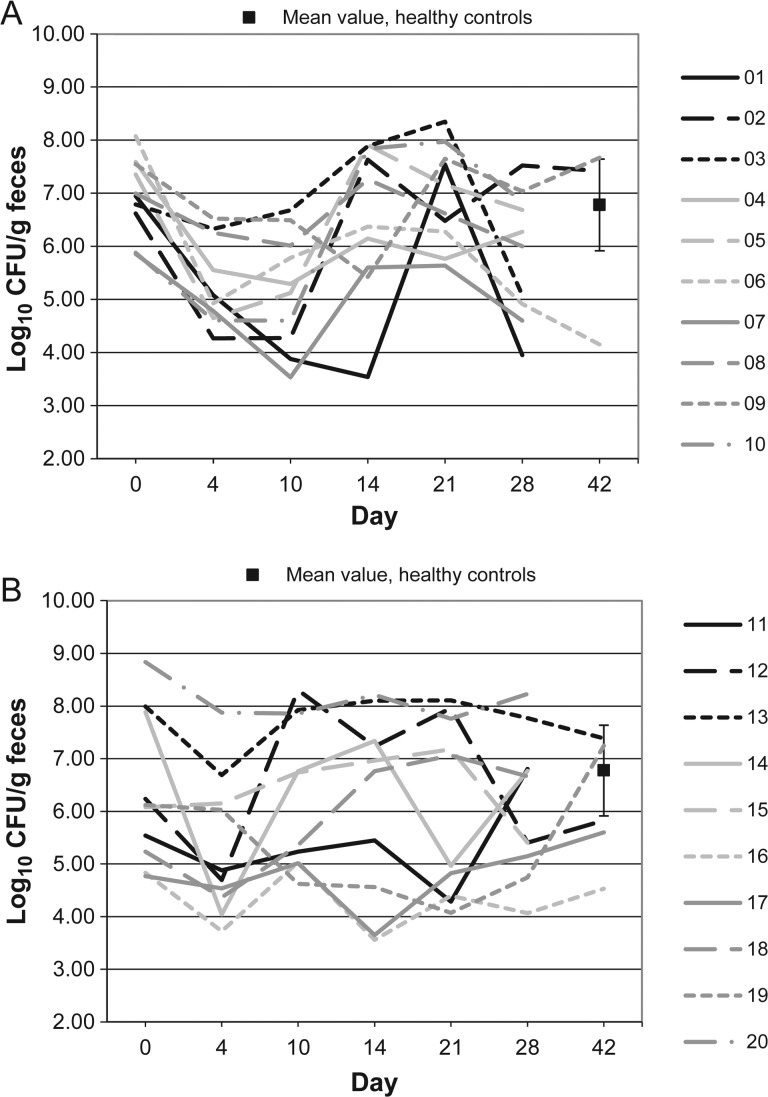
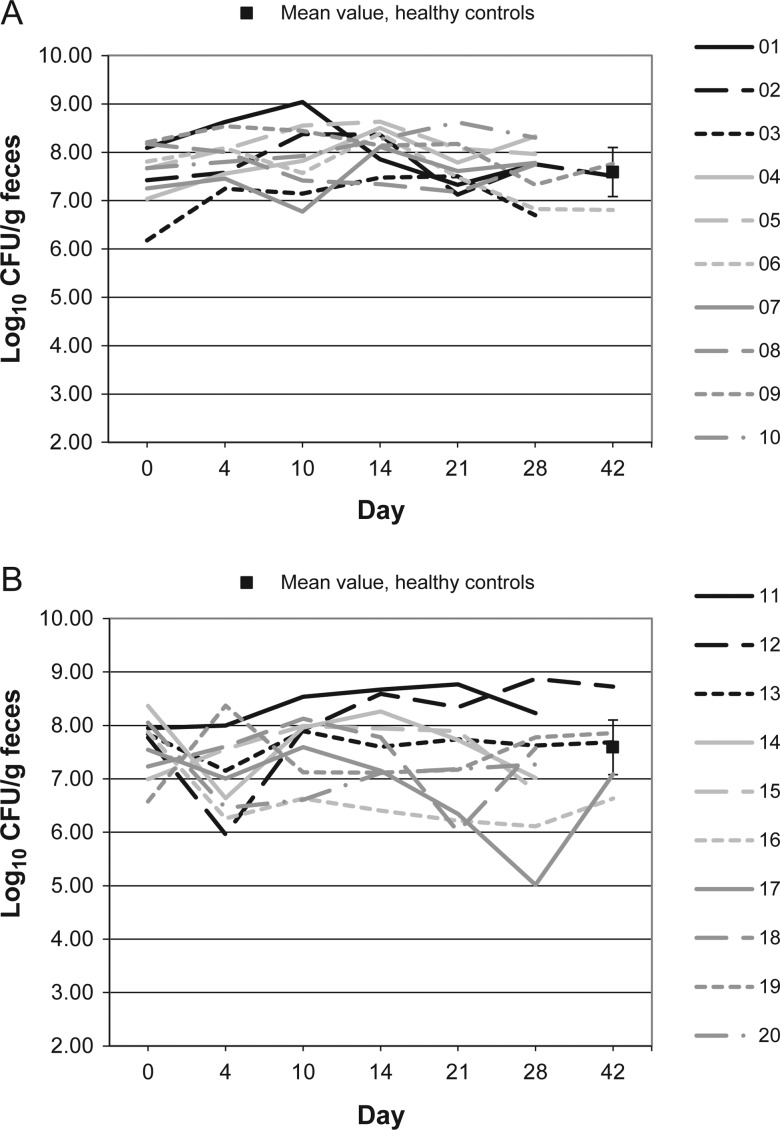
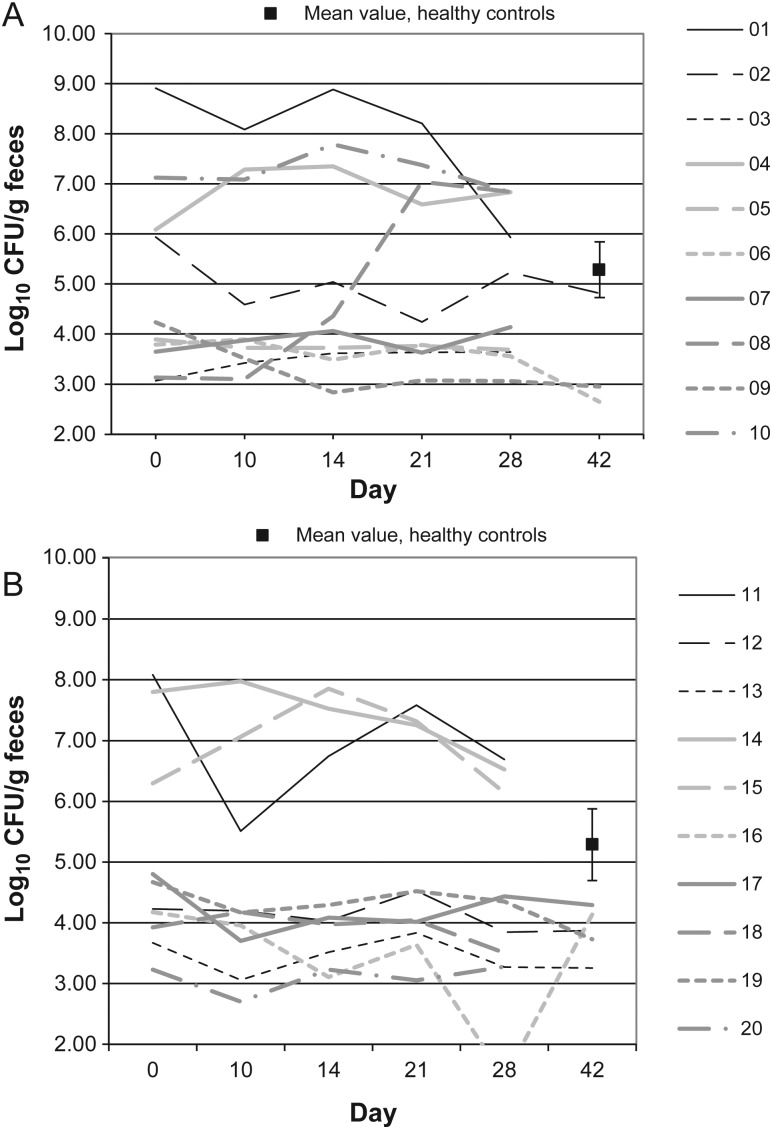
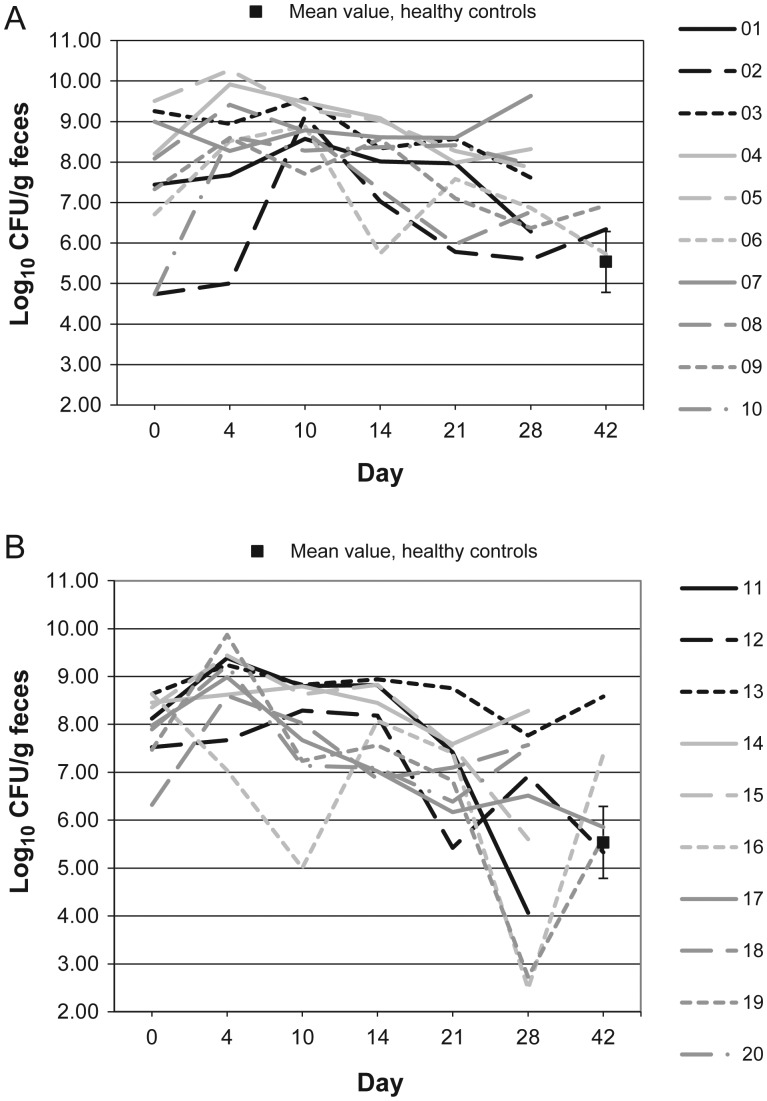
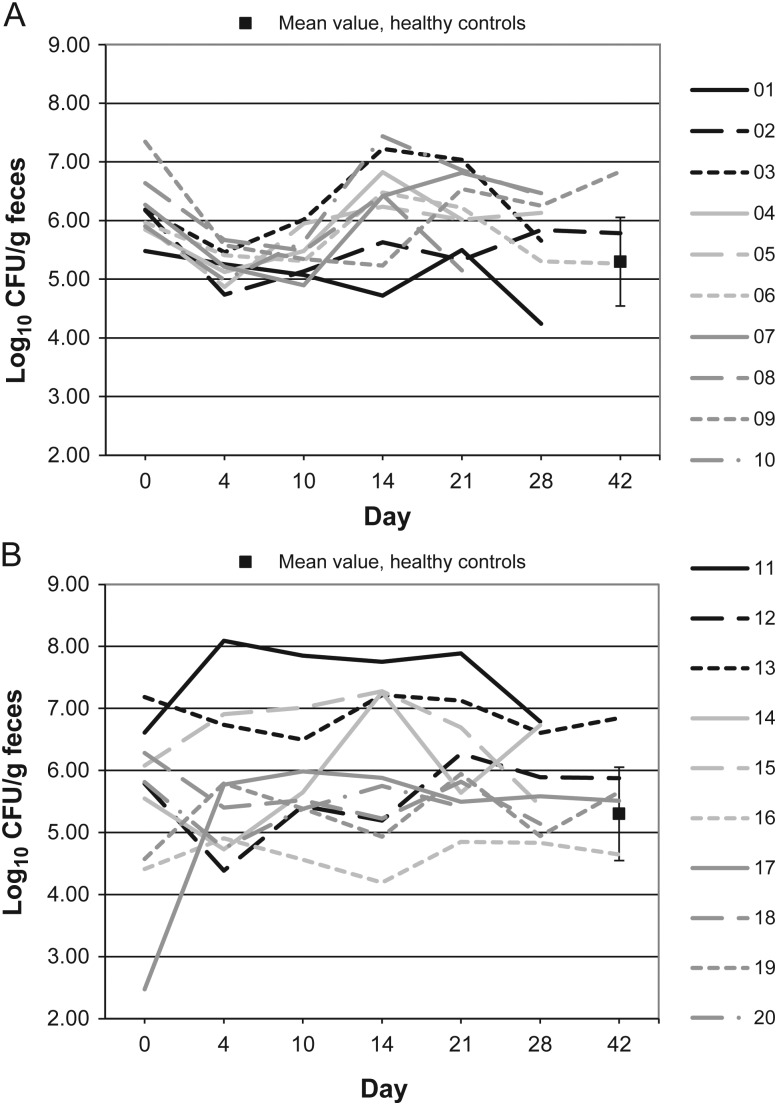
Figures 1–10 show counts of target organisms in individual patients over time after receipt of vancomycin or fidaxomicin, as well as mean values for 10 healthy controls. Clinical trial site subject numbers have been removed, and subjects are listed sequentially by number to preserve confidentiality. Mean counts of Bacteroides species, Prevotella species, C. coccoides, and Clostridium leptum were approximately 2 log counts lower at study entry, compared with results from healthy control fecal samples. For samples collected on day 4, a washout effect was noted on the basis of a transitory dip in CFU-per-gram for fidaxomicin-treated subjects, likely as a result of continued diarrhea, whereas the decrease in microbial counts was substantially greater for vancomycin-treated subjects, presumably because of both a washout effect plus microbial suppression/killing. As a result, the differences between the day-0 and day-10 samples at the end of treatment appear to be the best comparators of the effect of treatment on microbial counts. Vancomycin markedly suppressed Bacteroides, Prevotella, C. coccoides, and C. leptum group organisms and suppressed Bifidobacteria species to a lesser extent. Fidaxomicin appeared to spare (for most groups) or act indifferently (for Bifidobacteria species) on these groups. No discernable changes were noted in Desulfovibrio and Lactobacillus species counts between treatment regimens. Veillonella species counts increased during vancomycin treatment and decreased in the post-treatment phase, whereas counts were unchanged in fidaxomicin-treated patients, suggesting an opportunistic increase in counts during suppression of other organism groups during vancomycin treatment. Vancomycin suppressed counts of non–vancomycin-resistant enterococci during therapy, after which there was a rebound in counts and gradual reduction in numbers later in the follow-up period. Fidaxomicin appeared not to influence enterococcal counts. Counts of Enterobacteriaceae were 2–3 logs higher than those in healthy controls at study entry and, for both treatments, appeared to drift downward in the posttreatment period.
Figure 1.
Bacteroides microflora levels over time in 10 patients receiving vancomycin (A), 10 patients receiving fidaxomicin (B), and 10 healthy controls (boxes). Abbreviation: CFU, colony-forming units.
Figure 2.
Clostridium coccoides microflora levels over time in 10 patients receiving vancomycin (A), 10 patients receiving fidaxomicin (B), and 10 healthy controls (boxes). Abbreviation: CFU, colony-forming units.
Figure 3.
Clostridium leptum microflora levels over time in 10 patients receiving vancomycin (A), 10 patients receiving fidaxomicin (B), and 10 healthy controls (boxes). Abbreviation: CFU, colony-forming units.
Figure 4.
Prevotella microflora levels over time in 10 patients receiving vancomycin (A), 10 patients receiving fidaxomicin (B), and 10 healthy controls (boxes). Abbreviation: CFU, colony-forming units.
Figure 5.
Veillonella microflora levels over time in 10 patients receiving vancomycin (A), 10 patients receiving fidaxomicin (B), and 10 healthy controls (boxes). Abbreviation: CFU, colony-forming units.
Figure 6.
Bifidobacterium microflora levels over time in 10 patients receiving vancomycin (A), 10 patients receiving fidaxomicin (B), and 10 healthy controls (boxes). Abbreviation: CFU, colony-forming units.
Figure 7.
Lactobacillus microflora levels over time in 10 patients receiving vancomycin (A), 10 patients receiving fidaxomicin (B), and 10 healthy controls (boxes). Abbreviation: CFU, colony-forming units.
Figure 8.
Desulfovibrio microflora levels over time in 10 patients receiving vancomycin (A), 10 patients receiving fidaxomicin (B), and 10 healthy controls (boxes). Abbreviation: CFU, colony-forming units.
Figure 9.
Enterobacteriaceae microflora levels over time in 10 patients receiving vancomycin (A), 10 patients receiving fidaxomicin (B), and 10 healthy controls (boxes). Abbreviation: CFU, colony-forming units.
Figure 10.
Enterococcaceae microflora levels over time in 10 patients receiving vancomycin (A), 10 patients receiving fidaxomicin (B), and 10 healthy controls (boxes). Abbreviation: CFU, colony-forming units.
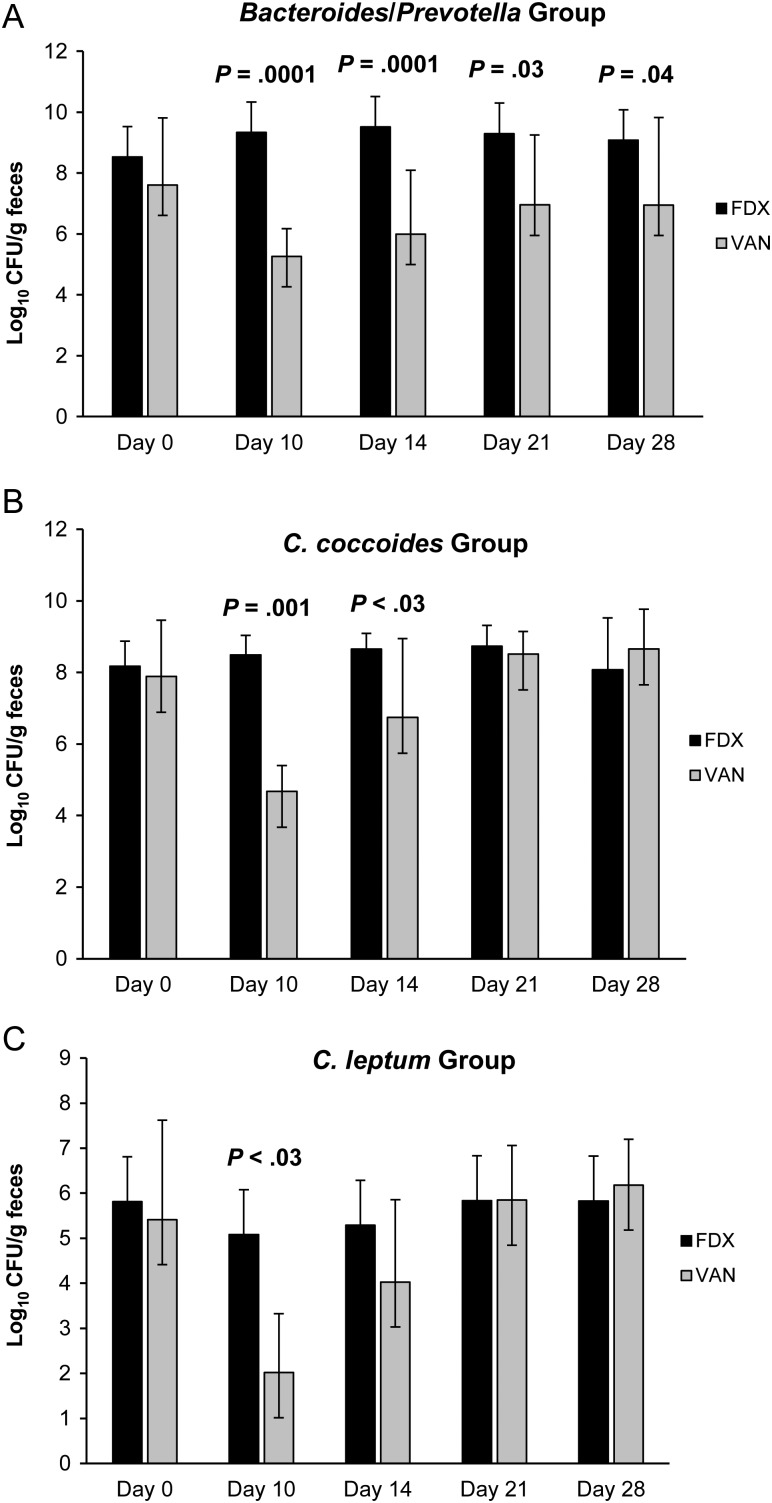
Figure 11A–C and Table 3 summarize the effect of vancomycin versus that of fidaxomicin during and following CDI treatment for 20 patients who achieved sustained cure. The day 38–42 samples, which were collected in 3–4 patients in each group, made comparisons difficult at the end of the follow-up period. Because most recurrences in the trial occurred within 2–3 weeks of completing therapy, the comparison of samples obtained at study entry to day-28 samples likely illustrates the differences between treatments. At study entry, organism counts were not different between the vancomycin and fidaxomicin treatment groups. For Bacteroides/Prevotella organisms, vancomycin markedly suppressed this organism group during therapy. Even at day 28, significant differences were noted between vancomycin and fidaxomicin. Similar differences were observed for the C. coccoides and C. leptum groups, but suppression by vancomycin was transient, with recovery by day 21.
Figure 11.
Levels of major cultivable and noncultivable genera of the normal fecal microbiota in 20 patients with Clostridium difficile infection who were randomly assigned to receive treatment with fidaxomicin or vancomycin (10 patients/treatment arm). All patients responded to treatment without recurrence. Abbreviations: FDX, fidaxomicin; VAN, vancomycin.
Table 3.
Results of Quantitative Real-Time Polymerase Chain Reaction for Major Bacterial Groups for 10 Patients Receiving Vancomycin or Fidaxomicin for 10 Days, Followed by 4 Weeks of Follow-up
|
Bacteroides |
Prevotella |
Clostridium coccoides group |
Clostridium leptum group |
Bifidobacteria |
Enterobacteriaceae |
Lactobacillus |
Enterococcaceae |
|||||||||
|---|---|---|---|---|---|---|---|---|---|---|---|---|---|---|---|---|
| Mean log10 CFU ± SD |
Mean log10 CFU ± SD |
Mean log10 CFU ± SD |
Mean log10 CFU ± SD |
Mean log10 CFU ± SD |
Mean log10 CFU ± SD |
Mean log10 CFU ± SD |
Mean log10 CFU ± SD |
|||||||||
| Day | Vancomycin | Fidaxomicin | Vancomycin | Fidaxomicin | Vancomycin | Fidaxomicin | Vancomycin | Fidaxomicin | Vancomycin | Fidaxomicin | Vancomycin | Fidaxomicin | Vancomycin | Fidaxomicin | Vancomycin | Fidaxomicin |
| 0 | 7.61 ± 2.21 | 8.52 ± 1.53 | 7.62 ± 2.17 | 8.11 ± 1.66 | 7.89 ± 1.58 | 8.17 ± 0.71 | 5.41 ± 2.21 | 5.81 ± 2.22 | 6.96 ± 0.72 | 6.35 ± 1.42 | 7.50 ± 1.70 | 7.94 ± 0.70 | 7.55 ± 0.62 | 7.62 ± 0.54 | 6.17 ± 0.51 | 5.48 ± 1.35 |
| 4 | 4.26 ± 0.88 | 7.81 ± 1.54 | 5.30 ± 0.81 | 7.84 ± 1.61 | 4.73 ± 0.53 | 6.91 ± 0.94 | 2.04 ± 0.39 | 3.53 ± 5.08 | 5.30 ± 0.81 | 5.30 ± 1.33 | 8.52 ± 1.46 | 8.81 ± 0.87 | 7.90 ± 0.45 | 7.10 ± 0.78 | 5.23 ± 0.31 | 5.75 ± 1.18 |
| 10 | 5.26 ± 0.91 | 9.33 ± 1.30 | 5.50 ± 0.92 | 8.84 ± 1.19 | 4.68 ± 0.73 | 8.49 ± 0.55 | 2.02 ± 1.31 | 5.08 ± 2.26 | 5.17 ± 1.09 | 6.28 ± 1.40 | 8.84 ± 0.57 | 7.84 ± 1.18 | 7.91 ± 0.70 | 7.64 ± 0.65 | 5.43 ± 0.36 | 5.93 ± 0.95 |
| 14 | 5.99 ± 2.10 | 9.52 ± 1.19 | 5.43 ± 1.30 | 9.06 ± 1.04 | 6.74 ± 2.21 | 8.65 ± 0.44 | 4.03 ± 1.83 | 5.29 ± 2.37 | 6.56 ± 1.43 | 6.18 ± 1.75 | 8.01 ± 1.04 | 7.98 ± 0.80 | 8.11 ± 0.43 | 7.66 ± 0.73 | 6.26 ± 0.85 | 6.07 ± 1.22 |
| 21 | 5.95 ± 2.30 | 9.30 ± 1.44 | 6.63 ± 2.21 | 8.97 ± 1.37 | 8.51 ± 0.64 | 8.73 ± 0.58 | 5.85 ± 1.21 | 5.83 ± 2.19 | 6.94 ± 0.93 | 6.06 ± 1.69 | 7.62 ± 1.03 | 7.06 ± 0.92 | 7.69 ± 0.48 | 7.34 ± 0.93 | 6.15 ± 0.67 | 6.12 ± 0.90 |
| 28 | 6.95 ± 2.87 | 9.08 ± 1.16 | 6.83 ± 2.54 | 8.93 ± 0.85 | 8.66 ± 1.11 | 8.07 ± 1.45 | 6.18 ± 1.01 | 5.82 ± 1.35 | 5.89 ± 1.19 | 6.10 ± 1.35 | 7.33 ± 1.18 | 5.95 ± 2.14 | 7.65 ± 0.55 | 7.23 ± 1.09 | 5.77 ± 0.72 | 5.79 ± 0.73 |
| 42 | 7.83 ± 1.70 | 9.34 ± 0.73 | 7.89 ± 1.63 | 9.22 ± 0.35 | 8.41 ± 0.69 | 8.40 ± 0.82 | 7.09 ± 1.33 | 6.89 ± 1.08 | 5.62 ± 1.51 | 6.11 ± 1.17 | 6.52 ± 1.61 | 6.50 ± 1.10 | 7.50 ± 0.50 | 7.60 ± 0.80 | 5.77 ± 0.76 | 5.71 ± 0.79 |
Table 4 summarizes the results of total quantitative cultures for C. difficile at study entry, day 4, day 10, and in the follow-up period, along with spore counts and C. difficile cytotoxin B titers. Mean total and spore counts at study entry were similar between treatment arms. At days 4 and 10, both treatments effectively reduced C. difficile counts to the lower limit of quantitation, after which there appeared to be a similar low-level rebound of C. difficile counts. Spore counts were similar between treatment arms. Toxin titers were similar at study entry, and all patients had no detectable toxin (titer, <1/20) on days 4–10 of treatment. However, vancomycin-treated patients were twice as likely to reexpress toxin in the follow-up period (P = .03), primarily within the first 2 weeks of treatment. In the total patient group of 89 patients, recurrence was twice as likely in the vancomycin group. The same strain was seen at recurrence in 14 of 15 patients. Compared with patients who achieved sustained cure, vancomycin-treated patients who experienced recurrence of CDI had significantly lower counts of Bacteroides and Prevotella organisms at the end of treatment (Table 5). A trend toward lower counts of these organisms was also observed in fidaxomicin-treated patients who subsequently experienced recurrence of CDI. At diagnosis of recurrent CDI, toxin titers, pathogen counts, and microbiome profiles were similar to findings at study entry (data not shown).
Table 4.
Quantitative Cultures for Clostridium difficile Total Counts, Spore Post–Alcohol Shock Counts, and C. difficile Cytotoxin B Titers in 89 Patients Randomly Assigned to Receive a 10-Day Course of Vancomycin or Fidaxomicin Therapy
| Day 0 | Day 4 | Day 10 | Day 14 | Day 21 | Day 28 | Day 42 | |
|---|---|---|---|---|---|---|---|
| Mean log10 CFU/g ± SD (spore ± SD) | |||||||
| VAN | 6.2 ± 2.1 | 2.2 ± 0.9 | 2.0 ± 0.0 | 3.1 ± 2.2 | 4.5 ± 2.7 | 3.9 ± 2.2 | 4.5 ± 2.4 |
| FDX | 5.9 ± 2.8 | 2.0 ± 0.1 | 2.0 ± 0.1 | 2.7 ± 1.9 | 4.2 ± 2.4 | 3.9 ± 2.3 | 3.0 ± 1.9 |
| Mean log10 spore count (±SD)a | |||||||
| VAN | 4.8 ± 1.7 | 2.7 ± 1.1b | 2.2 ± 0.6 | 3.2 ± 2.0 | 4.0 ± 1.9 | 3.3 ± 1.5 | 3.2 ± 1.6 |
| FDX | 4.7 ± 1.8 | 2.0 ± 0.0b | 2.1 ± 0.7 | 2.3 ± 1.2 | 3.3 ± 1.8 | 3.1 ± 1.4 | 2.7 ± 1.3 |
| Mean toxin B titer ± SEM | Day 0 | Day 4 | Day 10 | Pooled for Days 14, 21, 28, 42c | |||
| VAN | 2800 ± 1250 | Negative | Negative | 1260 ± 350 | |||
| FDX | 2250 ± 600 | Negative | Negative | 2400 ± 1400d | |||
A total of 44 patients received VAN, and 45 received FDX.
Abbreviations: CFU, colony forming units; FDX, fidaxomicin; SD, standard deviation; SEM, standard error of the mean; VAN, vancomycin.
a Several values were higher than total counts, reflecting several samples for which spore counts appeared higher than total counts, which could represent variation near the lower limit of detection and possibly less competition after alcohol shock–treatment cultures.
b P = .001.
c Data are for positive titers only. For the VAN group, 7 of 30 specimens tested from day 14, 15 of 30 from day 21, 3 of 22 from day 28, and 1 of 12 from day 42 were positive. For the FDX group, 1 of 23 specimens tested from day 14, 6 of 27 from day 21, 5 of 20 from day 28, and 1 of 21 from day 42 were positive.
d The value was 1140 ± 770 if the outlier toxin titer of 1/16 000 was excluded.
Table 5.
Comparison of Changes in Microflora Among Patients Who Achieved Sustained Cure of Clostridium difficile Infection With Changes Among Patients Who Achieved Cure But Had Subsequent Recurrence
| Log10 CFU/g Feces ± SD |
||||
|---|---|---|---|---|
| Patients With Sustained Cure |
Patients With Recurrence |
|||
| Day 0 | Day 10 | Day 0 | Day 10 | |
| Bacteroides group | ||||
| Vancomycin | 7.60 ± 2.21 | 5.26 ± 0.91a | 8.40 ± 2.01 | 4.37 ± 0.39 |
| Fidaxomicin | 8.52 ± 1.53b | 9.33 ± 1.30c | 5.76 ± 1.94 | 7.00 ± 2.33 |
| Prevotella species | ||||
| Vancomycin | 7.62 ± 2.17 | 5.50 ± 0.92d | 8.11 ± 1.99 | 4.43 ± 0.67 |
| Fidaxomicin | 8.11 ± 1.66 | 8.84 ± 1.19e | 5.26 ± 1.96 | 6.57 ± 2.20 |
| Clostridium coccoides group | ||||
| Vancomycin | 7.89 ± 1.58 | 4.67 ± 0.72 | 8.46 ± 0.51 | 4.95 ± 1.30 |
| Fidaxomicin | 8.17 ± 0.71 | 8.49 ± 0.55 | 7.21 ± 1.77 | 6.80 ± 2.77 |
Ten patients in the vancomycin group and 10 in the fidaxomicin achieved sustained cure, whereas 10 in the vancomycin group and 5 in the fidaxomicin group had recurrence. Values were determined on the basis of quantitative real-time polymerase chain reaction. Patients who experienced recurrence had lower counts of Bacteroides and Prevotella organisms. Fidaxomicin-treated patients with recurrence appeared to have greater reductions in Bacteroides counts at study entry.
Abbreviation: CFU, colony-forming unit.
a P < .03, compared with day 10 values for patients with recurrence.
b P = .03, compared with day 10 values for patients with recurrence.
c P = .08, compared with day 10 values for patients with recurrence.
d P = .007, compared with day 10 values for patients with recurrence.
e P = .11, compared with day 10 values for patients with recurrence.
DISCUSSION
CDI is the most prominent clinical example of the consequence of impairment of the normal microbiota of the gut, resulting in loss of colonization resistance, pathogen proliferation, and diarrheal disease. Measurement of the degree of impairment of the intestinal flora that is thought to occur with intestinal infections has awaited new technologies available only in the past decade. Studies to date have shown depletion of Bacteroides species and Firmicutes in several patients experiencing multiple recurrences [26], floral shifts by denaturing gradient gel electrophoresis [27], and changes in Bacteroidetes and Firmicutes, as determined by microarray signaling, in a comparison of cohorts of patients with and control patients without CDI [28]. A systematic prospective and quantitative study to evaluate microbiome shifts during fidaxomicin treatment of CDI is reported here.
The extent and nature of impairment of the microbiome before the onset of CDI diarrheal symptoms (equivalent to the concept of the latent period) are unknown. Fecal samples could also be regarded as an indirect measure of biological processes because events on the mucosal interface likely are more determinative in pathogenesis. Nevertheless, given the technical challenges of obtaining and separating microbes “in the fecal stream” from those on surfaces, comparison of microbiome profiles in fecal samples from healthy controls with samples at the onset of CDI are a measure of the degree of impairment of the microbiome. Findings in this study extend and support results of the phase II clinical study that used conventional culture [18] and fluorescence in situ hybridization [19]. Bacteroides and Firmicutes groups (C. coccoides plus C. leptum), which constitute the bulk of the microflora, appear to be reduced 10–100-fold at the time of CDI diagnosis on the basis of qPCR testing. On the basis of paired culture versus qPCR results, using Bacteroides as an indicator group, the mean reduction could be 1-log10 greater. There is substantial variation in the degree of suppression of the normal microbiota, with some patients showing Bacteroides counts in the 103-CFU/g range. Because diarrheal movements could have a washout effect on normal flora, it is likely that a decreased degree of perturbation of the microbiome can result in CDI.
Because the decrease in counts at day 4 appears to be a further washout effect due to diarrheal movements before disease resolution (with or without antimicrobial suppression), differences in counts at study entry and at the end of treatment at day 10 have been used to quantify the effect of drug treatment on the residual microbiome. The results of microbiome profiling document the “collateral damage” to the microflora seen with vancomycin therapy, a further 2–3-log decrease in Bacteroides group counts resulting in a 4–6-log decrease from healthy control counts at the end of vancomycin therapy. The observation that Bacteroides organisms are more numerous on the mucosal surface compared with the feces itself [29] suggests an important role in colonization resistance, perhaps by a process of bacterial interference versus intestinal pathogens. The marked decrease in Bacteroides group counts persists for several weeks after vancomycin treatment. This decrease is associated with reappearance of C. difficile cytotoxin B in fecal filtrates at a frequency that is twice that after fidaxomicin therapy and, in this study population, was accompanied by twice the number of CDI recurrences. These findings are consistent with outcomes in the clinical trials as a whole [11, 12] and underscore the important observation that the majority of recurrences eventuate during the 2–3-week interval after treatment. A reduction (P = .001) in number of spores at day 4 of fidaxomicin treatment, compared with day 4 of vancomycin treatment (Table 4), was not sustained after therapy. The single observation and small number of patients limit interpretation. The C. difficile microbial profiles were not different between treatments and therefore support the alternate hypothesis that reduced recurrence is related to the “health” of the residual normal microflora.
Comparison of the pattern of suppression of members of the microbiome between the 2 treatments suggests that Bacteroides species, Prevotella species, the Firmicutes, and Bifidobacteria species play a beneficial role in maintaining a healthy microbiome and that high counts of coliforms and enterococci are a marker for a depleted gut microbiome. The observation that patients with recurrence of CDI have lower counts of Bacteroides and Prevotella organisms at the end of therapy is additional supportive evidence of a protective role of these microbes. In the final analysis, it is unclear which groups, species, or combinations are protective. The role of lactobacilli in preventing CDI is unclear at present. The unchanged counts seen in this study neither support nor refute a role for lactobacilli in preventing CDI recurrences. On the basis of the high efficacy of fecal microbiome transplantation in arresting recurrent CDI, it is likely that the dominant members of the microbiome are critical for preventing CDI. In summary, the microflora-sparing features of fidaxomicin shown in this report offer selective therapy for CDI, a more robust microbiome, and a decreased risk for recurrent disease.
Notes
Acknowledgments. K. C. performed the real-time qPCR assays and quantitative cultures for C. difficile. B.B. served as study coordinator. J. E. served as microbiology technologist culturing fecal microflora. L. W. served as infection control microbiology technologist for C. difficile cultures and toxin assays. M. E. and W. K. served as infection control microbiology technologist for C. difficile cultures, toxin assays, and ribotyping.
Financial support. This work was supported in part by Optimer Pharmaceuticals and the National Institutes of Health Small Business Innovation Research (grant 2-R44A163692-02A1).
Supplement sponsorship. This article was published as part of a supplement entitled “Fidaxomicin and the Evolving Approach to the Treatment of Clostridium difficile Infection,” sponsored by Optimer Pharmaceuticals, Inc.
Potential conflicts of interest. T. J. L. reports that his institution received per-case funding from Optimer Pharmaceuticals. T. J. L. also received support from Optimer Pharmaceuticals for travel to meetings for the conduct of the clinical trial or presentation of the results of the clinical trial; received honoraria from Optimer Pharmaceuticals (for additional meetings and related studies on fidaxomicin), Merck, Cubist Pharmaceuticals, ViroPharma, and Iroko Pharmaceuticals; and is listed on a fidaxomicin patent. All other authors report no potential conflicts.
All authors have submitted the ICMJE Form for Disclosure of Potential Conflicts of Interest. Conflicts that the editors consider relevant to the content of the manuscript have been disclosed.
References
- 1.Olson MM, Shanholtzer CJ, Lee JT, Jr, Gerding DN. Ten years of prospective Clostridium difficile-associated disease surveillance and treatment at the Minneapolis VA Medical Center, 1982–1991. Infect Control Hosp Epidemiol. 1994;15:371–81. doi: 10.1086/646934. [DOI] [PubMed] [Google Scholar]
- 2.Aslam S, Hamill RJ, Musher DM. Treatment of Clostridium difficile-associated disease: old therapies and new strategies. Lancet Infect Dis. 2005;5:549–57. doi: 10.1016/S1473-3099(05)70215-2. [DOI] [PubMed] [Google Scholar]
- 3.Kelly CP, La Mont JT. Clostridium difficile—more difficult than ever. N Engl J Med. 2008;359:1932–40. doi: 10.1056/NEJMra0707500. [DOI] [PubMed] [Google Scholar]
- 4.Musher DM, Aslam S, Logan N, et al. Relatively poor outcome after treatment of Clostridium difficile colitis with metronidazole. Clin Infect Dis. 2005;40:1586–90. doi: 10.1086/430311. [DOI] [PubMed] [Google Scholar]
- 5.Zar FA, Bakkanagari SR, Moorthi KM, Davis MB. A comparison of vancomycin and metronidazole for the treatment of Clostridium difficile-associated diarrhea, stratified by disease severity. Clin Infect Dis. 2007;45:302–7. doi: 10.1086/519265. [DOI] [PubMed] [Google Scholar]
- 6.Pépin J, Valiquette L, Gagnon S, Routhier S, Brazeau I. Outcomes of Clostridium difficile-associated disease treated with metronidazole or vancomycin before and after the emergence of NAP1/027. Am J Gastroenterol. 2007;102:2781–8. doi: 10.1111/j.1572-0241.2007.01539.x. [DOI] [PubMed] [Google Scholar]
- 7.Louie TJ, Peppe J, Watt CK, et al. Tolevamer Study Investigator Group. Tolevamer, a novel nonantibiotic polymer, compared to vancomycin in the treatment of mild to moderately severe Clostridium difficile-associated diarrhea. Clin Infect Dis. 2006;43:411–20. doi: 10.1086/506349. [DOI] [PubMed] [Google Scholar]
- 8.Al Nassir WN, Sethi AK, Li Y, Pultz MJ, Riggs MM, Donskey CJ. Both oral metronidazole and oral vancomycin promote persistent overgrowth of vancomycin-resistant enterococci during treatment of Clostridium difficile associated disease. Antimicrob Agents Chemother. 2008;52:2403–6. doi: 10.1128/AAC.00090-08. [DOI] [PMC free article] [PubMed] [Google Scholar]
- 9.McFarlane LV, Elmer GW, Surawicz CM. Breaking the cycle: treatment strategies for 163 cases of recurrent Clostridium difficile disease. Am J Gastroenterol. 2002;97:1769–75. doi: 10.1111/j.1572-0241.2002.05839.x. [DOI] [PubMed] [Google Scholar]
- 10.Bakken JS. Fecal bacteriotherapy for recurrent Clostridium difficile infection. Anaerobe. 2009;15:285–9. doi: 10.1016/j.anaerobe.2009.09.007. [DOI] [PubMed] [Google Scholar]
- 11.Louie TJ, Miller MA, Mullane KM, et al. OPT-80-003 Clinical Study Group. Fidaxomicin versus vancomycin for Clostridium difficile infection. N Engl J Med. 2011;364:422–31. doi: 10.1056/NEJMoa0910812. [DOI] [PubMed] [Google Scholar]
- 12.Cornely OA, Crook DW, Esposito R, et al. for the OPT-80-004 Clinical Study Group. Fidaxomicin versus vancomycin for infection with Clostridium difficile in Europe, Canada, and the USA: a double-blind, non-inferiority, randomised controlled trial. Lancet Infect Dis. 2012;12:281–9. doi: 10.1016/S1473-3099(11)70374-7. [DOI] [PubMed] [Google Scholar]
- 13.van der Waaij D, Berghuis JM, Lekkerkerk JE. Colonization resistance of the digestive tract of mice during systemic antibiotic treatment. J Hyg (Lond) 1972;70:605–10. doi: 10.1017/s0022172400022464. [DOI] [PMC free article] [PubMed] [Google Scholar]
- 14.Swanson RN, Hardy DJ, Shipkowitz NL, et al. In vitro and in vivo evaluation of tiacumicins B and C against Clostridium difficile. Antimicrob Agents Chemother. 1991;35:1108–11. doi: 10.1128/aac.35.6.1108. [DOI] [PMC free article] [PubMed] [Google Scholar]
- 15.Finegold SM, Molitoris D, Vaisanen ML, Song Y, Liu C, Bolaños M. In vitro activities of OPT-80 and comparator drugs against intestinal bacteria. Antimicrob Agents Chemother. 2004;48:4898–902. doi: 10.1128/AAC.48.12.4898-4902.2004. [DOI] [PMC free article] [PubMed] [Google Scholar]
- 16.Credito KL, Appelbaum PC. Activity of OPT-80, a novel macrocycle, compared with those of eight other agents against selected anaerobic species. Antimicrob Agents Chemother. 2004;48:4430–4. doi: 10.1128/AAC.48.11.4430-4434.2004. [DOI] [PMC free article] [PubMed] [Google Scholar]
- 17.Louie T, Miller M, Donskey C, Mullane K, Goldstein EJ. Clinical outcomes, safety and pharmacokinetics of OPT-80 in a phase 2 trial of patients with Clostridium difficile infection. Antimicrob Agents Chemother. 2009;53:223–8. doi: 10.1128/AAC.01442-07. [DOI] [PMC free article] [PubMed] [Google Scholar]
- 18.Louie TJ, Emery J, Krulicki W, Byrne B, Mah M. OPT-80 eliminates Clostridium difficile and is sparing of Bacteroides species during treatment of C. difficile infection. Antimicrob Agents Chemother. 2009;53:261–3. doi: 10.1128/AAC.01443-07. [DOI] [PMC free article] [PubMed] [Google Scholar]
- 19.Tannock GW, Munro K, Taylor C, et al. A new macrocycle antibiotic, fidaxomicin (OPT-80), causes less alteration to the bowel microflora of Clostridium difficile-infected patients than does vancomycin. Microbiology. 2010;156:3354–9. doi: 10.1099/mic.0.042010-0. [DOI] [PubMed] [Google Scholar]
- 20.Bernhard AE, Field KG. Identification of nonpoint sources of fecal pollution in coastal waters by using host-specific 16S ribosomal DNA genetic markers from fecal anaerobes. Appl Environ Microbiol. 2000;66:1587–94. doi: 10.1128/aem.66.4.1587-1594.2000. [DOI] [PMC free article] [PubMed] [Google Scholar]
- 21.Bartosch S, Fite A, Macfarlane GT, McMurdo ME. Characterization of bacterial communities in feces of healthy elderly volunteers and hospitalized elderly patients by using real-time PCR and effects of antibiotic treatment on the fecal microbiota. Appl Environ Microbiol. 2004;70:3575–81. doi: 10.1128/AEM.70.6.3575-3581.2004. [DOI] [PMC free article] [PubMed] [Google Scholar]
- 22.Matsuki T, Watanabe K, Fujimoto J, et al. Development of 16S rRNA-gene-targeted group-specific primers for the detection and identification of predominant bacteria in human feces. Appl Environ Microbiol. 2002;68:5445–51. doi: 10.1128/AEM.68.11.5445-5451.2002. [DOI] [PMC free article] [PubMed] [Google Scholar]
- 23.Rinttilä T, Kassinen A, Malinen E, Krogius L, Palva A. Development of an extensive set of 16S rDNA-targeted primers for quantification of pathogenic and indigenous bacteria in faecal samples by real-time PCR. J Appl Microbiol. 2004;97:1166–77. doi: 10.1111/j.1365-2672.2004.02409.x. [DOI] [PubMed] [Google Scholar]
- 24.Nadkarni MA, Martin FE, Jacques NA, Hunter N. Determination of bacterial load by real-time PCR using a broad-range (universal) probe and primers set. Microbiology. 2002;148:257–66. doi: 10.1099/00221287-148-1-257. [DOI] [PubMed] [Google Scholar]
- 25.Delroisse JM, Boulvin AL, Parmentier I, Dauphin RD, Vandenbol M, Portetelle D. Quantification of Bifidobacterium spp. and Lactobacillus spp. in rat fecal samples by real-time PCR. Microbiology. 2008;163:663–70. doi: 10.1016/j.micres.2006.09.004. [DOI] [PubMed] [Google Scholar]
- 26.Chang JY, Antonopoulos DA, Kalra A, et al. Decreased diversity of the fecal microbiome in recurrent Clostridium difficile-associated diarrhea. J Infect Dis. 2008;197:435–8. doi: 10.1086/525047. [DOI] [PubMed] [Google Scholar]
- 27.De La Cochetière MF, Durand T, Lalande V, Petit JC, Potel G, Beaugerie L. Effect of antibiotic therapy on human fecal microbiota and the relation to the development of Clostridium difficile. Microb Ecol. 2008;56:395–402. doi: 10.1007/s00248-007-9356-5. [DOI] [PubMed] [Google Scholar]
- 28.Manges AR, Labbe A, Loo VG, et al. Comparative metagenomic study of alterations to the intestinal microbiota and risk of nosocomial Clostridium difficile-associated disease. J Infect Dis. 2010;202:1877–84. doi: 10.1086/657319. [DOI] [PubMed] [Google Scholar]
- 29.Eckburg PB, Bik EM, Bernstein CN, et al. Diversity of the human intestinal microbial flora. Science. 2005;308:1635–8. doi: 10.1126/science.1110591. [DOI] [PMC free article] [PubMed] [Google Scholar]


