Abstract
The first continuous, real-time spectroscopic monitoring of a photo-driven cargo delivery event from a mesoporous silica-based nanocarrier inside a single living cell is reported. By chemically attaching azobenzene molecules inside the 3 nm pore channels of mesoporous silica nanoparticles (~70 nm diameter), the escape of the cargo molecule, propidium iodide (PI) from the pore is prevented in the dark but is facilitated by the light-driven isomerization motion. Real-time spectroscopic measurements of a single cell uncover intermediate processes that occur during this intracellular delivery event, from nanomachine activation to the release of PI into the cytosol and to PI’s eventual intercalation with nuclear DNA. Changes in PI’s fluorescence intensity and the hypsochromic shift of the band maxima are used to identify the local environment of the fluorophore that is being observed in the cell. The ability to precisely initiate a chemical event inside an individual cell and continuously monitor the subsequent biological responses will enhance our understanding of intracellular process upon drug, protein and nucleic acid delivery.
1 Introduction
Remote activation of molecular machines1–3 integrated to mesoporous silica nanoparticles (MSN)4–6 has been extensively explored for on command release of molecules trapped in the nanopores.7–9 The success in delivering these molecules in vitro is usually monitored by confocal micrographs taken at discrete time intervals to demonstrate crucial intracellular changes. One limitation to the standard confocal images is the lack of spectral resolution because of the reliance on bandpass filters. This can omit important information when the emission maximum of a fluorescent molecule shifts with changes in the molecule’s local environment10–12 or varies in time over narrow wavelength ranges (< 50 nm).13,14 In addition, it is important to obtain continuous time observations of the same cell; the usual monitoring of different batches of cells results in an incomplete temporal account of these intracellular delivery events because the development stages can differ substantially across cells, with different cells going through different paths at different rates.15,16 Technological advances in fluorescence microscopy have embraced real-time spectral imaging to study biological processes,17,18 yet no spectroscopic studies have been performed that continuously follow the various stages of an intracellular delivery event. In this paper, we employ two continuous real-time measurement techniques: epifluorescence spectral acquisitions and spinning disk confocal imaging, to externally activate molecular machines inside a single living cell and simultaneously monitor the course of the developments.
The use of an externally-controlled delivery system with a release mechanism that is unaffected by any internal stimulus19– 21 present in the cellular environment is crucial for this study. Among the three most common external stimuli that are being explored for biological applications – light,22–27 magnetism, 28 and heat29,30 – photo-induced delivery offers the best spatial and temporal control. Not only can the molecular machines be activated externally by a laser beam, but also the subsequent intracellular dynamics can be spectroscopically followed after the precise time of initiation.
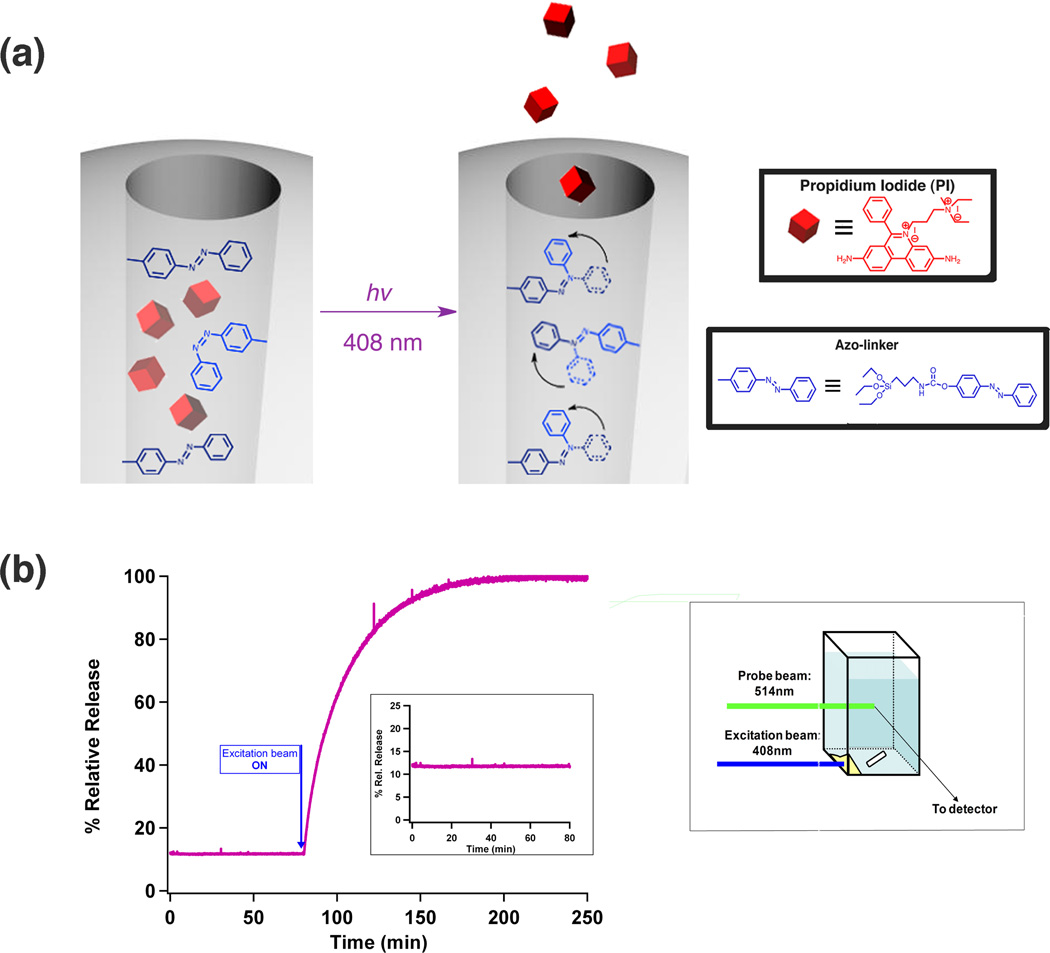
The molecular machine used in this study (Azo-NP) was made by chemically bonding azobenzene-derivatized molecules to the internal pore surface of MSN.31,32 [see Supporting Information† for synthesis and characterizations (Fig. S1 – S5)] Azobenzene chromophores undergo reversible photo-isomerizations between their cis and trans configurations at different excitation wavelengths.33 By tuning the excitation wavelength to a region where both isomers have similar absorption, switching between the two conformations is continuous. Large amplitude motion can also be generated within the pores of Azo-NP, which enables molecular transport to be modulated (Figure 1a). Cargo molecules such as dyes or drugs are trapped by the immobile azobenzenes in the dark, but the large amplitude light-driven motion enables them to move through the pores and escape into the surrounding medium. Observation of this dynamic motion can be achieved by monitoring the release of propidium iodide (PI) molecules, fluorescent nuclear staining agents that are stored inside the pores. By tracking real-time spectroscopic changes in a single cell, the release of PI from the particles, its movement through the cytoplasm, and the eventual staining of the cell nucleus can be sequentially identified.
Fig. 1. Spectroscopic measurements of Azo-NP’s photo-responsiveness in solution.
(a) Schematic diagram of the light-stimulated operation of Azo-NP. Azo-NP was made by co-condensing azo-linkers inside the cylindrical pores of MSN. Exciting Azo-NP at a wavelength where both isomers absorb promotes continual large-amplitude isomerization motion. (b) Successful triggering of the cis-trans motion is demonstrated through Azo-NP’s ability to trap cargo molecule, PI, in the pores and release it into solution upon photo-excitation. Azo-NP was placed at the corner of a cuvette and fluorescence changes in solution was continuously monitored (illustrated on the right). Prior to light-stimulation, no PI was released and the fluorescence intensity is constant (flat baseline in the inset). Upon excitation, intensities at PI’s emission maxima steadily increased, indicative of PI being released from Azo-NP.
In this work, we present the first continuous spectroscopic observations of a photo-induced delivery event by nanoparticles in vitro. Intracellular tracking of this event is made possible by incorporating spectroscopic detection to an epifluorescence microscope. To characterize this event, five specific investigations are described. The first study investigates the photo-responsive properties of the azobenzene molecular machine in solution and inside nanoparticles suspended in water. The second study establishes the molecular machine’s in vitro performance upon photo-excitation by monitoring its intrinsic fluorescence. The third study demonstrates how continuous spectral observations enable sequential mapping of PI’s movements inside a single cell. Using this delivery event as a guide, the fourth study correlates the rate of cargo delivery as a function of laser power. The final study focuses on spatially imaging the temporal development of nuclear staining as a result of this delivery event.
2 Results and discussion
2.1 Absorption and Emission of Azo-NP
Absorption and emission changes in response to photo-excitation were used to identify the photo-physical properties of Azo-NP. Before grafting the azo-linker moiety (see structure shown in inset of Figure 1a) into the pores of MSN, its photo-isomerization process was monitored in solution (acetone) by measuring the changes of its two absorption bands in the UV-visible region. The absorption band peak at ~ 330 nm (trans isomer) is assigned to the S2(ππ*) ← S0 transition and a second band at ~ 430 nm (cis- and trans-isomers) to the S1(nπ*) ← S0 transition.34,35 Upon UV light irradiation at 351 nm for one hour to achieve a cis-rich photo-stationary state, a decreased absorbance at 330 nm concomitant with an increase in 430 nm were observed. When the UV-exposed solution was irradiated at 448 nm for 30 min, an increase at 330 nm with a decrease at 430 nm was observed, thereby confirming the molecules’ capability to undergo reversible photo-isomerization [Fig. S6, Supporting Information†]. After the azo-linkers were covalently attached to the silica, fluorescence emission was used to detect the cis-trans motion inside the pores of Azo-NP. Generally, azobenzene chromophores do not fluoresce with appreciable quantum yield in solutions34 because the main relaxation process for excited azobenzene in the trans state is the highly efficient trans to cis photo-isomerization. Nonetheless, fluorescence has been observed for cases when azobenzene molecules are confined in a nanometer-scale space such as bilayer structures, 36 membranes,37,38 dendrimers,39,40 polymers41,42 and micelles.43,44 Since azobenzene moieties are confined within the 2 nm pores of Azo-NP, similar fluorescence emissions were expected to be observed. Azo-NP excited at 351 nm exhibits S2(ππ*) → S0 fluorescence at ~ 440 nm [Fig. S7, Supporting Information†], while excitation at 448 nm causes a S1(nπ*) → S0 emission at ~ 530 nm [Fig. S7, Supporting Information†], in accordance with literature reports.35,43,45 It is important to note that enhanced fluorescence emission is often correlated with a slower rate of trans to cis photo-isomerization, which suggests confinement of azobenzene in a restrictive environment may hamper their main non-radiative process.39,41,44 To ensure the isomerization process is efficient within the channel pores, Azo-NP was continuously irradiated at 351 nm. As shown in Fig. S8 [Supporting Information†], continuous excitation did not lead to an increase in fluorescence intensity, suggesting the cis-trans motion was not impeded.
2.2 Photo-responsiveness of Azo-NP in aqueous solution
Successful triggering of the cis-trans motion is demonstrated through Azo-NP’s ability to trap PI in the pores and release it into aqueous solution upon photo-excitation. The changes in fluorescence intensity of the solution was monitored using continuous fluorescence spectroscopy. Choosing an excitation wavelength where both cis and trans isomers have similar molar absorptivities can promote the trans → cis isomerization and simultaneously stimulate the cis → trans back reaction thereby generating large amplitude motions inside the pores.40 Careful examination of azo-linker’s absorption spectrum [Fig. S6, Supporting Information†] reveals that both isomers have similar absorbances in the wavelength region between 370 and 420 nm. As shown in the release profile in figure 1b, an increase in fluorescence intensity at PI’s emission maxima (630–660 nm) was observed upon photo-excitation of Azo-NP at 408 nm (20 mW). To ensure that the release observed was not due to laser heating, Azo-NP was illuminated with 648 nm light (a wavelength where azobenzene molecules do not absorb) at both 50 mW and 100 mW. In both cases, no release of PI was observed [Fig. S9, Supporting Information†]. To eliminate thermal heating as a possible release mechanism, Azo-NP’s performance was tested in 50°C aqueous solution. During the 90 minutes at this temperature setting, no fluorescence changes were observed. After the heat was turned off, the excitation beam (408 nm, 20 mW) was turned on and an increase in fluorescence intensities at PI’s emission maxima were observed [Fig. S10, Supporting Information†]. Finally, the stability of Azo-NP was monitored in solution for more than 16 hours, and no emission of PI was detected during that time interval [Fig. S11, Supporting Information†]. Collectively, these studies confirmed that Azo-NP can be externally controlled at selected excitation wavelengths, and can hold cargo molecules inside the pores without leakage for a long period of time in the absence of light activation.
2.3 Photoswitching of azobenzene in vitro
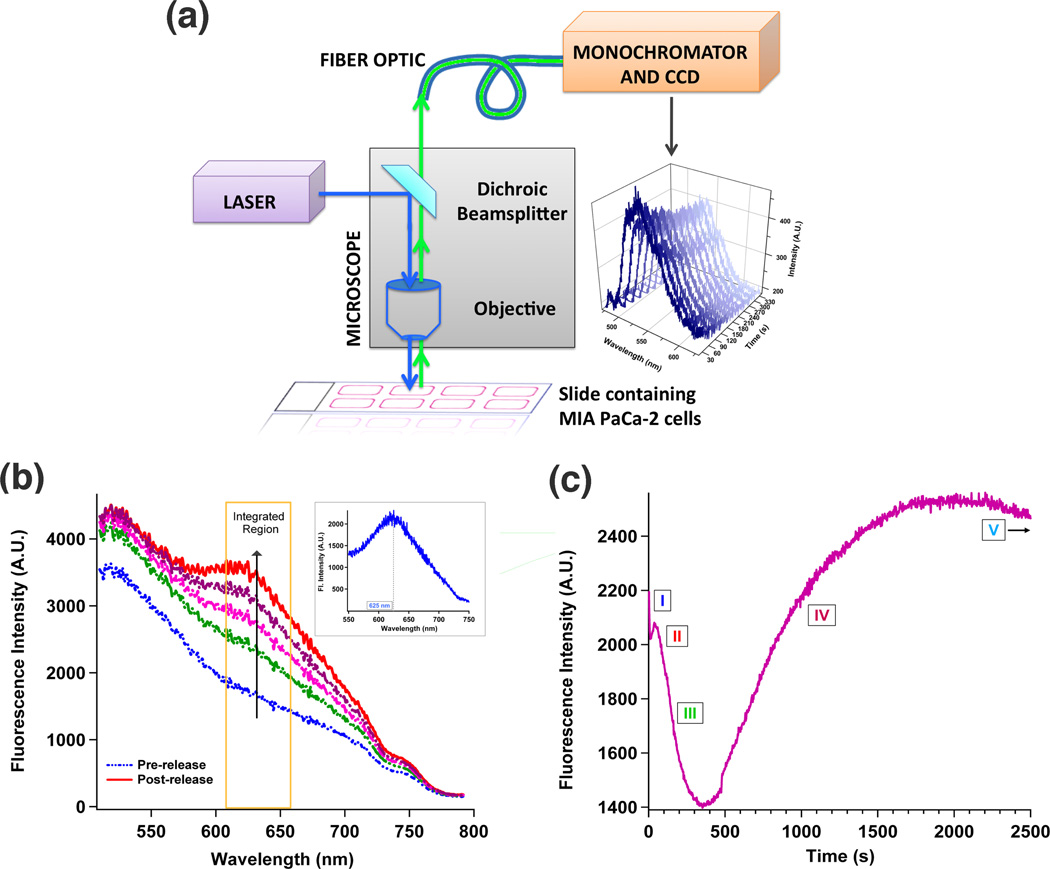
Next, Azo-NP’s photo-driven performance in an intracellular environment was investigated. The instrument used for this study, shown in Figure 2a, consists of an epifluorescence microscope with laser excitation and spectroscopic detection [Methods, Supporting Information†]. By incorporating a laser beam source to the microscope and coupling a fiber optic to a spectrometer, Azo-NP can be precisely activated, and changes in real-time emission from a single cell can be acquired. When a laser beam (408 nm, 30 mW) is directed onto a single MIA PaCa-2 cancer cell with internalized Azo-NP [Fig. S12, Supporting Information†], fluorescence emission with a peak at 530 nm is observed (stacked spectra in Figure 2a). As shown in the stack plot, fluorescence intensity in this spectral region decreases steadily during the first 200 seconds of irradiation. The decrease is caused by bleaching of the cell autofluorescence and the attainment of the azobenzene’s photo-stationary state, with the first process occurring on a faster time scale than the latter. A single cell without Azo-NP excited at this wavelength as a control exhibits only an emission centered at 515 nm with intensity attenuated within 30 seconds of irradiation [Fig. S13, Supporting Information†]. In a separate control experiment, a small cluster of Azo-NP (not in cells) excited at this wavelength exhibits an emission centered at 520 nm with intensity attenuated after 165 seconds of irradiation [Fig. S14, Supporting Information†]. These data suggest that a major portion of the intensity attenuation in the first 200 seconds of irradiation is due to the attaining of the azobenzene’s photo-stationary state. Since fluorescence emission can be used to identify the cis-trans motion inside the pores of Azo-NP, the observed intracellular emissions at 530 nm demonstrated Azo-NP’s performance in a cellular environment.
Fig. 2. Monitoring fluorescence changes inside a single living cell.
(a) Epifluorescence spectroscopy instrument. A conventional epifluorescence microscope was modified to include laser excitation and spectroscopic detection. Intracellular luminescence was coupled to a spectrometer via a fiber optic. An emission band centered at 520 nm was observed when a laser beam was directed onto a single cancer cell internalized with Azo-NP (stacked spectra). (b) Intracellular spectral changes were monitored in real-time as Azo-NP, loaded with PI molecules was excited (408 nm, 12 mW) inside a single cell. Subtracting the pre-release trace from that of the post-release results in a difference spectrum with an emission maximum centered at 625 nm (inset). (c) Plotting intensity changes at PI’s emission maxima (620 – 660 nm) as a function of time gives rise to this release profile. Five distinctive regions, representing different intermediate processes of the intracellular delivery event are labeled with Roman numerals.
2.4 PI intercalation with nuclear DNA
Delivery of PI to the cell nucleus is monitored through the spectroscopic changes in wavelengths and intensities. Activation of the dynamic photo-isomerization motion within the pores of Azo-NP causes the release of PI molecules inside a living cell. PI was chosen as the probe because its fluorescence intensity increases at least tenfold upon intercalation with nuclear DNA.46,47 This increase occurs because DNA provides a hydrophobic environment for PI, and shields PI from quenching by water. The emission maximum of PI lies to the red of those from Azo-NP and the cell and fluorescence overlap between them is minimal. Using the same instrument and excitation wavelength as in the second study, the laser beam (12 mW) was directed and focused onto a single cell that had internalized Azo-NP loaded with PI molecules. Continuous spectroscopic monitoring of the cell between 500 and 800 nm disclosed the temporal development of a peak centered at 625 nm (Figure 2b). Subtracting the spectrum at the start of the release (t = 0 s) from those taken towards the end of the release (t = 2000 s) confirms the presence of the 625 nm peak (inset of Figure 2b), 20 nm offset from PI’s emission in water. This hypsochromic shift is attributed to PI intercalation with nuclear DNA.47
2.5 Spectral analysis of the delivery event
Subtle changes in peak maxima and intensities are related to the probe molecules’ locations within the cellular matrix, thereby serving as a tracking system to trace the course of PI’s development inside a cell. Plotting the intensity of PI’s emission maximum as a function of time shows five distinctive regions, labeled in the release profile of Figure 2c. The first region (t = 0 to t = 25 s) is defined by the initial decrease in intensity. The small peak (t = 25 to t = 65 s) that follows is designated as the second region. The large intensity decrease from 65 to 400 s is the third region. This is followed by the large intensity increase, from 400 to 2000 s, which set the bounds for the fourth region. Lastly, the progressive flattening marks the beginning of the fifth region (t = 2000 to t = 2500 s). Each region represents a key stage to the intracellular delivery event, and spectral changes from these regions were used to disclose the interweaving intricacies between molecular interactions, chemical changes and biological responses inside a living cell. Not only do these spectral changes establish a spatial-temporal continuum of the fluorophore’s successive positions inside a cell, they also provide a means to address the timeframe and the rate for each process.
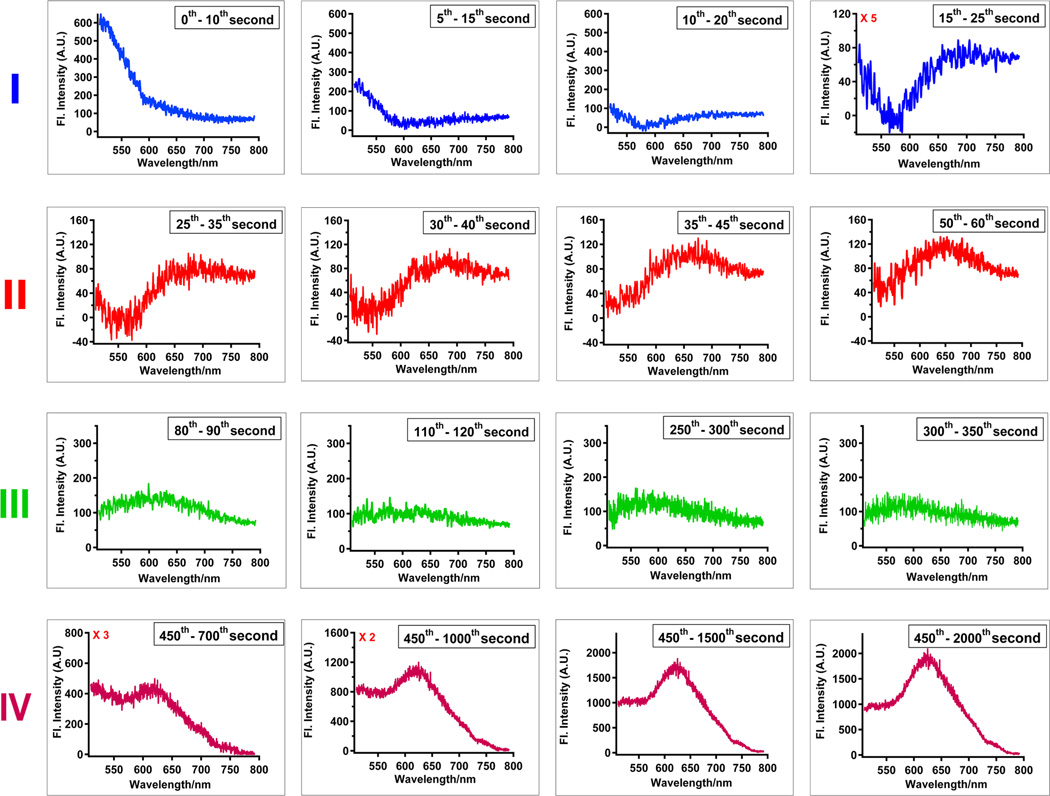
For each region in Figure 2c (except region (V)), a sequence of difference spectra are plotted to demonstrate a change in peak intensity, peak maximum, or both. The trend of the release curve consists of two regions with decrease in intensity: Regions (I) and (III) and two regions with increase in intensity: Regions (II) and (IV). The initial decrease is a faster timescale component representing the rapid loss of autofluorescence and the attainment of azobenzene’s photo-stationary state, as evidenced by the set of difference spectra shown on the top row of Figure 3. These spectra are generated by taking the difference between two spectra that are 10 seconds apart. From left to right, gradual attenuation of the emission band with maximum at 530 nm was observed, which is consistent with the intracellular emissions observed from the second study. As azobenzene molecules undergo large amplitude motion inside the pore channels, simultaneous release of PI molecules is observed as exhibited by the peak beginning to appear at ~ 645 nm (last spectrum of Region (I)). The small rise in intensity from 25 to 65 s (Region (II)) is caused by an increasing amount of PI molecules released from the pores, which is substantiated by the gradual sharpening of the emission peak at 645 nm, one that can be easily discerned and identified as the fluorescence emission of PI. As PI molecules were traversing in the cytoplasm, they were photo-bleached by the laser beam. Such photo-bleaching effects were illustrated by the flattening of the emission peak displayed in the set of difference spectra in region (III). The final gain in intensity is attributed to the increase in fluorescence as PI molecules intercalate with nuclear DNA. This is demonstrated by the gradual increase and refinement of the fluorescence peak centered at 625 nm (difference spectra in region (IV)). It is important to note that the magnitude of intensity increase between regions (II) and (IV) is a result of the tenfold increase in fluorescence of PI molecules upon nuclear intercalation. Furthermore, the hypsochromic shift of the PI emission maximum from 645 nm in region (II) to 625 nm in region (IV) is characteristic of the PI migration to a hydrophobic environment, signaling its diffusion from the cytoplasm to the nucleus. Finally, intensity was maximized after 2000 s, and a small decrease was observed at longer time, indicative of slow photo-bleaching of PI in the nucleus.
Fig. 3. Difference spectra for four regions of the release profile (Fig.2c).
Delivery of PI to the cell nucleus is monitored through the changes in peak maxima and intensities. A sequence of difference spectra were plotted for each of the time regions in Fig. 2c. Region (I) [t = 0 to 25 s] illustrates the photo-bleaching of the cell’s auto-fluorescence and the attainment of azobenzene’s photostationary state (gradual photo-attenuation of the emission band centered at 525 nm). As azobenzene molecules undergo dynamic motion within the pores, release of PI molecules was observed starting at the last spectrum of region (I) and throughout all the spectra in region (II) [t = 25 to 65 s]. The emission maximum is centered at 645 nm. Photo-bleaching effects, illustrated by the flattening of the emission peak, were observed as the released PI molecules traversed the cytoplasm (Region (III) [t = 65 to 400 s]). The increase in fluorescence intensity and sharpening of the peak, centered at 625 nm, is evidence of PI intercalating with nuclear DNA (Region (IV) [t = 400 to 2000 s]).
2.6 Correlation of delivery rate with incident laser power
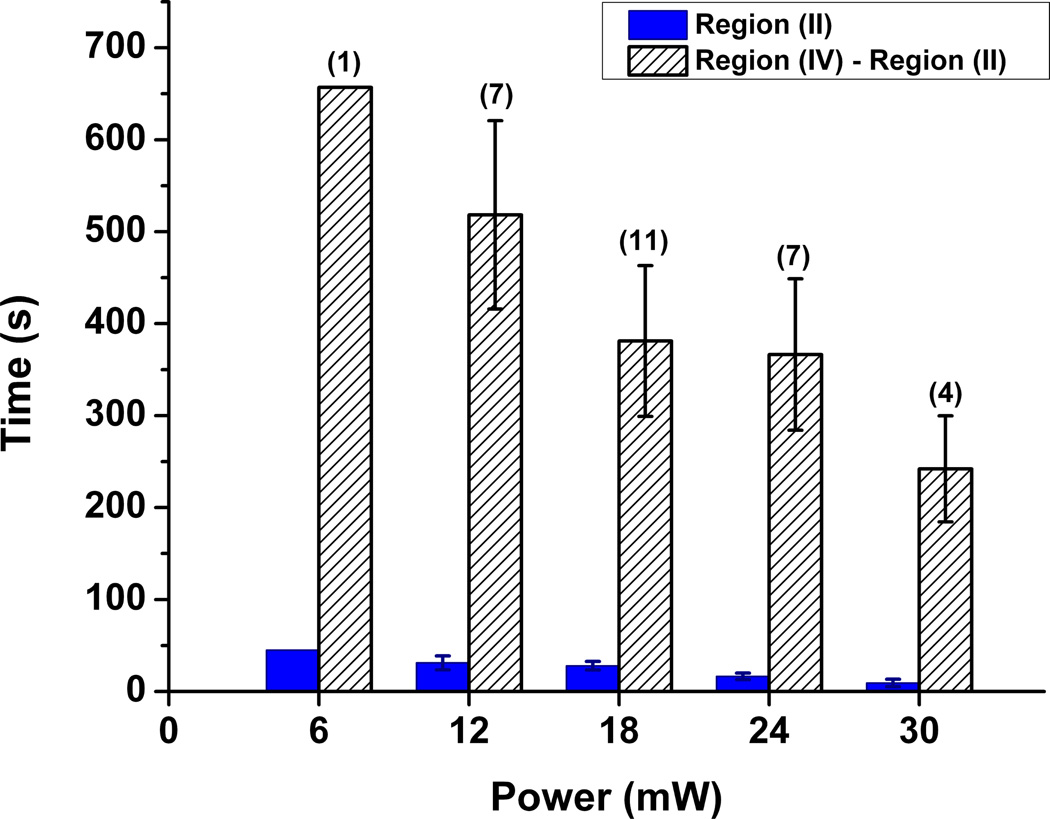
By tracking individual cells, the effects of laser power on the release of cargo molecules were characterized. Specifically, the relationship between laser power and cargo release rate was established by tracking over a collection of cells for each laser power (except 6 mW). Power levels, ranging from 6 to 30 mW were surveyed. For each irradiation power, release profiles of individual cells over time were obtained. From these release profiles, two sets of data were extracted: the time it takes for all PI molecules to leave the pores (i.e. the top of region (II)) and the time lapse between PI coming out of the pores and its intercalation with nuclear DNA (vertical rise in the beginning of region (IV)). The results are shown in figure 4 by the solid and striped bars, respectively. As expected, an increase in power causes an increasing rate of PI release, which in turn led to faster nuclear intercalation. This is to be expected due to the interdependency of both events; the increased rate of expulsion caused by Azo-NP was translated to faster increase in fluorescence intensity as a result of PI intercalation in the cell nucleus. Not only does this correlation study show that the rate of cargo release is power-dependent, it also sheds light on the rate of release in a cellular environment, as a function of external stimulus.
Fig. 4. Power-dependence studies.
The two-bar graph represents the time it takes for the release of PI from Azo-NP (solid) and for the released PI molecules to intercalate with nuclear DNA (striped). The computed error bars are standard error of the mean. The numbers on top of the bars represent the number of trials performed at a particular power setting.
2.7 Eliminating thermal heating as a means to initiate Azo-NP
To ensure that the in vitro light-driven release event is not a by-product of laser heating of the cells, 514 nm light (30 mW) was used to excite cells containing PI-loaded Azo-NPs. Since green light cannot excite azobenzene cis/trans motions, PI should remain localized within the pores and no emission increase should be observed. Indeed, emission spectra before and after 50 minutes of irradiation [Fig. S15, Supporting Information†] confirm that no nuclear staining occurred. This finding is consistent with the solution study results [Fig. S9, Supporting Information†]. To ascertain that our experimental conditions did not significantly decrease cell viability, cytotoxicity assays were performed [Methods in Supporting Information†]. Results indicate that neither Azo-NP nor the laser beam cause significant killing of the cells [Fig. S16, Supporting Information†].
2.8 Imaging the release of PI on a single cell level
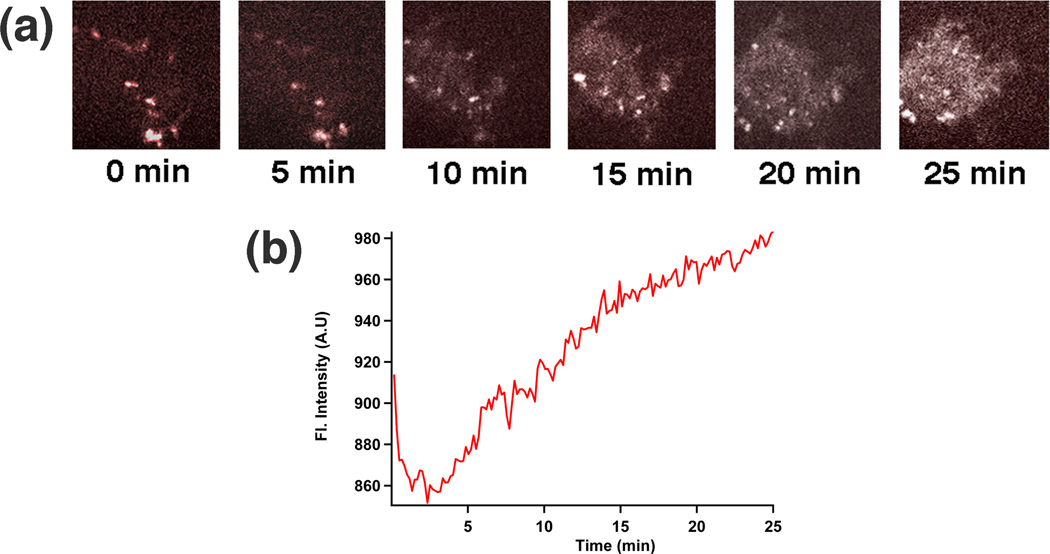
Finally, another real-time technique, spinning disk confocal microscopy [Methods, Supporting Information†], was used to image changes that occurred in a cell nucleus as a result of the delivery event. This technique enables high-speed continuous imaging of the cells and spectral separation of background fluorescence using two laser sources: one for Azo-NP excitation (405 nm) and another for imaging (488 nm). The 488 nm frames (Figure 5) were collected, colorized, and compiled. Even at relatively low excitation intensities, the increase in fluorescence as PI molecules intercalate with nuclear DNA is dramatic. Sequential developments of the nucleus taken from various timeframes details stages of nuclear staining on a single cell level (Figure 5a). As seen, only a faint outline of the cell nucleus could be visualized in the first 5 minutes. At the 10th minute, the nucleus gradually brightened and by the 25th minute, almost the entire nucleus was brightly fluorescent. Using the software, Image J, the luminescence intensity for each image was quantified and graphed (Figure 5b). The changes in total intensity of the cell nucleus using spinning disk microscopy parallels the release profile from Figure 2c, and supports the findings that were obtained.
Fig. 5. Real-time imaging of the intracellular delivery event.
(a) Real-time confocal images taken by spinning disk confocal microscopy show the increase of the staining of a cell’s nucleus by PI as a function of time. (b) Plot of the total intensity increase of a cell’s nucleus as a function of time.
3 Conclusion
In summary, the first study that is focused on the spectroscopic visualization of a photo-induced intracellular delivery event from nanoparticles is reported. Through the use of epifluorescence spectroscopy, all the intermediate steps of the event from the dynamics of the molecular machine through the rate of PI release from the pores to PI’s eventual nuclear staining were continuously observed and spectrally identified. Sequential analyses of difference spectra transformed static spectral snapshots into a dynamic continuum, where key stages of the event were presented and time-stamped. The excitation intensity study provided a means of identifying the cause-and-effect relationship between laser power and rate of nanomachine-induced release of molecules. It also suggests that stochastic cellular responses can sometimes follow a structural pattern when studied as a collection of single cells. The approaches that were employed here open a new direction for real-time observations of on-command release experiments in vitro. The fact that remote activation of a chemical reaction and its subsequent biological responses can be continuously observed in a single cell will be important in many cell biology studies, and paves a new way to evaluate drug-delivery nanosystems.
Supplementary Material
Acknowledgements
The authors thank E. Choi for her help in the early stage of the project. In addition, the authors thank M. Xue, S. Yang and J. Dong for their helpful suggestions and discussions and Z. Li for her technical assistance. This work was supported by NSF CHE 0809384 and NIH R01CA133697. Part of this work made use of the Electron Imaging Center for Nanomachines (EICN) and Advanced Light Microscopy/Spectroscopy (ALMS) center, both located at California NanoSystem Institute (CNSI).
Footnotes
Electronic Supplementary Information (ESI) available. See DOI: 10.1039/b000000x/
References
- 1.Ballardini R, Balzani V, Credi A, Gandolfi MT, Venturi M. Accounts Chem. Res. 2001;34:445–455. doi: 10.1021/ar000170g. [DOI] [PubMed] [Google Scholar]
- 2.Balzani V, Gómez-Löpez M, Stoddart JF. Accounts Chem. Res. 1998;31:405–414. [Google Scholar]
- 3.Browne WR, Feringa BL. Nature Nanotech. 2006;1:25–35. doi: 10.1038/nnano.2006.45. [DOI] [PubMed] [Google Scholar]
- 4.Kresge CT, Leonowicz ME, Roth WJ, Vartuli JC, Beck JS. Nature. 1992;359:710–712. [Google Scholar]
- 5.Beck JS, Vartuli JC, Roth WJ, Leonowicz ME, Kresge CT, Schmitt KD, Chu CTW, Olson DH, Sheppard EW. J. Am. Chem. Soc. 1992;114:10834–10843. [Google Scholar]
- 6.Huo Q, Margolese DI, Ciesla U, Demuth DG, Feng P, Gier TE, Sieger P, Firouzi A, Chmelka BF. Chem. Mater. 1994;6:1176–1191. [Google Scholar]
- 7.Vallet-Regi M, Ramila A, Del Real RP, Perez-Pariente J. Chem. Mater. 2001;13:308–311. [Google Scholar]
- 8.Angelos S, Johansson E, Stoddart ad JF, Zink JI. Adv. Funct. Mater. 2007;17:2261–2271. [Google Scholar]
- 9.Cotí KK, Belowich ME, Liong M, Ambrogio MW, Lau YA, Khatib HA, Zink JI, Khashab NM, Stoddart JF. Nanoscale. 2009;1:16–39. doi: 10.1039/b9nr00162j. [DOI] [PubMed] [Google Scholar]
- 10.Greenspan P, Fowler SD. J. Lipid Res. 1985;26:781–789. [PubMed] [Google Scholar]
- 11.Graber ML, DiLillo DC, Friedman BL, Pastoriza-Munoz E. Anal. Biochem. 1986;156:202–212. doi: 10.1016/0003-2697(86)90174-0. [DOI] [PubMed] [Google Scholar]
- 12.Clark HA, Kopelman R, Tjalkens R, Philbert MA. Anal. Chem. 1999;71:4837–4843. doi: 10.1021/ac990630n. [DOI] [PubMed] [Google Scholar]
- 13.Vivian JT, Callis PR. Biophys. J. 2001;80:2093–2109. doi: 10.1016/S0006-3495(01)76183-8. [DOI] [PMC free article] [PubMed] [Google Scholar]
- 14.Jordanides XJ, Lang MJ, Song X, Fleming GR. J. Phys. Chem. B. 1999;103:7995–8005. [Google Scholar]
- 15.Shav-Tal Y, Singer RH, Darzacq X. Nature Rev. Mol. Cell Biol. 2004;5:855–862. doi: 10.1038/nrm1494. [DOI] [PMC free article] [PubMed] [Google Scholar]
- 16.Levsky JM, Singer RH. Trends Cell Biol. 2003;13:4–6. doi: 10.1016/s0962-8924(02)00002-8. [DOI] [PubMed] [Google Scholar]
- 17.Zimmermann T, Rietdorf J, Pepperkok R. FEBS Letters. 2003;546:87–92. doi: 10.1016/s0014-5793(03)00521-0. [DOI] [PubMed] [Google Scholar]
- 18.Larson JM. Cytom. Part A. 2006;69:825–834. doi: 10.1002/cyto.a.20305. [DOI] [PubMed] [Google Scholar]
- 19.Meng H, Xue M, Xia T, Zhao YL, Tamanoi F, Stoddart JF, Zink JI, Nel AE. J. Am. Chem. Soc. 2010;132:12690–12697. doi: 10.1021/ja104501a. [DOI] [PMC free article] [PubMed] [Google Scholar]
- 20.Patel K, Angelos S, Dichtel WR, Coskun A, Yang YW, Zink and Stoddart JI, Stoddart JFJ. Am. Chem. Soc. 2008;130:2382–2383. doi: 10.1021/ja0772086. [DOI] [PubMed] [Google Scholar]
- 21.Mu L, Feng SS. J. Controlled Release. 2003;86:33–48. doi: 10.1016/s0168-3659(02)00320-6. [DOI] [PubMed] [Google Scholar]
- 22.Febvay S, Marini DM, Belcher AM, Clapham DE. Nano Lett. 2010;10:2211–2219. doi: 10.1021/nl101157z. [DOI] [PMC free article] [PubMed] [Google Scholar]
- 23.Huschka R, Neumann O, Barhoumi A, Halas NJ. Nano Lett. 2010;10:4117–4122. doi: 10.1021/nl102293b. [DOI] [PMC free article] [PubMed] [Google Scholar]
- 24.Ferris DP, Zhao YL, Khashab NM, Khatib HA, Stoddart JF, Zink JI. J. Am. Chem. Soc. 2009;131:1686–1688. doi: 10.1021/ja807798g. [DOI] [PubMed] [Google Scholar]
- 25.Lu J, Choi E, Tamanoi F, Zink JI. Small. 2008;4:421–426. doi: 10.1002/smll.200700903. [DOI] [PMC free article] [PubMed] [Google Scholar]
- 26.Angelos S, Yang YW, Khashab NM, Stoddart JF, Zink JI. J. Am. Chem. Soc. 2009;131:11344–11346. doi: 10.1021/ja9042752. [DOI] [PubMed] [Google Scholar]
- 27.Angelos S, Choi E, Vögtle F, De Cola L, Zink JI. J. Phys. Chem. C. 2007;111:6589–6592. [Google Scholar]
- 28.Thomas CR, Ferris DP, Lee JH, Choi E, Cho MH, Kim ES, Stoddart JF, Shin JS, Cheon J, Zink JI. J. Am. Chem. Soc. 2010;132:10623–10625. doi: 10.1021/ja1022267. [DOI] [PubMed] [Google Scholar]
- 29.Choi SW, Zhang Y, Xia Y. Angew. Chem.. Int. Ed. 2010;49:7904–7908. doi: 10.1002/anie.201004057. [DOI] [PMC free article] [PubMed] [Google Scholar]
- 30.Okano T, Bae YH, Jacobs H, Kim SW. J. Controlled Release. 1990;11:255–265. [Google Scholar]
- 31.Liu N, Dunphy DR, Atanassov P, Bunge SD, Chen Z, López GP, Boyle TJ, Brinker CJ. Nano Lett. 2004;4:551–554. [Google Scholar]
- 32.Liu N, Chen Z, Dunphy DR, Jiang YB, Assink RA, Brinker CJ. Angew. Chem. Int. Ed. 2003;42:1731–1734. doi: 10.1002/anie.200250189. [DOI] [PubMed] [Google Scholar]
- 33.Hartley GS. Nature. 1937;140:281. [Google Scholar]
- 34.Fujino T, Arzhanstev SY, Tahara T. J. Phys. Chem. A. 2001;105:8123–8129. [Google Scholar]
- 35.Tamai N, Miyasaka H. Chem. Rev. 2000;100:1875–1890. doi: 10.1021/cr9800816. [DOI] [PubMed] [Google Scholar]
- 36.Shimomura M, Kunitake T. J. Am. Chem. Soc. 1987;109:5175–5183. [Google Scholar]
- 37.Tung CH, Guan JQ. J. Org. Chem. 1996;61:9417–9421. [Google Scholar]
- 38.Lei Z, Vaidyalingam A, Dutta PK. J. Phys. Chem. B. 1998;102:8557–8562. [Google Scholar]
- 39.Tsuda K, Dol GC, Gensch T, Hofkens J, Latterini L, Weener JW, Meijer EW, De Schryver FC. J. Am. Chem. Soc. 2000;122:3445–3452. [Google Scholar]
- 40.Sierocki P, Maas H, Dragut P, Richardt G, Vögtle F, De Cola L, Brouwer FAM, Zink JI. J. Phys. Chem. B. 2006;110:24390–24398. doi: 10.1021/jp0641334. [DOI] [PubMed] [Google Scholar]
- 41.Smitha P, Asha SK. J. Phys. Chem. B. 2007;111:6364–6373. doi: 10.1021/jp071303j. [DOI] [PubMed] [Google Scholar]
- 42.Harbron EJ, Vicente DA, Hadley DH, Imm MR. J. Phys. Chem. A. 2005;109:10846–10853. doi: 10.1021/jp054394y. [DOI] [PubMed] [Google Scholar]
- 43.Han M, Hara M. J. Am. Chem. Soc. 2005;127:10951–10955. doi: 10.1021/ja0509275. [DOI] [PubMed] [Google Scholar]
- 44.Bo Q, Zhao Y. Langmuir. 2007;23:5746–5751. doi: 10.1021/la063551x. [DOI] [PubMed] [Google Scholar]
- 45.Morgante CG, Struve WS. Chem. Phys. Lett. 1979;68:267–271. [Google Scholar]
- 46.Waring MJ. J. Mol. Biol. 1965;13:269–282. doi: 10.1016/s0022-2836(65)80096-1. [DOI] [PubMed] [Google Scholar]
- 47.Arndt-Jovin DJ, Jovin TM. Fluorescence microscopy of living cells in culture. Volume 30. San Diego, CA: Academic Press; 1989. [Google Scholar]
Associated Data
This section collects any data citations, data availability statements, or supplementary materials included in this article.


