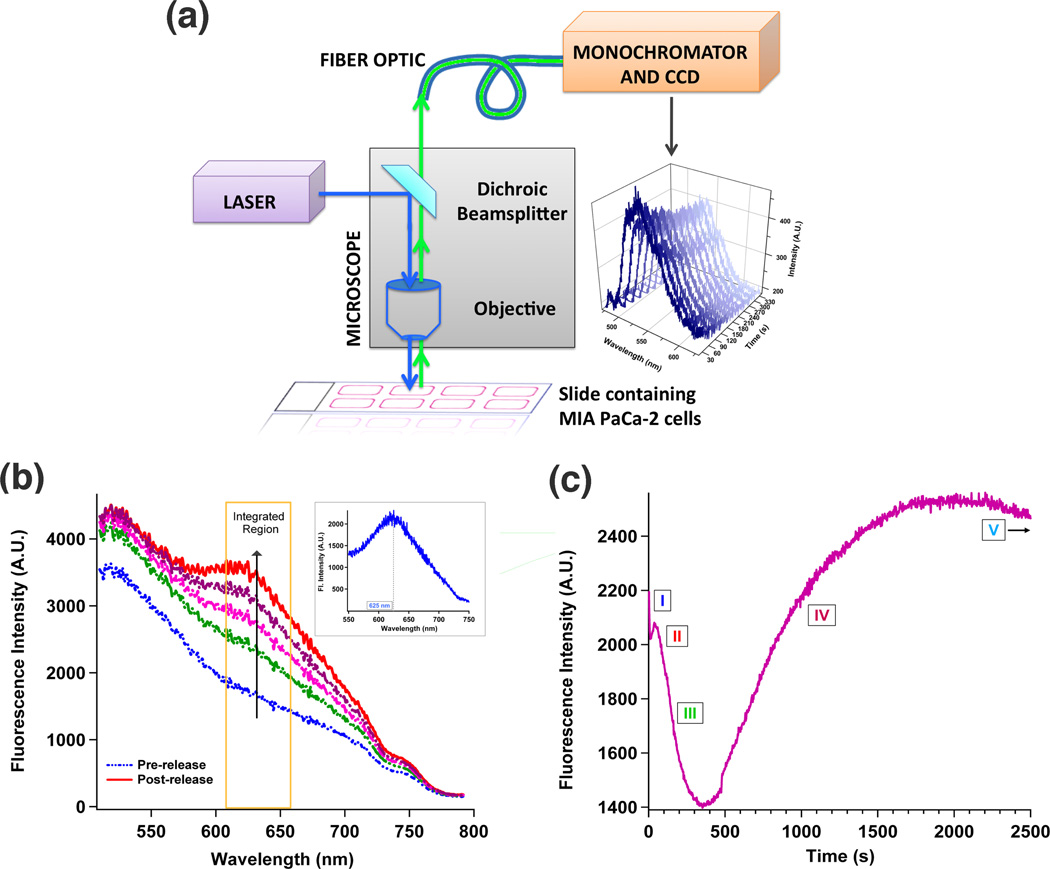
Fig. 2. Monitoring fluorescence changes inside a single living cell.
(a) Epifluorescence spectroscopy instrument. A conventional epifluorescence microscope was modified to include laser excitation and spectroscopic detection. Intracellular luminescence was coupled to a spectrometer via a fiber optic. An emission band centered at 520 nm was observed when a laser beam was directed onto a single cancer cell internalized with Azo-NP (stacked spectra). (b) Intracellular spectral changes were monitored in real-time as Azo-NP, loaded with PI molecules was excited (408 nm, 12 mW) inside a single cell. Subtracting the pre-release trace from that of the post-release results in a difference spectrum with an emission maximum centered at 625 nm (inset). (c) Plotting intensity changes at PI’s emission maxima (620 – 660 nm) as a function of time gives rise to this release profile. Five distinctive regions, representing different intermediate processes of the intracellular delivery event are labeled with Roman numerals.

