Abstract
SERCA is an important model system for understanding the molecular details of conformational change in membrane transport systems. This reflects the large number of solved x-ray structures and the equally large database of mutations that have been assayed. In this computational study we provide a molecular dynamics description of the conformational changes during the E1P -> E2P transitions. This set of states further changes with insertion mutants in the A-M3 linker region. These mutants were experimentally shown to lead to significant shifts in rates between the E1P -> E2P states. Using the population shift framework and dynamic importance sampling method along with coarse-grained representations of the protein, lipid and water, we suggest why these changes are found. The calculations sample on intermediates and suggest that changes in interactions, individual helix interactions and water behavior are key elements in the molecular compositions that underlie shifts in kinetics. In particular, as the insertion length grows, it attracts more water and disrupts domain interactions, creating changes as well at the sites of key helix interactions between the A-Domain and the P-Domain. This provides a conceptual picture that aids understanding of the experimental results.
Keywords: CaATPase, SERCA, conformational transition, SERCA catalytic cycle, molecular dynamics, DIMS, coarse-grained simulation
Introduction
Starting from the report of Toyoshima et al. 1 of the first crystal structure of CA-ATPase or SERCA in 2000, to this day, X-ray structures of many intermediates of the catalytic cycle have been solved 2-7. With the growing number of X-ray structures in multiple conformations, this system may provide the ideal candidate to understand in great molecular detail the process of conformational change that underlie the function both within this ATPase and also within other members of the P-ATPase family. P-ATPases are important integral membrane proteins, which pump ions (such as H+, Na+, K+ and Ca2+) across the membrane and are critical for maintaining the ion concentration gradient. One of the best characterized proteins within this P-type ATPase family is SERCA. SERCA functions to pump Ca2+ against the concentration gradient using the energy derived from ATP hydrolysis, from the cytoplasm into the reticulum and so maintain the proper calcium balance for muscle cells 7-9. SERCA pumps have been found to be essential in Ca2+ signaling pathways 10, 11. They are also associated with several human diseases such as Darier-White's disease and Brody disease 12-14. A full molecular understanding of how conformational change is supported by the structures would aid understanding of these diseases and may lead to new drug therapies.
The transport cycle of SERCA begins (Figure 1) when the E2 state binds two Ca2+ ions at the high affinity binding site that faces the cytoplasm, and MgATP binds at Asp351, to form the E1P state 15. In this state Ca2+ ions are occluded with no access to the membrane. Large scale domain motions and structural organization of the molecular machinery enables the Ca2+ ions to be released into the lumen in the E2P state 16, 17. Finally, Asp351-acylphosphate in the E2P state is hydrolyzed to form the inactive E2 state. From the X-ray structures of the intermediate states, it is clear that the large scale domain motion and rearrangement takes place in the cytoplasmic side as well as in the transmembrane helices during this catalytic cycle.
Figure 1.
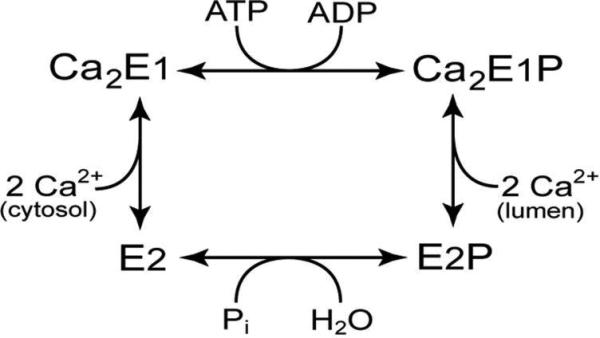
Catalytic cycle of SERCA
SERCA consists of a single polypeptide chain of 994 amino acids folded into three cytoplasmic domains and 10 transmembrane (TM) helices (M1-M10) 18. The three cytoplasmic domains, namely the nucleotide binding (N), phosphorylation (P) and the actuator domains (A), undergo large motions during the catalytic cycle. The A-Domain contains the signature sequence motif TGES, which plays an important role in dephosphorylation 19-21. The P-Domain contains Asp351, which is the phosphorylation site. Both A and P-Domains are connected to the TM region through linker regions. The A-Domain is connected to the transmembrane helices M1, M2 and M3 by three flexible linker regions and works as the actuator of the gating mechanism in the transmembrane region regulating the Ca2+ binding and release. These linker regions are thought to be very flexible since the lack of structure in these regions is indicated in the crystal structures 15. The three linker regions are thought to be crucial in the rearrangements that take place in the transmembrane helices as well as the cytoplasmic domains 22, 23. The rotation of the A-Domain is likely to be triggered by the strain imposed on the A-M3 linker in the E1 state 15. Because the A-Domain is linked to the transmembrane helices through the linker regions, the rotation of the A-Domain maybe a key event in opening the gate to release the Ca2+ ions into the lumen.
The x-ray structures of various intermediates in the catalytic cycle show snapshots of the protein at each state. But how does SERCA go from one state to another? What are the various forces that drive such large conformational changes? In order to understand the dynamics of the pumping mechanism, molecular details of the conformational changes observed using the insights from x-ray structures have to be studied. These molecular descriptions of the conformational changes can be studied using computational methods. Molecular dynamics (MD) has been an important tool to simulate the motion of proteins to understand the dynamics at the molecular level 24-26. Equilibrium MD simulates the protein in the native state. These simulations are useful when one tries to understand the stability and the nature of one state of the protein. However this method is not useful to observe conformational changes, as these are infrequent or rare events. A long time is spent in sampling the stable state well but the time spent in undergoing the transition is much smaller. When the two end states of a conformational change are already known, it is possible to compute transitions between them. Many methods have been developed to obtain transitions between two experimentally determined structures of a protein, such as targeted molecular dynamics 27, 28, steered molecular dynamics 29, 30 and transition path sampling methods 31-34. In targeted MD, a subset of atoms is guided towards the target structure. The root mean square difference (RMSD) between the starting and the ending structure is used to steer the atoms. Although targeted and steered MD can find multiple pathways, they do not sample on these pathways and don't correct for the force that is used to steer the system. It is also important to choose a method which computes transitions that are representative of the natural transitions 35. In this study, we use dynamic importance sampling (DIMS) 36 to compute transitions between the E1P state and the E2P state of SERCA. DIMS is able to rapidly generate ensembles of transitions from the E1P to the E2P state. One advantage of DIMS over the previous methods is that it can generate families of diverse transitions between the same starting and ending states.
Research into the underlying mechanisms of large conformational change has suggested that the change is inherent in the protein structure and not dependent only on the cofactors. This has come to define a model called the ‘population shift’ framework, where an understanding of the molecular nature of conformational change can be determined by consideration of the protein structure by itself, without the presence of the cofactors 37. This computational framework is important for our study of SERCA, since the computational analysis of when the co-factors arrive and leave along with their parameterization for our CHARMM based empirical force-field, would be very difficult. Instead, working within the population shift framework, we argue that the details of the free energy surface will clearly change with co-factors, but that the dominant protein factors that drive the large conformational change can be understood by an initial consideration of the apo-protein by itself.
Apart from x-ray structures, several mutational studies ranging from point mutations of key residues in the cytoplasmic domains 19, 20, 38, 39, to insertions and deletions in the linker regions connecting the A-Domain and the transmembrane helices have been reported 22, 23, 40. They have shown important regions of SERCA that affect ATPase activity and stability of certain states in the catalytic cycle. In one study, it was observed that the length of the A-M3 linker region is crucial in determining the rates of the reactions in the transport cycle 22. Hence, the length of the A-M3 linker region was varied by inserting glycine and proline residues incrementally. Up to 41 residues were inserted while still preserving the catalytic activity of SERCA. Deletion mutations were also carried out in order to study the effects of shortening the linker region. The rates of conversion between the E2 -> E1 state and the E1P -> E2P states in the catalytic cycle were dramatically affected.
In this study, we focus on a subset of the catalytic cycle, the E1P -> E2P transition. In the crystal structures of the E2P states of SERCA, the formation of A3 helix in the N-terminal part of the A-M3 linker region is seen 15. This is associated with the rotation of the A-Domain. In the E1P state, the A-M3 linker region is stretched out completely. As the A-Domain rotates, the stretched A-M3 linker region relaxes, which allows the formation of the A3 helix (Figure 2). Hence, strain in the A-M3 linker was suggested as a driving force for the E1P -> E2P transition22. Here, we report the significance of the interaction between the A3 helix and the P-Domain helices in the E1P -> E2P transition. We also discuss the interactions with water and the effect it has on the free energy changes of the transition. The free energy profiles of the transitions show increased stability of the E1P state as we increase the number of inserts. This, we believe is due to the stabilizing interactions of the A3 helix and the P-Domain helices. The estimated rates computed from the free energy values show a good correlation with the experimentally reported values.
Figure 2.
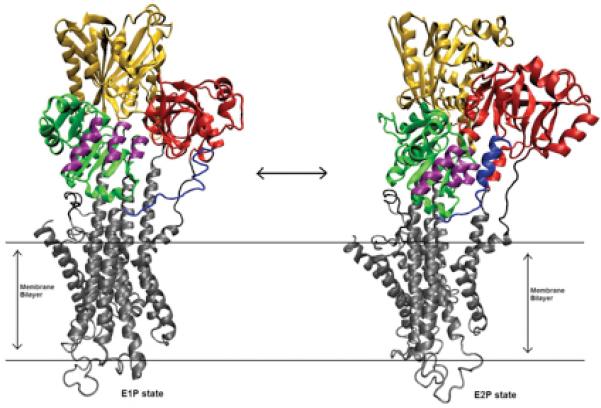
E1P (2ZBD) and E2P (1WPG) states of SERCA. The A-Domain (red) rotates about 90° in the E2P state. P-Domain (green) has three helical regions P5,P6 and P7 (purple) which interacts with the A3 helix (blue) in the E2P state. N-Domain (yellow) also moves to accommodate A-Domain rotation. Rearrangements also take place in the transmembrane helices (gray)
Methods
Coarse grained simulation
While detailed all-atom simulations may give the most accurate information about the behavior of the system, the detail captured means timescales explored are short. As the size of the system increases, the number of computations increases many folds. To overcome this limitation, we have employed a coarse grained force field to model our system. This enables greater sampling and also allows us to access details of the simulations as well. The recent coarse graining method developed by the Marrink group, MARTINI, with the extension to proteins is used in this study 41. In order to be able to compute transitions between the E1P and E2P of SERCA using DIMS, we ported the MARTINI force field in CHARMM. All the bead representations were maintained to be the same as the original force field. The original 4:1 mapping of atoms to beads and the parameter for each bead was preserved as in the MARTINI force field. More details about the implementation of MARTINI in CHARMM can be found in the supplemental material.
SERCA Structures and Models
The structures of Rabbit SR Ca2+ (PDB ID - 2ZBD) in the E1P state and (PDB ID - 1WPG) in the E2P state were used as the starting and ending states for creating the ensemble of DIMS transitions 15. The bound calcium, ADP and aluminium fluoride was removed from the starting structures. Similarly, from the ending structure, MGF4 was removed. With the two structures as templates, the insertions, deletions and mutations were made so that each mutant will have a consistent starting and an ending state. The mutants are summarized in Table 1 along with their symbols that are used to refer to them. A lipid bilayer of 456 coarse grained DOPC lipids was created. The transmembrane region of the protein was aligned with the bilayer and 16,368 coarse grained waters were used to solvate the simulation box with dimensions 190 Å × 150 Å × 145 Å. The starting and ending structure for each mutant is equilibrated for 1ns. A family of transitions was then generated for each mutant using the respective start and end states using DIMS.
Table 1.
Insertion, Substitution and Deletion mutants and their symbols
| Mutants | Symbol |
|---|---|
| 243/244 1G | LM1 |
| 243/244 3G | LM2 |
| 243/244 5G | LM3 |
| E243G-Q244G + 243/244 5G | LM4 |
| 243/244 7G | LM5 |
| 243/244 9G | LM6 |
| 243/244 5G 1P 5G | LM7 |
| 243/244 5G 1P 4G 1P 5G | LM8 |
| 243/244 5G 1P (4G 1P)3 5G | LM9 |
| 243/244 5G 1P (4G 1P)6 5G | LM10 |
| E243del | LM11 |
| Q244del | LM12 |
| E243del-Q244del | LM13 |
| K234G | LM14 |
| K234A | LM15 |
| 233/234 1G | LM16 |
| 233/234 3G | LM17 |
Dynamic Importance Sampling
In order to compute the transitions between the E1P and the E2P states of SERCA we use (DIMS) 33, 36, 42-45 which is available in version 35b2 of the CHARMM program 46. The main idea is to sample the most important trajectories between the two states. A known bias is computed during dynamics, which depends on the current state of the system. DIMS uses a biasing scheme in which the progress variable (current implementation uses RMSD between the current state and the target state) indicates if the system is moving towards the target state. One challenge in computing conformational transitions for big systems is identifying and computing a reaction coordinate. The advantage of DIMS is that the reaction coordinate need not be known prior to the computation of transitions. DIMS uses different flavors of biasing methods and progress variables. A progress variable is system dependent and indicates if the system is moving towards the target or not. In this current study we use RMSD as a progress variable along with soft ratcheting biasing method 47. Diversity between the transitions is achieved by using a random number seed during dynamics. For the soft ratcheting scheme we use a ΔΦ0 value of 10-6 Å. All transitions were computed between the respective starting and end states for the wild type and the mutants. The distance to the target from the starting structure was around 11 Å in each mutant. A cutoff distance of 1.5 Å to the target structure was used. Atoms selected for DIMS included the entire protein except the insert region. This choice ensured that the inserts didn't contribute to the distance to the end-state. Approximately 50 transitions were computed for each mutant.
Estimation of Free Energy changes during the transition
From the experimental study, we know that the addition of inserts affect the rate of E1P -> E2P transition dramatically. Hence, studying the free energy change is a step towards understanding the underlying mechanisms behind the change. The free energy change associated with the conformational change, ideally would involve computation of each and every interaction that takes place during the transition. This computationally may take several years or even decades. In order to get an approximate picture of how the free energy profile of the transitions might look like, we have taken into account all the factors we think are important into consideration. These can be split into enthalpic contributions and entropic contributions. It should be noted that with sufficient sampling, DIMS also could have provided a picture of the kinetics, free energies and pathways, but with our relatively limited sampling, we feel that the approximate free energy curves determined by the enthalpic and entropic contributions gives more insight than analysis of the transition times determined by DIMS.
Enthalpic Estimation
During the transition from the E1P state to the E2P state, many events occur. The A-Domain rotates about 90°. This motion of the A-Domain enables the interaction between the A3 helix and P-Domain helices 48. The waters that come into play during these interactions are important because with the addition of inserts, more and more residues are being added in the A-M3 linker region, this changes the behavior of water and hence the interactions of the A-Domain and the P-domain. The factors used to estimate the enthalpic contributions are representative of the overall interactions and include key interactions that take place during the transition. Equation (4) gives the components that are involved in the computation of the enthalpic term.
| (4) |
Here, the self energy terms of the A3 helix and the M3 linker region are self energies without taking into account interactions from neighboring entities and X is the scaling factor for the number of water contacts computed for the M3-linker region and the A3 helix regions throughout the transition. The concept that we use is to associate an energy value that would better represent a water interaction. This is to compensate for the fact that in coarse grained models, water is represented as a polar bead with no charge 41. Therefore, there is no way of accurately accounting for a hydrogen bond. While the interaction energies of water with M3-linker and water with A3 helix are taken into account, the additional scaling of the water contacts in these regions would better represent these interactions. We have used X=8kT which is approximately the energy value of a hydrogen bond.
Entropic Estimation
The entropic term takes into account the degree of freedom associated with the system. The A-Domain rotation during the transition between E1P and E2P states is thought to be important in the opening of the channel. This is because in the E1P state, the A-M3 linker is completely stretched out. This strain causes the A-Domain to rotate and interact with the P-Domain helices and subsequent rearrangement of the transmembrane helices makes the Ca2+ binding site open to the membrane. As the number of inserts in the A-M3 linker region gets larger, there would be a considerable impact on the flexibility of the linker region and on the A-Domain. Here again, the effect of water contacts is taken into consideration. A scaling factor “Y” is used to account for the amount of time a water bead spends near the A3 helix or the M3-linker. The factors that are used in the estimation of Entropy is give by equation (5)
| (5) |
Here, the value of Y = 0.1 KT for 1 pico second was used. This means an interaction with a water bead lasting 5 picoseconds would amount to 0.5 KT in energy. To compute vibrational entropies of the M3-linker and A3 helix, quasi harmonic analysis was used (Equation 6) 49. The normal mode frequencies are computed using the vibrational analysis section in CHARMM.
| (6) |
where, N is the number of atoms, h is Planck constant and vi is the frequency of the ith internal normal mode.
Stable state simulations
Apart from generating transitions from the E1P state to the E2P state using DIMS, we have equilibrium simulation runs for each starting and ending state. All the above-mentioned computations were also done for the end states and incorporated into our free energy calculations. All calculations were performed with the CHARMM program version c35a2 (compiled for coarse grained simulations), with the CHARMM force field. Each SERCA structure is equilibrated for 1ns and equilibrium MD simulation is carried out for 2 ns using standard Langevin dynamics using a time step of 2.5 fs and a bath temperature of 300K.
Methods Assumptions
We make several simplifying assumptions to enable the calculations. These need to be clearly seen to enable a realization of the strengths and the weaknesses of the computations. First, we are using the population shift analysis framework that enables us to focus our computations at the large-domain shifts in the protein. However, making this assumption does mean that we are not able to comment on the role of the binding partners and most especially the calcium/ATP changes that occur in the physiological system. Second, our calculations within the MARTINI framework do not include electrostatics. While that is consistent with the MARTINI force field, it does mean that we have limitations in our analysis of possible salt-bridges and hydrogen bonding partners. These calculations will provide an initial reference point for further calculations within all-atom and DIMS frameworks that we hope will address both the issues that remain consistent throughout the calculations and those that change with the details of the force-field and the co-factors. Thus, the current calculations should be viewed as providing a starting point for molecular analysis of large-scale conformational change in the system and not as an attempt to provide a complete and exhaustive analysis of all the molecular details in the transitions.
Results and Discussion
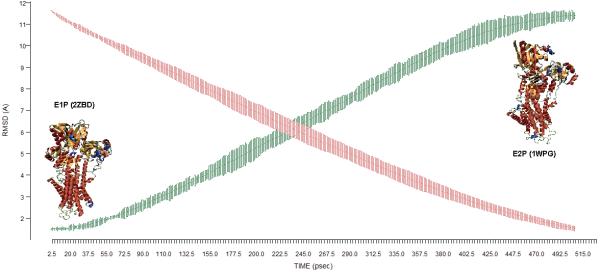
Ensembles of transitions between the E1P and the E2P state (WT and the mutants) are generated using the DIMS algorithm. The E1P state uses the x-ray crystal structure 2ZBD and the E2P state uses the 1WPG structure 15. The protein structures without the bound ligands have been used as is consistent with the population shift model. The total backbone root mean square distance (RMSD) between the E1P and the E2P state is approximately 11Å. Each transition generated by DIMS is independent since DIMS is a stochastic method. For each set of mutant-E1P and mutant-E2P state, an ensemble of about 50 transitions have been generated and analyzed. The overall framework for these calculations and their results can be inferred from Figure 3, where the RMSD changes during the DIMS transitions are shown. Note that the details of the pathway between the states are what is sampled in DIMS -- we use this approach to increase our understanding of the intermediate conformations between the two stable end-state structures.
Figure 3.
RMSD changes along the transition from E1P -> E2P. RMSD difference with respect to target (red). RMSD with respect to starting structure (green)
Domain Interactions
Interactions between A-Domain and N-Domain
The cytoplasmic domains A, P and N of SERCA collectively undergo a large scale conformational change during the transition from the E1P to the E2P state. In the E1P state, Ca2+ is occluded from the membrane and is locked in the binding site. Again, our DIMS calculations use the population shift framework, so the calcium is not directly included in the simulations. The Asp351 in the P-Domain is phosphorylated and the A-Domain is turned further away from the P-Domain, close to the N-Domain. These interactions between the A-Domain and the N-Domain are about -120 kcal/mol in the WT-E1P state and gradually decreases to about -56 kcal/mol as the WT-E2P state is reached (see Figure 4). In the mutant LM17-E1P state, the interaction energy between the A-Domain and the N-Domain is equal to -130 kcal/mol, and in the LM11-E1P state, the interaction energy is about -125 kcal/mol. The values of all other mutants in the E1P state were smaller than the WT-E1P by 5 to 20 kcal/mol. It is noted that as the length of the insert increases, the interaction energy decreases.
Figure 4.
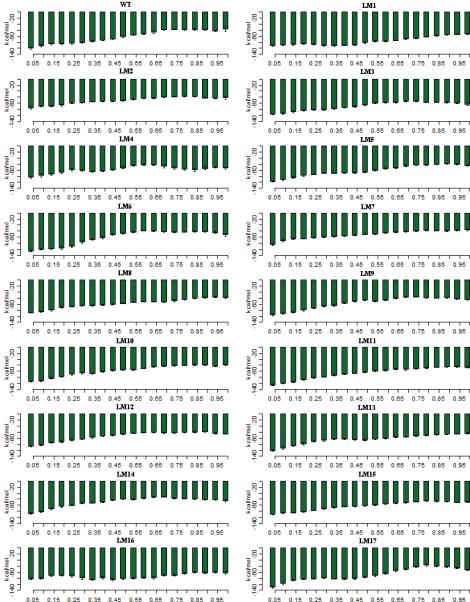
The interaction energy between the A-Domain and the N-Domain during the E1P -> E2P transition. The x-axis shows the progress of the transition from the starting state (2ZBD) to the ending state (1WPG). The transitions are divided into 5% percent completion bins and the values are averaged over 50 transitions for each mutant. Error bars are standard deviations of the data within each bin.
Several mechanisms underlie these differences. First, the addition of the inserts can make the A-Domain more flexible. For example, it has been noted that in the E1P state, the M3-linker is stretched. As the insert length it becomes more flexible and this enables the A-Domain to fall back towards the P-Domain. Another mechanism behind these differences is that, as the residues in the M3-linker region insert increase, it opens the region to more water interactions that compensate for the interactions between the A-Domain and the N-Domain. We examined the distances between the A-Domain and the N-Domain and found no significant difference between the mutants-E1P and the WTE1P state. This shows that the water interactions contribute to the differences in the domain interactions.
As the transition proceeds to the E2P state, the A-Domain rotates about 90° and comes in close proximity to the P-Domain. The N-Domain also moves in order to accommodate the rotation of the A-Domain. Here again, the interactions between the A-Domain and the N-Domain is found to be the lowest in the WT state (about -56 kcal/mol). The difference in interaction energies between the mutants-E2P and the WT-E2P states ranges from 5 to 30 kcal/mol. The highest interaction between the A-Domain and the N-Domain is seen in mutant 5G-E2P (-83 kcal/mol) and mutant LM16-E2P (-82 kcal/mol). The strength of the interaction increases as the length of the inserts increases up to 9 residues and then decreases as the number increases. A molecular understanding of these differences involves at least two mechanisms. The first involves the consideration that when the insert length is relatively small, it contributes to the flexibility of the A-Domain. Once the insert length increases beyond 9 residues, it tends to have a more globular shape which might actually restrict the movement of the A-Domain and hence decreases the interaction energy between the domains. Here again, we computed the distances between the A-Domain and the N-Domain in the E2P states and found no significant difference between the WT and the mutants. An additional contribution is found by noting that, when the insert length is smaller, the number of waters associated with the insertion region is smaller than the number of waters associated with the larger inserts. The deletion mutants also have higher interaction energies in the E2P state and so do the mutants which have inserts in the 233/234 site. Here again, the number of waters associated with this region is not large enough to compensate for any flexibility that may be introduced because of the insert.
Interactions between A-Domain and P-Domain
The A-Domain has the TGE183S motif which is highly conserved 19-21. When the A-Domain rotates about 90°, the glutamic acid in this motif catalyses the dephophsorylation in the E2P state. The interaction between A-Domain and the P-Domain is about -29 kcal/mol in the WT-E1P state (Figure 5). As the number of residues in the inserts increases, the interaction energy increases slightly up to -39 kcal/mol in the LM8 mutant, and then decreases back to a value comparable to that of the WT-E1P in longer insert mutants. On a molecular level this is seen as the inserts adding flexibility to the A-Domain. But as the inserts increase in number they eventually take up a globular shape that then acts to restrict movement of the A-Domain. As the A-Domain rotates 90° and comes closer to the P-Domain in the E2P state, the interaction energy goes up to -86 kcal/mol in the WT-E2P state. Here once again, the interactions become stronger as the inserts are added going up to -109 kcal/mol in the 5G-E2P state and -100 kcal/mol in the LM4-E2P state. The interaction is higher than that of the WT-E2P but lower that LM3-E2P state in mutants up to LM7-E2P and then decreases as the number of inserts increases. The lowest is in LM10-E2P state (41 residue insert) where the interaction energy is -77 kcal/mol. The deletion mutants and the mutants with inserts in 233/234 site have higher interactions energies values than the WT-E2P state. The reason for such discrepancies in the strength of the interaction energies between the A-Domain and the P-Domain can be seen by considering the interaction with waters. As the number of residues in the M3-linker region increases, from up to 5 to residues, the linker region contributes to the flexibility of the A-Domain enables it to come closer to the P-Domain. Once the linker takes on a globular structure, not only does it make the linker less flexible than the other mutants, there are also a large number of waters that are associated with it. There is a sudden increase in water numbers in this region which reduces the ability of the A-Domain to interact with the P-Domain. As the P-Domain moves to interact with the A-Domain, the interaction between P-Domain and the N-Domain also decreases (see supplemental Figure S4).
Figure 5.
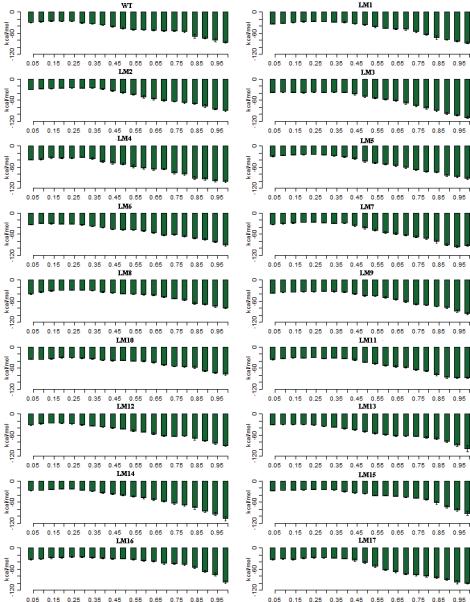
The interaction energy between the A-Domain and the P-domain during the E1P -> E2P transition. The x-axis shows the progress of the transition from the starting state (2ZBD) to the ending state (1WPG). The transitions are divided into 5% percent completion bins and the values are averaged over 50 transitions for each mutant. Error bars show the standard deviations within each bin.
To summarize, in the E1P state, the interaction between the A-Domain and the N-Domain decreases as the number of residues inserted increases, with the exception of LM6-E1P, LM11-E1P and LM17-E1P. The interaction between A-Domain and P-Domain is lowest in the WT-E1P state. The interaction energy gradually increases as inserts are added. In the E2P state, the interaction between A-Domain and N-Domain is the lowest in the WT-E2P. The interaction energies increase with the addition of inserts. The same behavior is seen between A-Domain and the P-Domain.
A3 Helix Interaction with P-Domain
An important question during the E1P-> E2P transition is, what are the underlying factors that cause the A-Domain to rotate? This was partly addressed experimentally by the Andersen group 22 in the mutagenesis study of the A-M3 linker region. X-ray structures of the E1P state shows that the M3 linker region is completely stretched out as the A-Domain is closer to the N-Domain 15. This stretch in the M3-linker is thought to destabilize the E1P state and cause the A-Domain to rotate. In the E2P state, the M3-linker region which was stretched out in the E1P state is seen to be relaxed in the X-ray structures, forming the A3 helix. The addition of the inserts in the M3-linker caused the rate of transition of E1P-> E2P reduced dramatically. It was also observed that when residues where inserted in the 233/234 site, it affected the formation of E2P state to a greater extent. This was thought to be due to the disruption of the A3 helix which is found in the E2 state at the N-terminal part of the A-M3 linker region. The 233/234 site lies exactly where the A3 helix forms. The experimental work speculated that stabilizing interactions between the A3 helix and the P-Domain helices P5, P6 and P7 was necessary in the E2P state.
In the transitions computed by DIMS from E1P to E2P, we have computed interactions between the A3 helix and the P-Domain helices (Figure 6). In the WT, this interaction is non existent in the E1P state due to the distance between the A-Domain and the P-Domain. As the transition progresses, the interaction increases and at E2P it has the value of -11 kcal/mol. As the length of inserts increases, the strength of the interaction energy gradually increases in the E1P state, from -2 kcal/mol in LM5-E1P mutant to -12 kcal/mol in the LM10-E1P mutant (41 residues). This could be due to the changes in the influx of waters. The LM10-E1P mutant has 12 times more waters in the region between the A3 helix and the P-Domain helices (8A distance between both) than the WT-E1P state (see supplemental Figure S5). The insert region accumulates more water due to attractive interactions between the glycine inserts and the water. As observed before, the interaction energy between the A3 helix and the P-Domain helices in the E1P state decreases in the deletion mutants and the mutants in the 233/234 site. When we compare these values to the interaction energies between the A-Domain and the P-Domain in the E1P state, we find that in the mutants with long inserts, there is a larger contribution from the A3 helix interactions. This could be contributing to the stabilization of the E1P state. In the deletion mutants and the mutants of the 233/234 site, the interaction is less than the WT both in the E1P state and the E2P state. We observe that as the inserts are added to the A-M3 linker region, the formation of the A3 helix becomes possible in the E1P state itself (see supplemental Figure S6). In the WT, the A3 helix forms in the 2nd quarter of the transition. Whereas, in most mutants with long inserts, the A3 helix is formed in the beginning or very early in the transition except the LM4 mutant. This shows that the strain in the M3-linker is reduced by adding the inserts. In the mutants of site 233/234, A3 helix is not formed at all because the mutation at the site disrupts the formation of the helix.
Figure 6.
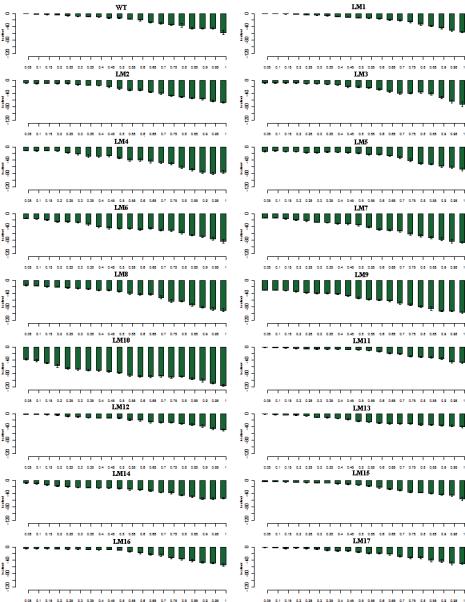
The interaction energy between the A3 helix and the P-domain helices P5,P6,P7 and P8 during the E1P -> E2P transition. The x-axis shows the progress of the transition from the starting state (2ZBD) to the ending state (1WPG). The transitions are divided into 5% percent completion bins and the values are averaged over 50 transitions for each mutant. Error bars represent the standard deviation within each bin.
Interactions with water
Water is the source of both enthalpic interactions and entropic changes. The glycine and proline inserts in the A-M3 linker region have an overall attractive interaction with the surrounding waters (see supplemental Figure S7). As the number of inserts increases, the interaction energy becomes more and more attractive. In the LM10 mutant, the interaction energy starts out much higher than the WT and is seen to gradually reduce as the transition progresses from E1P -> E2P state. This could be due to the expelling of water between the A-Domain and the P-domain as they come closer in the E2P state, leaving less space for the waters compared to the E1P state. In spite of this, the interaction of the M3 linker with water in the E2P state in the LM10 mutant is much higher than the E2P state in the WT. This indicates that there are more waters present in the region formed between the A-Domain and the P-Domain. The deletion mutations and inserts in the 233/234 site shows no significant changes in water interaction when compared with the WT. The double deletion mutation however shows lower interaction energy than the WT throughout the transition. From this we can see that the shortening of the M3-linker produces less favorable interaction with waters than the WT. This is because the number of waters interacting in that region is reduced due to the shortened length. We also find that the number of waters between the A3 helix and the P-Domain increases with the addition of inserts in the E1P state (Figure S5). In the E1P state, the number of waters within 8A distance of both A3 helix and the P-Domain helices (P5, P6 and P7) is around 1 in the WT and around 12 in the LM10 mutant. The number of waters progressively increases with the addition of inserts in the 243/244 site as well as mutants of the 233/234 site. The deletion mutants have numbers comparable to the WT. The changes produced by the insert are mainly due to both length and type of amino acid. In this case the inserts are glycine (represented as a polar bead) and proline residues. These both cause favorable interactions with a population of waters to stabilize the E1P state.
Domain-Domain Interactions versus Domain-Water Interactions
We have so far discussed how the cytoplasmic domains interact with one another and the interaction between the A3 helix and P-Domain helices. From our computations, we have seen that there are changes in the influx of waters in the region between the A-Domain and the P-Domain. What do these extra waters mean to the system? And how do these water interactions affect global interactions? To answer these questions, we have computed the overall contributions from Domain-Waters and Domain-Domain interactions (Figure 7). The Domain-Domain interaction represents the total energy contribution due to the interactions of the cytoplasmic domains. The Domain-Water interactions represent the energy contribution due to water interactions. The number of water contacts for the M3-linker and the A3 helix has been considered for this calculation. The interaction energies between A3 helix and P-Domain helices in the presence of waters are included in the overall water contributions. It can be seen that in the WT-E1P state, the energy contribution due to waters is lesser than the energy contribution due to the Domain-Domain interactions. The Domain-Domain interactions dominate at this state. The Domain-Water contribution increases as the Domain-Domain contribution decreases during the transition from E1P to E2P in the WT. The increase in the contribution due to waters is because for our A3 helix-P-Domain calculations. We compute the interaction energy with waters and we use a cutoff distance of 8A. In the E1P state, A3 helix and P-domain helices are far apart. The number of waters overlapping with the two regions and hence contributing to the interaction is less. In the E2P state however, the A3 helix and the P-domain helices are closer and encompass many waters in that region. Hence the contribution of waters is stronger.
Figure 7.
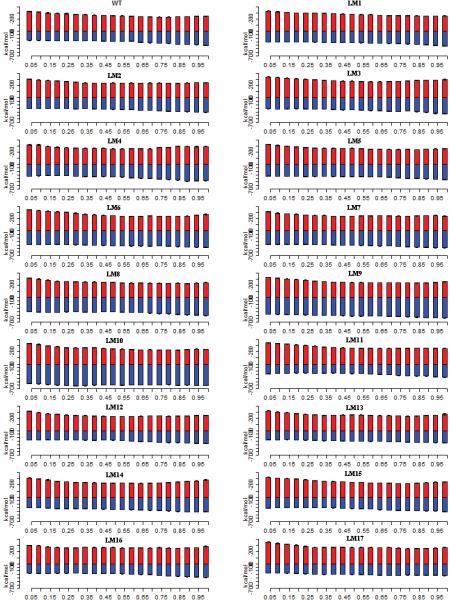
Domain-Domain Interactions (red) and Domain-Water interactions (blue). The x-axis represents the transition from E1P (left) -> E2P (right)
In the mutants with long inserts, the Domain-Water contribution in the E1P state is higher than in the E1P-WT state. As the inserts are added, it can be seen that the Domain-Water contribution dominates more and more. In the LM10-E1P state, the Domain-water contributions are greater than the Domain-Domain contributions. There are a couple of reasons for this. One of which is the favorable interaction of the insert region due to the nature of residues in these inserts. As the inserts are made up of glycine and proline residues, waters interact favorable with the insert region. The insert region attracts waters into the region due to such favorable interactions. Another reason is the issue of packing. When the inserts are small in number, they have a more loop like structure. As the insert length grows, it acquires a more globular shape. This affects the way waters are packed in this region. The lengthy inserts like LM10 with 41 residues pushes waters up into the region between A-Domain and P-Domain. This increase in the influx of waters is seen (Figure S5 and S7). The combination of the above two reasons creates Domain-Water interaction that is greater than the Domain-Domain interactions. This compensation leads to a more stable E1P state.
Free energy changes during the E1P->E2P transition
The most important question that we ask is how inserting residues in the A-M3 linker region causes the rate of the E1P -> E2P transition to be affected dramatically. What are the forces at the molecular level that cause this change in rate? We have so far discussed the interaction energies of domains, the changes in water interactions and the interactions between A3 helix and the P-Domain helices. How do all these changes affect the overall mechanism of the E1P -> E2P transition? To answer this question, we look at the overall free energy changes during the transition. We have taken into account the main interactions that contribute to the enthalpic and entropic components. These values are computed for about 50 transitions for each mutant and the net free energy is fitted to a curve. The free energy of the transition (Figure 8) shows a classic curve with a transition state at about 50% completion in the WT. It can be seen that the free energies of the E1P state is reduced with the addition of inserts in the 243/244 site and the 233/234 site (Table S2). The effect is greatest in the LM10 (41 residue) mutant. The deletion mutants have a value comparable to the WT. This shows that the E1P states of the mutants with long inserts are more stable than their WT counterpart. In the mutants with long inserts the E2P state is at a relatively higher level than the corresponding E1P state. The difference in free energy is more pronounced due to the decrease in free energy of the E1P state. Apart from the stabilization of the E1P state, we found that the estimated rate of the transition calculated by using the barrier height was in good correlation with the experimentally observed rates (Figure 9). This further emphasizes the fact that stabilization of the E1P state increases the barrier height and this makes the progress of the transition increasingly difficult. This is in accordance with the experimental results. The addition of the inserts has changed the way the domains interact with one another and how the A3 helix and M3-linker itself interacts. The addition of long inserts comprising of glycine and proline, brings in more water into the region. The waters have stabilizing interactions with the A3 helix and the P-domain helices making the E1P state of the mutants more stable that the WT-E1P state.
Figure 8.
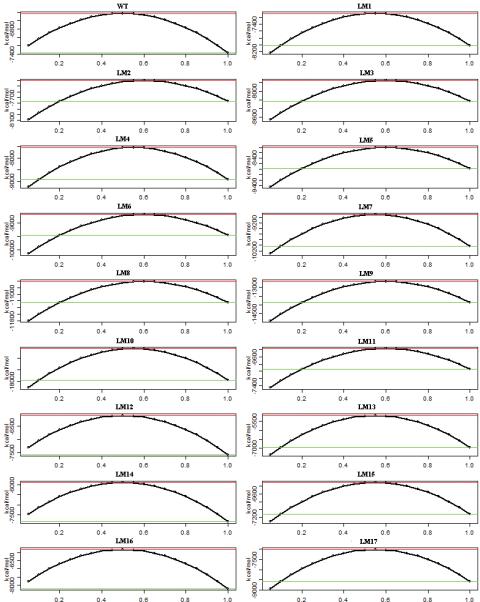
Free energy changes during the E1P -> E2P transition. The transition progress is represented from 0 (2ZBD) to 1(1WPG). The green and red line indicates the free energy of the end state and the transition state respectively.
Figure 9.
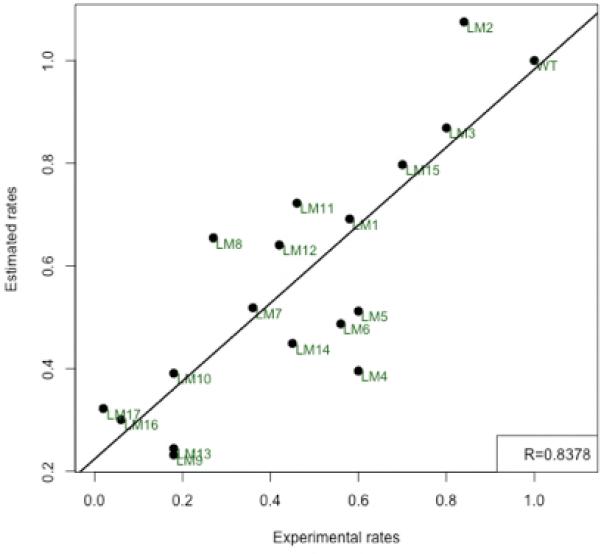
Scatter plot of the Experimental rate and the Estimated Rate from the free energy change. All rates are relative to the WT which is 1.
It is clear from our results that the contributions due to water interactions play the major role in stabilizing the E1P state. With our current coarse-grained model, we were able to observe and address the trends seen in a large system such as SERCA due to mutations done experimentally. Although all-atom simulations would give us a much detailed picture, the insights into the system gained outweighs the assumptions we have made.
How do Domain motions trigger rearrangements in the transmembrane region?
SERCA has two calcium binding sites in the transmembrane region 50. The binding sites are located in the space M4, M5 M6 and M8 helices. In fact site II is located on the M4 helix 7. During the E1P -> E2P transition, the two Ca2+ ions are released into the lumen. The drastic rotation of the A-Domain causes rearrangements in the transmembrane helices and causes the bound Ca2+ ions to be released. In order to understand the communication between domains and how it gets translated to the transmembrane region, we computed the correlation matrix for the transmembrane helices M4 and M5, displayed as a two dimensional correlation map (Figure 10) 51-53. A comparison of the movements of the backbone beads of the M4 and M5 helices in the WT to the movements in the LM10 mutant is shown in 10(a). The correlation map for M4 alone is shown in 10(b) and M5 alone is shown in 10(c). The M4 helix (residues 287-330) has two parts : M4L – lumenal and M4C – cytoplasmic. The M4 helix is connected to the P-Domain and during the A-Domain rotation, the lower sections of the M1 and M2 helix push against the M4L helix, opening the gate. The M5 helix (residues 741-780) bends during this process. The M5 helix is very long and stretches outside the membrane close to the P-Domain. In the WT, the M4 region is seen to be split into 2 parts as mentioned above, separated by a strip of uncorrelated region. This region corresponds to Glu309 which is the gating residue for Ca2+ 17. Although this region is uncorrelated, the two regions of the M4 helix seem to be well correlated and moving together in the WT. This region of uncorrelated motion is much bigger and extends beyond the Glu309 residue into the M4C region in the LM10 mutant 10(b). The reason for this could be that the P-Domain interaction with large number of waters associated with the A-M3 linker inserts might be causing fluctuations in motion in the M4 helix. This might disturb the binding site and even slow down the process of Ca2+ release.
Figure 10.
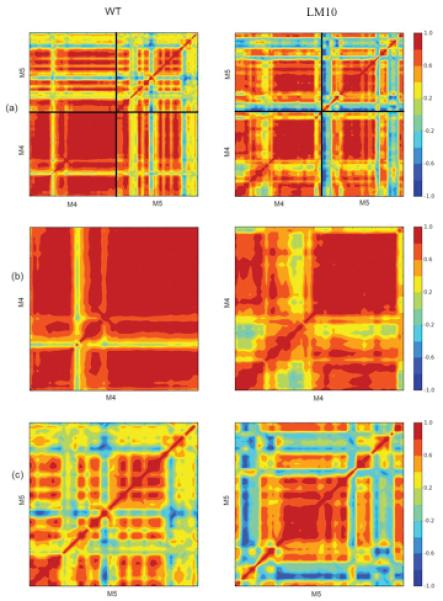
Two dimensional correlation maps for WT and LM10-mutant. (a) Shows overall correlation for M4 and M5 helices. (b) Shows correlation maps for M4 helix. (c)Shows correlation maps for M5 helix. Color codes corresponding to the strength of the correlation is shown on the right.
In the WT, The M5 helix is seen to have many regions of correlated and uncorrelated region. The M5 helix is know to serve as the backbone, extending from the membrane into the P-Domain. From the x-ray structures, it is seen to bend towards the M1 helix during the gating process, further creating space for the ions to be released. This is seen as a region of poorly correlated motion when compared with the motion of the M4 helix in the WT (Figure 10a). In the LM10 mutant however, there is a shift in the motion of the M5 helix. The region that was poorly correlated in the WT is now highly correlated (Figure 10c). The difference in motion seen in M4 and M5 is due to the fluctuations experienced by the P-Domain and its interaction with waters associated with the A-M3 inserts. This change in motion could be affecting the gating mechanism in the transmembrane region and hence the release of the Ca2+ ions into the lumen.
Comparison of energy estimates with All-atom simulations
Coarse-grained simulations has its advantages and can enable greater sampling within a reasonable amount of computational resources, while all-atom simulations can take a much longer time but yield more details in the simulation. In order to assess the quality of our coarse-grained simulations and its ability to capture major trends in conformational changes, we compare the domain-domain interaction energies between coarse-grained and the all-atom models. We consider the end state MD simulations of the WT and compare the domain-domain interactions in the coarse-grained and the all-atom models (Figure 11(a-f)). The membrane for the all-atom simulations was represented by the implicit solvent using the GBSW model 54-57. For the scatter plot, the domain-domain interaction energies of similar structures based on RMSD clustering were compared and plotted. In both E1P-WT and E2P-WT, it can be seen that we get good correlation between the all-atom energies and the coarse-grained energies, although the energy values are very different in the two models. Also, we get very good correlation between the domain-domain interaction energies of coarse-grained and all-atom models in our DIMS transitions as well (Figure 12(a-c)). Here again we compare the energies of similar structures along the DIMS transitions, based on RMSD clustering. These results are promising and show that although coarse-grained simulations cannot be used to comment on the absolute energy values, they do give us insight into the nature of the underlying molecular interactions.
Figure 11.
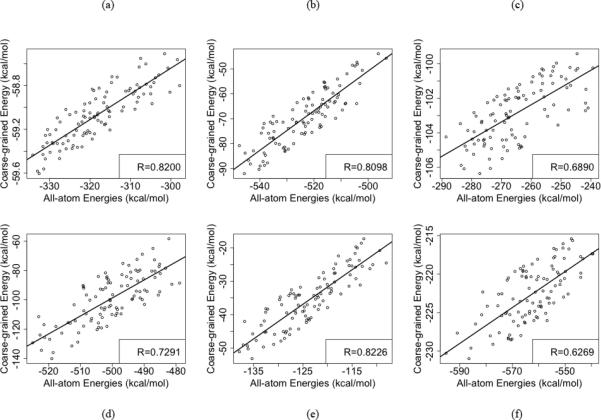
Scatter plots of coarse-grained and all-atom Domain-Domain interaction energies clustered based on RMSD in the (a) A-N Interaction in E2P (1WPG) state, (b) A-P Interaction in E2P , (c) P-N Interaction in E2P , (d) A-N Interaction in E1P (2ZBD) state, (e) A-P Interaction in E1P, (f) P-N Interaction in E1P state.
Figure 12.

Scatter plots of coarse-grained and all-atom interaction energies in the DIMS transition of WT E1P -> E2P states clustered based on RMSD. (a) A-N domain interactions (b) A-P domain interactions (c) P-N domain interactions.
Conclusion
Exploring the conformational changes within proteins is crucial for understanding function. The X-ray structures of proteins provide snapshots of the various states the proteins are capable of reaching. But to understand the function of a protein, information regarding the dynamics of the motion is essential. In the case of SERCA, a lot of information is available in the form of x-ray structures. But that alone is not enough. For our study, transitions between the E1P state and E2P state were computed using DIMS within the population shift framework. Ensembles of transitions generated WT and the mutants experimentally characterized22 provided molecular insights into the changes. It was previously suggested that strain in the A-M3 linker is a driving force in the transition from E1P to E2P. From our analysis it can furthermore be concluded that the inserts in the A-M3 region shifts the A3 helix and the P-domain helix interactions and that this stabilizes the E1P state. More importantly, the interaction with the waters associated with the M3-linker region has a stabilizing effect on the E1P state. The estimated changes in the rate computed from our free energy profiles are in good correlation with the experimentally observed changes. We also find that changes in the cytoplasmic side can reflect in the transmembrane region. The interactions of the P-Domain with waters can affect the motion of the transmembrane helices and thereby disturbing the gating mechanism. The focus of our study was to address the trend in the changes observed between the various mutants. Since this study used coarse-grained models, the energy values computed from our analysis provided a guide for comparison. Comparison with all-atom simulations for the WT energy values showed good correlation. Future all-atom studies will address more precise details of the compensation mechanisms as the inserts are added to the system.
Supplementary Material
Acknowledgements
This research was supported in part by the National Science Foundation through TeraGrid resources provided by The Texas Advanced Computing Center (TACC)
Footnotes
Institution at which the work was performed: Johns Hopkins University, School of Medicine
Contributor Information
Anu Nagarajan, Johns Hopkins University, School of Medicine Department of Physiology Biophysics 206 725 N. Wolfe St. Baltimore, MD 21205 USA anu.nagaraj@gmail.com Phone number: 001-410-762-1029.
Jens Peter Andersen, Aarhus University, Department of Biomedicine Ole Worms Alle 6 Building 1180 8000, Aarhus C Denmark jpa@fi.au.dk.
Thomas B. Woolf, Johns Hopkins University, School of Medicine Department of Physiology Biophysics 206 725 N. Wolfe St. Baltimore, MD 21205 USA tbw.jhmi@gmail.com
References
- 1.Toyoshima C, Nakasako M, Nomura H, Ogawa H. Crystal structure of the calcium pump of sarcoplasmic reticulum at 2.6 A resolution. Nature. 2000;405(6787):647–655. doi: 10.1038/35015017. [DOI] [PubMed] [Google Scholar]
- 2.Toyoshima C, Nomura H. Structural changes in the calcium pump accompanying the dissociation of calcium. Nature. 2002;418(6898):605–611. doi: 10.1038/nature00944. [DOI] [PubMed] [Google Scholar]
- 3.Toyoshima C, Mizutani T. Crystal structure of the calcium pump with a bound ATP analogue. Nature. 2004;430(6999):529–535. doi: 10.1038/nature02680. [DOI] [PubMed] [Google Scholar]
- 4.Sorensen TL, Moller JV, Nissen P. Phosphoryl transfer and calcium ion occlusion in the calcium pump. Science. 2004;304(5677):1672–1675. doi: 10.1126/science.1099366. [DOI] [PubMed] [Google Scholar]
- 5.Olesen C, Sorensen TL, Nielsen RC, Moller JV, Nissen P. Dephosphorylation of the calcium pump coupled to counterion occlusion. Science. 2004;306(5705):2251–2255. doi: 10.1126/science.1106289. [DOI] [PubMed] [Google Scholar]
- 6.Sagara Y, Inesi G. Inhibition of the sarcoplasmic-reticulum Ca2+ transport atpase by thapsigargin at subnanomolar concentrations. J Biol Chem. 1991;266(21):13503–13506. [PubMed] [Google Scholar]
- 7.Toyoshima C, Inesi G. Structural basis of ion pumping by Ca2+-ATPase of the sarcoplasmic reticulum. Annu Rev Biochem. 2004;73:269–292. doi: 10.1146/annurev.biochem.73.011303.073700. [DOI] [PubMed] [Google Scholar]
- 8.Hasselbach W, Makinose M. Uber den mechanismus des calciumtransportes durch die membranen des sarkoplasmatischen reticulums. Biochem Z. 1963;339(2):94. [PubMed] [Google Scholar]
- 9.de Meis L, Vianna AL. Energy interconversion by the Ca2+-dependent ATPase of the sarcoplasmic reticulum. Annu Rev Biochem. 1979;48:275–292. doi: 10.1146/annurev.bi.48.070179.001423. [DOI] [PubMed] [Google Scholar]
- 10.Berridge MJ, Lipp P, Bootman MD. The versatility and universality of calcium signalling. Nature Reviews Molecular Cell Biology. 2000;1(1):11–21. doi: 10.1038/35036035. [DOI] [PubMed] [Google Scholar]
- 11.Berridge MJ, Bootman MD, Roderick HL. Calcium signalling: Dynamics, homeostasis and remodelling. Nature Reviews Molecular Cell Biology. 2003;4(7):517–529. doi: 10.1038/nrm1155. [DOI] [PubMed] [Google Scholar]
- 12.Hovnanian A. SERCA pumps and human diseases. Subcellular Biochemistry. 2007:337–363. doi: 10.1007/978-1-4020-6191-2_12. [DOI] [PubMed] [Google Scholar]
- 13.Inesi G, Prasad AM, Pilankatta R. The Ca2+ ATPase of cardiac sarcoplasmic reticulum: Physiological role and relevance to diseases. Biochem Biophys Res Commun. 2008;369(1):182–187. doi: 10.1016/j.bbrc.2007.11.161. [DOI] [PMC free article] [PubMed] [Google Scholar]
- 14.Dhitavat J, Dode L, Leslie N, Sakuntabhai A, Lorette G, Hovnanian A. Mutations in the sarcoplasmic/endoplasmic reticulum Ca2+ ATPase isoform cause darier's disease. J Invest Dermatol. 2003;121(3):486–489. doi: 10.1046/j.1523-1747.2003.12410.x. [DOI] [PubMed] [Google Scholar]
- 15.Toyoshima C, Nomura H, Tsuda T. Lumenal gating mechanism revealed in calcium pump crystal structures with phosphate analogues. Nature. 2004 Nov 18;432(7015):361–368. doi: 10.1038/nature02981. [DOI] [PubMed] [Google Scholar]
- 16.Takahashi M, Kondou Y, Toyoshima C. Interdomain communication in calcium pump as revealed in the crystal structures with transmembrane inhibitors. Proc Natl Acad Sci U S A. 2007;104(14):5800–5805. doi: 10.1073/pnas.0700979104. [DOI] [PMC free article] [PubMed] [Google Scholar]
- 17.Toyoshima C. Structural aspects of ion pumping by Ca2+-ATPase of sarcoplasmic reticulum. Arch Biochem Biophys. 2008;476(1):3–11. doi: 10.1016/j.abb.2008.04.017. [DOI] [PubMed] [Google Scholar]
- 18.Wuytack F, Raeymaekers L, Missiaen L. Molecular physiology of the SERCA and SPCA pumps. Cell Calcium. 2002;32(5-6):279–305. doi: 10.1016/s0143416002001847. [DOI] [PubMed] [Google Scholar]
- 19.Anthonisen AN, Clausen JD, Andersen JP. Mutational analysis of the conserved TGES loop of sarcoplasmic reticulum Ca2+-ATPase. J Biol Chem. 2006;281(42):31572–31582. doi: 10.1074/jbc.M605194200. [DOI] [PubMed] [Google Scholar]
- 20.Andersen JP. Dissection of the functional domains of the sarcoplasmic reticulum Ca2+-ATPase by site-directed mutagenesis. Bioscience Reports. 1995;15:243–261. doi: 10.1007/BF01788358. [DOI] [PubMed] [Google Scholar]
- 21.Clausen JD, Vilsen B, McIntosh DB, Einholm AP, Andersen JP. Glutamate-183 in the conserved TGES motif of domain A of sarcoplasmic reticulum Ca2+-ATPase assists in catalysis of E-2/E2P partial reactions. Proc Natl Acad Sci U S A. 2004;101(9):2776–2781. doi: 10.1073/pnas.0400122101. [DOI] [PMC free article] [PubMed] [Google Scholar]
- 22.Holdensen AN, Andersen JP. The length of the A-M3 linker is a crucial determinant of the rate of the Ca2+ transport cycle of sarcoplasmic reticulum Ca2+-ATPase. J Biol Chem. 2009;284(18):12258–12265. doi: 10.1074/jbc.M900977200. [DOI] [PMC free article] [PubMed] [Google Scholar]
- 23.Daiho T, Yamasaki K, Danko S, Suzuki H. Critical role of Glu40-Ser48 loop linking actuator domain and first transmembrane helix of Ca2+-ATPase in Ca2+ deocclusion and release from ADP-insensitive phosphoenzyme. J Biol Chem. 2007;282(47):34429–34447. doi: 10.1074/jbc.M707665200. [DOI] [PubMed] [Google Scholar]
- 24.Petsko GA, Ringe D. Fluctuations in protein-structure from X-ray-diffraction. Annu Rev Biophys Bioeng. 1984;13:331–371. doi: 10.1146/annurev.bb.13.060184.001555. [DOI] [PubMed] [Google Scholar]
- 25.Vangunsteren WF, Berendsen HJC. Computer-simulation of molecular-dynamics - methodology, applications, and perspectives in chemistry. Angewandte Chemie-International Edition in English. 1990;29(9):992–1023. [Google Scholar]
- 26.Karplus M, Kuriyan J. Molecular dynamics and protein function. Proc Natl Acad Sci U S A. 2005;102(19):6679–6685. doi: 10.1073/pnas.0408930102. [DOI] [PMC free article] [PubMed] [Google Scholar]
- 27.Schlitter J, Engels M, Kruger P, Jacoby E, Wollmer A. Targeted molecular-dynamics simulation of conformational change - application to the T[--]R transition in insulin. Molecular Simulation. 1993;10(2-6):291. [Google Scholar]
- 28.Mashl RJ, Jakobsson E. End-point targeted molecular dynamics: Large-scale conformational changes in potassium channels. Biophys J. 2008;94(11):4307–4319. doi: 10.1529/biophysj.107.118778. [DOI] [PMC free article] [PubMed] [Google Scholar]
- 29.Lu H, Schulten K. Steered molecular dynamics simulations of force-induced protein unfolding. Proteins-Structure Function and Genetics. 1999;35(4):453–463. [PubMed] [Google Scholar]
- 30.Lu H, Schulten K. Steered molecular dynamics simulation of conformational changes of immunoglobulin I27 interpret atomic force microscopy observations. Chem Phys. 1999;247(1):141–153. [Google Scholar]
- 31.Huber GA, Kim S. Weighted-ensemble brownian dynamics simulations for protein association reactions. Biophys J. 1996;70(1):97–110. doi: 10.1016/S0006-3495(96)79552-8. [DOI] [PMC free article] [PubMed] [Google Scholar]
- 32.Zhang BW, Jasnow D, Zuckerman DM. Efficient and verified simulation of a path ensemble for conformational change in a united-residue model of calmodulin. Proc Natl Acad Sci U S A. 2007;104:18043–18048. doi: 10.1073/pnas.0706349104. [DOI] [PMC free article] [PubMed] [Google Scholar]
- 33.Woolf TB. Path corrected functionals of stochastic trajectories: Towards relative free energy and reaction coordinate calculations. Chemical Physics Letters. 1998;289(5-6):433–441. [Google Scholar]
- 34.Dellago C, Bolhuis PG, Chandler D. Efficient transition path sampling: Application to lennard-jones cluster rearrangements. J Chem Phys. 1998;108(22):9236–9245. [Google Scholar]
- 35.Beckstein O, Denning EJ, Perilla JR, Woolf TB. Zipping and unzipping of adenylate kinase: Atomistic insights into the ensemble of open closed transitions. J Mol Biol. 2009;394(1):160–176. doi: 10.1016/j.jmb.2009.09.009. [DOI] [PMC free article] [PubMed] [Google Scholar]
- 36.Perilla JR, Beckstein O, Denning EJ, Woolf TB. Computing ensembles of transitions from stable states: Dynamic importance sampling. J Comput Chem. 2011;32(2):196–209. doi: 10.1002/jcc.21564. [DOI] [PMC free article] [PubMed] [Google Scholar]
- 37.Bahar I, Chennubhotla C, Tobi D. Intrinsic dynamics of enzymes in the unbound state and, relation to allosteric regulation. Curr Opin Struct Biol. 2007;17(6):633–640. doi: 10.1016/j.sbi.2007.09.011. [DOI] [PMC free article] [PubMed] [Google Scholar]
- 38.Ma HL, Lewis D, Xu C, Inesi G, Toyoshima C. Functional and structural roles of critical amino acids within the “N”, “P”, and “A” domains of the Ca2+ ATPase (SERCA) headpiece. Biochemistry (N Y ) 2005;44(22):8090–8100. doi: 10.1021/bi050332m. [DOI] [PubMed] [Google Scholar]
- 39.Hua SM, Ma HL, Lewis D, Inesi G, Toyoshima C. Functional role of “N” (nucleotide) and “P” (phosphorylation) domain interactions in the sarcoplasmic reticulum (SERCA) ATPase. Biochemistry (N Y ) 2002;41(7):2264–2272. doi: 10.1021/bi015684h. [DOI] [PubMed] [Google Scholar]
- 40.Daiho T, Yamasaki K, Wang G, Danko S, Iizuka H, Suzuki H. Deletions of any single residues in Glu40-Ser48 loop connecting A-Domain and the first transmembrane helix of sarcoplasmic reticulum ca(2+)-ATPase result in almost complete inhibition of conformational transition and hydrolysis of phosphoenzyme intermediate. J Biol Chem. 2003;278(40):39197–39204. doi: 10.1074/jbc.M305200200. [DOI] [PubMed] [Google Scholar]
- 41.Monticelli L, Kandasamy SK, Periole X, Larson RG, Tieleman DP, Marrink SJ. The MARTINI coarse-grained force field: Extension to proteins. Journal of Chemical Theory and Computation. 2008;4(5):819–834. doi: 10.1021/ct700324x. [DOI] [PubMed] [Google Scholar]
- 42.Zuckerman DM, Woolf TB. Dynamic reaction paths and rates through importance-sampled stochastic dynamics. J Chem Phys. 1999;111(21):9475–9484. [Google Scholar]
- 43.Zuckerman DM, Woolf TB. Efficient dynamic importance sampling of rare events in one dimension. Physical Review E. 2001;63(2) doi: 10.1103/PhysRevE.63.016702. [DOI] [PubMed] [Google Scholar]
- 44.Jang H, Woolf TB. Multiple pathways in conformational transitions of the alanine dipeptide: An application of dynamic importance sampling. Journal of Computational Chemistry. 2006;27(11):1136–1141. doi: 10.1002/jcc.20444. [DOI] [PubMed] [Google Scholar]
- 45.Zuckerman DM, Woolf TB. Transition events in butane simulations: Similarities across models. J Chem Phys. 2002;116(6):2586–2591. [Google Scholar]
- 46.Brooks BR, Bruccoleri RE, Olafson BD, States DJ, Swaminathan S, Karplus M. Charmm - a program for macromolecular energy, minimization, and dynamics calculations. Journal of Computational Chemistry. 1983;4(2):187–217. [Google Scholar]
- 47.Zuckerman DM, Woolf TB. Rapid determination of multiple reaction pathways in molecular systems: The soft-ratcheting algorithm. ArXiv:physics/0209098.
- 48.Yamasaki K, Daiho T, Guoli W, Danko S, Suzuki H. Changes in interactions between phosphorylation- and actuator-domains of sarco(endo) lasmic reticulum Ca22+-ATPase during processing of phosphoenzyme intermediate. J Gen Physiol. 2005;126(1):71. [Google Scholar]
- 49.Tidor B, Karplus M. The contribution of vibrational entropy to molecular association - the dimerization of insulin. J Mol Biol. 1994;238(3):405–414. doi: 10.1006/jmbi.1994.1300. [DOI] [PubMed] [Google Scholar]
- 50.Zhang ZS, Lewis D, Strock C, Inesi G. Detailed characterization of the cooperative mechanism of Ca2+ binding and catalytic activation in the Ca2+ transport (SERCA) ATPase. Biochemistry (N Y ) 2000;39(30):8758–8767. doi: 10.1021/bi000185m. [DOI] [PubMed] [Google Scholar]
- 51.Ichiye T, Karplus M. Collective motions in proteins - a covariance analysis of atomic fluctuations in molecular-dynamics and normal mode simulations. Proteins-Structure Function and Genetics. 1991;11(3):205–217. doi: 10.1002/prot.340110305. [DOI] [PubMed] [Google Scholar]
- 52.Rod TH, Radkiewicz JL, Brooks CL. Correlated motion and the effect of distal mutations in dihydrofolate reductase. Proc Natl Acad Sci U S A. 2003;100(12):6980–6985. doi: 10.1073/pnas.1230801100. [DOI] [PMC free article] [PubMed] [Google Scholar]
- 53.Radkiewicz JL, Brooks CL. Protein dynamics in enzymatic catalysis: Exploration of dihydrofolate reductase. J Am Chem Soc. 2000;122(2):225–231. [Google Scholar]
- 54.Feig M, Im W, Brooks CL., III Implicit solvation based on general- ized Born theory in different dielectric environments. J Chem Phys. 2004;120:903–911. doi: 10.1063/1.1631258. [DOI] [PubMed] [Google Scholar]
- 55.Feig M, Onufriev A, Lee MS, Im W, Case DA, Brooks CL., III Per- formance comparison of generalized born and Poisson methods in the calculation of electrostatic solvation energies for protein struc- tures. J Comp Chem. 2004;25:265–284. doi: 10.1002/jcc.10378. [DOI] [PubMed] [Google Scholar]
- 56.Im W, Feig M, Brooks CL., III An implicit membrane generalized Born theory for the study of structure, stability, and interactions of membrane proteins. Biophys J. 2003;85:2900–2918. doi: 10.1016/S0006-3495(03)74712-2. [DOI] [PMC free article] [PubMed] [Google Scholar]
- 57.Im W, Lee MS, Brooks CL., III Generalized Born model with a sim- ple smoothing function. J Comp Chem. 2003;24:1691–702. doi: 10.1002/jcc.10321. [DOI] [PubMed] [Google Scholar]
Associated Data
This section collects any data citations, data availability statements, or supplementary materials included in this article.


