
Figure 10.
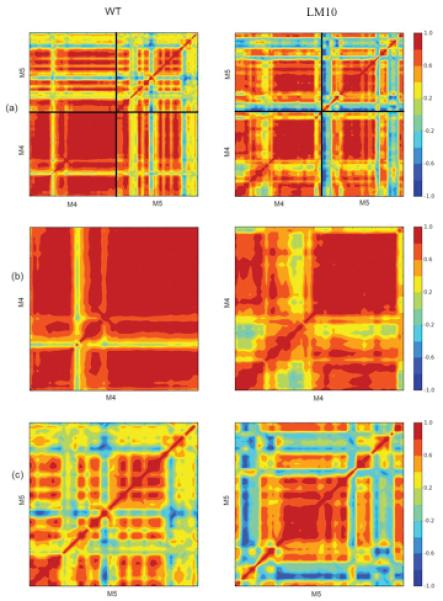
Two dimensional correlation maps for WT and LM10-mutant. (a) Shows overall correlation for M4 and M5 helices. (b) Shows correlation maps for M4 helix. (c)Shows correlation maps for M5 helix. Color codes corresponding to the strength of the correlation is shown on the right.