
Figure 5.
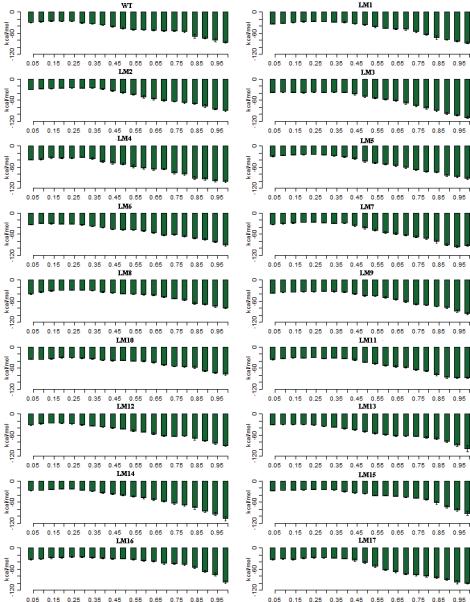
The interaction energy between the A-Domain and the P-domain during the E1P -> E2P transition. The x-axis shows the progress of the transition from the starting state (2ZBD) to the ending state (1WPG). The transitions are divided into 5% percent completion bins and the values are averaged over 50 transitions for each mutant. Error bars show the standard deviations within each bin.