Figure 8.

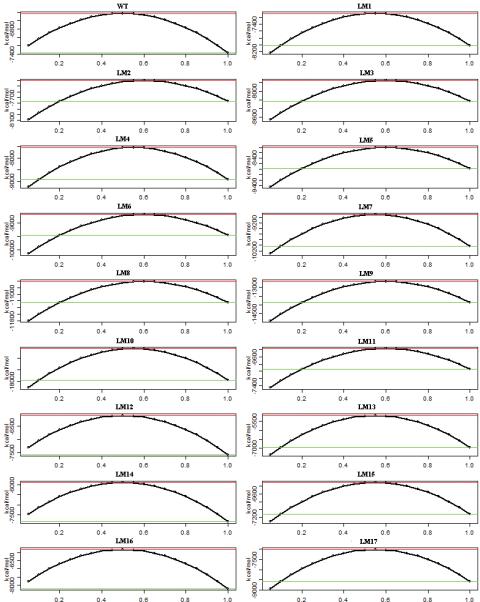
Free energy changes during the E1P -> E2P transition. The transition progress is represented from 0 (2ZBD) to 1(1WPG). The green and red line indicates the free energy of the end state and the transition state respectively.

Free energy changes during the E1P -> E2P transition. The transition progress is represented from 0 (2ZBD) to 1(1WPG). The green and red line indicates the free energy of the end state and the transition state respectively.