

Abstract
NADH is a naturally fluorescent metabolite associated with cellular respiration. Exploiting the different fluorescence lifetime of free and bound NADH has the potential to quantify the relative amount of bound and free NADH, enhancing understanding of cellular processes including apoptosis, cancer pathology, and enzyme kinetics. We use the phasor- fluorescence lifetime image microscopy approach to spatially map NADH in both the free and bound forms of live undifferentiated and differentiated myoblast cells. The phasor approach graphically depicts the change in lifetime at a pixel level without the requirement for fitting the decay. Comparison of the spatial distribution of NADH in the nucleus of cells induced to differentiate through serum starvation and undifferentiated cells show differing distributions of bound and free NADH. Undifferentiated cells displayed a short lifetime indicative of free NADH in the nucleus and a longer lifetime attributed to the presence of bound NADH outside of the nucleus. Differentiating cells displayed redistribution of free NADH with decreased relative concentration of free NADH within the nucleus whereas the majority of NADH was found in the cytoplasm.
Stem cells provide a biological model in which cellular processes and biochemical activities can be observed at the undifferentiated stage (1) or they can be induced to differentiate into specialized cells based on the activation of various signaling pathways. Of particular interest is the nucleus of stem cells where the control of transcription and chromatin structure is known to be different (2–4). Comparison of the cells in these two states provides unique opportunities for understanding regulative processes such as embryonic development, tissue homeostasis, tissue regeneration, and cancer development. Relative concentration of the naturally fluorescent metabolic coenzymes nicotinamide adenine dinucleotide (NADH), nicotinamide adenine dinucleotide phosphate (NAD(P)H), and flavin adenine dinucleotide (FAD), when bound to proteins or free, can be assessed by fluorescence lifetime image microscopy (FLIM) (5). Concentrations of NAD(P)H in the cell are significantly reduced, leading to NADH's fluorescence predominating that of NAD(P)H (6). We found that this relative concentration of free and bound NADH is substantially different in the nucleus of stem cells compared to cells entering early stages of differentiation.
The development of the phasor plot has eased the analysis of FLIM data by enabling straightforward interpretation of lifetime differences at the pixel level (5,7). Here we use the phasor approach to FLIM to observe NADH in both free and bound forms in live undifferentiated myoblast cells and cells induced to undergo the early stages of differentiation through serum starvation.
NADH bound within mitochondria and other substrates in the cell can be directly used as an indicator of cellular respiration (8), as only the reduced form (NADH) emits visible fluorescence (9,10). Spectral differences between free and bound NADH are minor (6), although new sensitive methods of data analysis can reveal these small differences (11). Instead, there is a substantial change in lifetime between the free and bound forms (3.2 vs. 0.4 ns) (12). The fluorescence lifetime is independent of concentration but the relative amount of bound and free NADH in a given pixel can be obtained using the linear property of the phasor representation (5). Exploiting this principle, we determine the relative amount of free and bound NADH by marking in the phasor plot the position of the minimum and maximum phasor value along the line joining the phasor of free and bound NADH (obtained from reference cuvette samples) found in our samples (Fig. 1). We constructed a linear scale of relative concentrations (intensity fraction and molar fraction, which accounts for the different quantum yield of the two species) and compared cells in different states of differentiation (Fig. 1).
Figure 1.
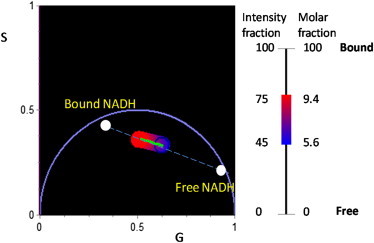
Phasor positions of bound and free NADH obtained from cuvette measurements. (Green line) Maximum and minimum range of relative fraction of bound and free found in the myoblast cells. (Red to blue) Relative amount of bound and free NADH, respectively.
Images of NADH autofluorescence in L6 rat myoblast cells entering the early stages of differentiation and undifferentiated cells show clustering of NADH within the cytoplasm (Fig. 2, A and B). To selectively excite NADH, we use two-photon excitation at 740 nm. The contribution of FAD was estimated to be ∼10% using a cut of filter at 500 nm. Fluorescence intensity, however, does not provide information about the free and bound form of NADH, or the presence of either forms of NADH within the nucleus.
Figure 2.
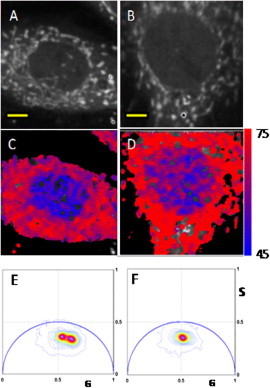
(A and B) Images of undifferentiated and early differentiated L6 rat myoblast, respectively. Scale bar is 5 μm. (C and D) Color-coded FLIM images of A and B, respectively, according to the color scale in Fig. 1. (E and F) Phasor plot histograms of C and D, respectively. The G and S coordinates are the cosine and sine transform respectively, as shown in the Materials and Methods section.
The FLIM images of undifferentiated L6 myoblast cell (Fig. 2, C and D) identify the cellular distribution of the bound and free forms of NADH according to the color-code of Fig. 1. This pictorial representation shows clear difference between the relative amount of bound and free forms of NADH in the cytoplasm and in the nucleus of undifferentiated cells. The phasor histogram (Fig. 2, E and F) shows a bimodal distribution, indicating that the difference between cytoplasm and nucleus can be resolved.
The FLIM analysis shows that the NADH bound/free ratio in cells entering the early stages of differentiation is similar in the cytoplasm and the nucleus, although some differences remain. The main component of the phasor histogram is coincident with the component found in the cytoplasm of the undifferentiated myoblasts. The histogram is slightly asymmetric and there is a minor component of relatively free NADH in the nucleus.
Fig. 2 shows a larger component of relatively free NADH (blue) within the nuclei of the undifferentiated cells. Also within the nuclear regions (Fig. 2, C and D), there is heterogeneity of the distribution of bound and free NADH that may represent the location of chromatin. Throughout the cytoplasm, there is presence of bound NADH component (red), which is indicative of cellular respiration in the mitochondria.
FLIM image z-stacks were acquired for the cells shown in Fig. 2 (data not shown). The bimodal distribution of free and bound NADH was shown to be exclusively associated with the nucleus of undifferentiated cells. Instead, the cytoplasmic component was found to have similar phasor histograms everywhere. A total of N = 87 cells were measured for both undifferentiated and those entering the early stages of differentiation (Fig. 3). The bimodal phasor histogram was found for all undifferentiated cells, whereas the cells entering the early stages of differentiation showed a consistent smaller difference between the nucleus and the cytoplasm.
Figure 3.
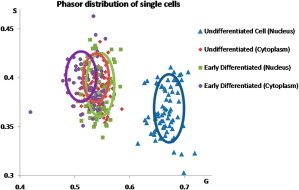
Scatter analysis of 40 undifferentiated myoblast cells and 47 early differentiated cells. The average phasor coordinates are shown for the nuclear and the cytoplasmic region of both types of cells.
Previous studies on NADH and its relationship with metabolic processes have been presented, each posing different questions and using different methods, most of which involved in vitro biochemical analyses. FLIM provides a promising in vivo technique in which the two forms (free and bound NADH) can be distinguished based on their lifetimes, where the autofluorescence properties of the cofactor NADH may be used as a metabolic marker for cells undergoing differentiation (5).
Conventional methods for FLIM analysis require fitting of data to exponentials, making the analysis of data more difficult especially when more than one lifetime is present (5). The phasor approach to FLIM is an in vivo fit-free method that provides an unbiased representation of the raw FLIM data and requires no previous knowledge of the biological system (5). Stringari et al. (5) used this method to monitor stem cell metabolism and to discriminate different states of stem cells as they differentiated within tissues (5).
Through mapping the lifetime distribution of the autofluorescent bound and free NADH, within undifferentiated and early differentiated cells, a metabolic fingerprint of the myoblast cells is produced observing the changes in NADH bound/free distribution in early differentiated cells. The cytoplasmic region displayed longer lifetimes indicative of NADH being bound within the mitochondria and to other substrates. For the nucleus, on the other hand, there were distinctly shorter lifetimes indicating the presence of free NADH, which represents the reduced nuclear activity of the cell. In comparison, in cells induced to the early stages of differentiation through serum starvation, there is a consistent change in the phasor distributions of NADH (Fig. 3). This change within the nucleus is indicative of more bound NADH due to the increase in nuclear activity expected in differentiating cells.
Materials and Methods
Undifferentiated L6 myoblast cells were brought up from cryopreservation two days before measurement in Dulbecco's modified Eagle's medium supplemented with 10% fetal bovine serum and PEN/STREP and maintained at 37°C in a 5% CO2 humidified incubator. The myoblasts were plated one day before measurement on pre-prepared 35-mm culture dishes (MatTek, Ashland, MA) precoated with fibronectin (3 μg) and left overnight to adhere. Serum-starved cells were induced to early stages differentiation 3 h before experimental procedures through starvation of the cells with Dulbecco's modified Eagle's medium lacking fetal bovine serum.
A LSM 710 confocal microscope (Carl Zeiss, Jena, Germany) was used for the acquisition of all FLIM data. The microscope was coupled to a titanium:sapphire Mai Tai laser (Spectra-Physics, Mountain View, CA) and an A320 FastFLIM FLIMbox (ISS, Champaign, IL). For all FLIM acquisitions, a C-Apochromat 40×/1.20 W Korr M27 objective was used. The scan speed was set to 25.21 μs/pixel with an excitation wavelength of 740 nm (9% laser power). Fluorescence was detected in a bandwidth of 416–690 nm. A fluorescein solution (30 nM) in 0.1 M NaOH was used for lifetime calibration.
In the phasor approach to FLIM (6), the sine and cosine transformations of the decay curve at each pixel are used to determine the G and S coordinates of a phasor, as defined by
where i and j represent pixels. The value ω = 2πf, where f is the repetition rate of the laser (80 MHz). The coordinate g represents the x axis while the coordinate s represents the y axis.
Acknowledgments
We thank M. Stakic for culturing the cells and S. Mieruszynski for aiding with the production of the scatter diagram.
Funds to E.G., C.S., and M.A.D. were provided by National Institutes of Health P41-RR03155, P41 GM103540, and P50 GM076516.
References and Footnotes
- 1.White, B. P., F. J. McDonald, and L. Willmott. 2010. Health Law in Australia. Thomson Reuters (Australia), Pyrmont, NSW, Australia.
- 2.Fjeld C.C., Birdsong W.T., Goodman R.H. Differential binding of NAD+ and NADH allows the transcriptional corepressor carboxyl-terminal binding protein to serve as a metabolic sensor. Proc. Natl. Acad. Sci. USA. 2003;100:9202–9207. doi: 10.1073/pnas.1633591100. [DOI] [PMC free article] [PubMed] [Google Scholar]
- 3.Zhang Q., Piston D.W., Goodman R.H. Regulation of corepressor function by nuclear NADH. Science. 2002;295:1895–1897. doi: 10.1126/science.1069300. [DOI] [PubMed] [Google Scholar]
- 4.Ghosh S., George S., Kolthur-Seetharam U. NAD: a master regulator of transcription. Biochim. Biophys. Acta. 2010;1799:681–693. doi: 10.1016/j.bbagrm.2010.08.002. [DOI] [PubMed] [Google Scholar]
- 5.Stringari C., Cinquin A., Gratton E. Phasor approach to fluorescence lifetime microscopy distinguishes different metabolic states of germ cells in a live tissue. Proc. Natl. Acad. Sci. USA. 2011;108:13582–13587. doi: 10.1073/pnas.1108161108. [DOI] [PMC free article] [PubMed] [Google Scholar]
- 6.Huang S., Heikal A.A., Webb W.W. Two-photon fluorescence spectroscopy and microscopy of NAD(P)H and flavoprotein. Biophys. J. 2002;82:2811–2825. doi: 10.1016/S0006-3495(02)75621-X. [DOI] [PMC free article] [PubMed] [Google Scholar]
- 7.Digman M.A., Caiolfa V.R., Gratton E. The phasor approach to fluorescence lifetime imaging analysis. Biophys. J. 2008;94:L14–L16. doi: 10.1529/biophysj.107.120154. [DOI] [PMC free article] [PubMed] [Google Scholar]
- 8.Yu Q., Heikal A.A. Two-photon autofluorescence dynamics imaging reveals sensitivity of intracellular NADH concentration and conformation to cell physiology at the single-cell level. J. Photochem. Photobiol. B. 2009;95:46–57. doi: 10.1016/j.jphotobiol.2008.12.010. [DOI] [PMC free article] [PubMed] [Google Scholar]
- 9.Piston D.W., Masters B.R., Webb W.W. Three-dimensionally resolved NAD(P)H cellular metabolic redox imaging of the in situ cornea with two-photon excitation laser scanning microscopy. J. Microsc. 1995;178:20–27. doi: 10.1111/j.1365-2818.1995.tb03576.x. [DOI] [PubMed] [Google Scholar]
- 10.Chunqiang L., Pitsillides C., Lin C.P. Multiphoton microscopy of live tissues with ultraviolet autofluorescence. IEEE J Sel. Top. Quant. Electron. 2010;16:516–523. [Google Scholar]
- 11.Palero J.A., Bader A.N., Gerritsen H.C. In vivo monitoring of protein-bound and free NADH during ischemia by nonlinear spectral imaging microscopy. Biomed. Opt. Express. 2011;2:1030–1039. doi: 10.1364/BOE.2.001030. [DOI] [PMC free article] [PubMed] [Google Scholar]
- 12.Skala M.C., Riching K.M., Ramanujam N. In vivo multiphoton microscopy of NADH and FAD redox states, fluorescence lifetimes, and cellular morphology in precancerous epithelia. Proc. Natl. Acad. Sci. USA. 2007;104:19494–19499. doi: 10.1073/pnas.0708425104. [DOI] [PMC free article] [PubMed] [Google Scholar]