Abstract
Recent studies identified a highly tumorigenic subpopulation of glioma stem cells (GSCs) within malignant gliomas. GSCs are proposed to originate from transformed neural stem cells (NSCs). Several pathways active in NSCs, including the Notch pathway, were shown to promote proliferation and tumorigenesis in GSCs. Notch2 is highly expressed in glioblastoma multiforme (GBM), a highly malignant astrocytoma. It is therefore conceivable that increased Notch2 signaling in NSCs contributes to the formation of GBM. Here, we demonstrate that mice constitutively expressing the activated intracellular domain of Notch2 in NSCs display a hyperplasia of the neurogenic niche and reduced neuronal lineage entry. Neurospheres derived from these mice show increased proliferation, survival and resistance to apoptosis. Moreover, they preferentially differentiate into astrocytes, which are the characteristic cellular population of astrocytoma. Likewise, we show that Notch2 signaling increases proliferation and resistance to apoptosis in human GBM cell lines. Gene expression profiling of GBM patient tumor samples reveals a positive correlation of Notch2 transcripts with gene transcripts controlling anti-apoptotic processes, stemness and astrocyte fate, and a negative correlation with gene transcripts controlling proapoptotic processes and oligodendrocyte fate. Our data show that Notch2 signaling in NSCs produces features of GSCs and induces astrocytic lineage entry, consistent with a possible role in astrocytoma formation.
Keywords: Notch, glioblastoma, neural stem cell, cancer stem cell, differentiation, apoptosis
Gliomas are the largest group of primary tumors in the brain and include morphologically distinct astrocytomas and oligodendrogliomas. Glioblastoma multiforme (GBM), the most aggressive form of malignant astrocytomas, offers limited therapeutic options with a median survival for GBM patients of less than 14 months.1 Malignant gliomas contain a highly tumorigenic population of glioma stem cells (GSCs) that are defined by their ability to self-renew, to give rise to all cell types within a particular glioma and their resistance to apoptosis.2, 3, 4, 5, 6, 7 Due to their longevity, self-renewal and sustained proliferative capacity, neural stem cells (NSCs) are a likely source for GSCs.2, 3, 4, 5, 6, 7 In addition, the pluripotency of NSCs provides a rationale for the cellular heterogeneity observed in gliomas.1 Dysregulation of genes controlling cell cycle, differentiation and apoptosis in NSCs may therefore promote their transformation into GSCs.2, 3, 4, 5, 6, 7 Intriguingly, Notch2 was shown to be highly expressed in GBM, and the Notch2 gene was found to be amplified in many primary GBM cell lines.8 Moreover, elevated Notch2 signaling increased GBM growth and reduced survival in mouse xenograft models.9 In contrast, Notch2 deletions are frequently observed in oligodendrogliomas and are associated with a more favorable prognosis.10 Together these data support that Notch2 is a prognostic marker and possibly involved in malignant progression. However, whether aberrant Notch2 signaling contributes to NSC transformation and ultimately to gliomagenesis is not known.
Four Notch receptors (Notch1–4) exist in mammals.11 Binding of ligands triggers a proteolytic processing of receptors and translocation of Notch intracellular domains (NICDs) to the nucleus. NICD binding to a transcriptional complex, including RBPjκ and MAML1, leads to transcriptional activation of the effector genes Hairy and Enhancer of Split homologs (e.g., Hes1 or Hes5).11, 12 Notch2 regulates morphogenesis of Bergmann glia cells13 and inhibits granule neuron differentiation in the cerebellum.14 Moreover, Notch2 is expressed throughout the embryonic15, 16 and adult neurogenic regions.16, 17 However, although Notch1 signaling was shown to regulate proliferation, cell fate decisions and survival in NSCs,12, 18, 19, 20, 21 a role for Notch2 in NSC regulation is not established.
Here, we report that constitutive expression of the intracellular domain of Notch2 (N2ICD) in NSCs in transgenic mice promotes proliferation and prevents neuronal lineage entry. NSCs from these mice exhibit increased proliferation, reduced apoptosis and preferentially differentiate into the astrocytic lineage. Likewise, modulation of Notch2 signaling regulates proliferation and apoptosis in human GBM cell lines. Thus, our data support that aberrant Notch2 signaling contributes to NSC transformation and possibly to GBM formation.
Results
N2ICD expression in embryos causes severe hyperplasia and inhibits neurogenesis
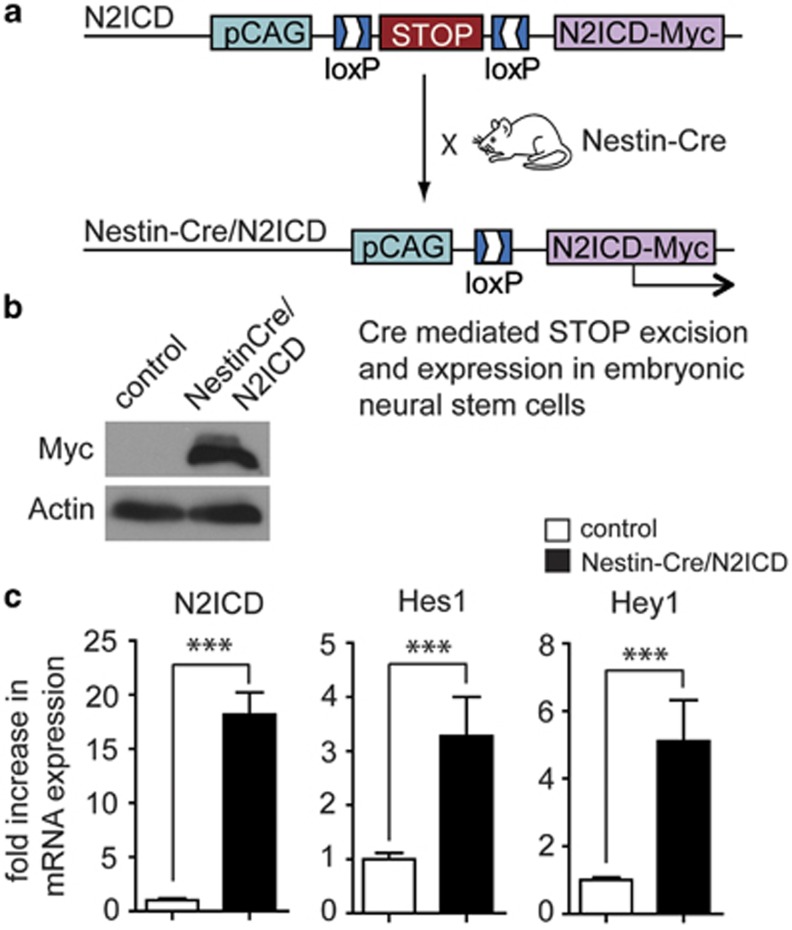
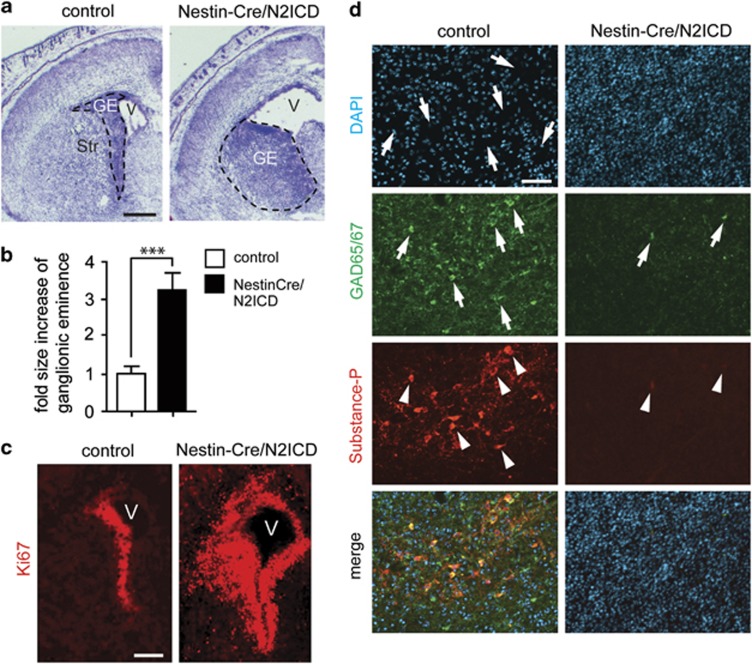
To study the role of Notch2 signaling in the developing brain, we crossed Nestin-Cre mice22 with N2ICD mice23 to drive expression of myc-tagged N2ICD in NSCs and their progeny (Nestin-Cre/N2ICD mice; Figure 1a). Western blot analysis revealed expression of myc-tagged N2ICD in the brain of E18.5 Nestin-Cre/N2ICD mice (Figure 1b). In addition to the expected increase in Notch2 mRNA due to N2ICD transgene expression, Nestin-Cre/N2ICD mice also showed increased mRNA levels for its target genes Hes1 and Hey1 when compared with control mice (Figure 1c). This demonstrates that the transgene generates functional N2ICD. E18.5 Nestin-Cre/N2ICD embryos displayed enlarged ventricles and a hyperplasia of the ganglionic eminence, the neurogenic region in the ventral forebrain (Figure 2a). The ganglionic eminence displayed a threefold increase in size (Figure 2b) and an enlarged region of NSCs identified by Ki67 (Figure 2c) and Nestin immunostaining (Supplementary Figure 1A). The striatal region of E18.5 Nestin-Cre/N2ICD embryos had an increased cell density and lacked the striasome, a typical porous structure (Figure 2d). Moreover, the striatal region lacked immunostaining for Substance-P and GAD65/67, which are commonly used to outline the striatum in the ventral forebrain (Figure 2d). NeuN immunostaining showed that the ventral forebrain of Nestin-Cre/N2ICD mice is not only devoid of GAD65/67+ interneurons but also mature neurons in general (Supplementary Figure 1B). It therefore appears that the striatal region is mainly populated by an increased number of Nestin+ NSCs failing to develop into neurons. Strikingly, the consequences of constitutive N2ICD expression in NSCs are detrimental, as Nestin-Cre/N2ICD mice die at birth. In summary, the above experiments support a dual role for Notch2 during embryogenesis, both in increasing proliferation and inhibiting neurogenesis.
Figure 1.
Transgenic expression of N2ICD in the neurogenic region. (a) Breeding scheme for myc-tagged N2ICD expression in NSCs of Nestin-Cre/N2ICD mice. (b) Western blot revealing myc-tagged N2ICD protein in the brains of E18.5 Nestin-Cre/N2ICD mice but not the brains of single transgenic N2ICD littermate control mice. Actin controls for sample loading. (c) RT-PCR shows increased mRNA levels of Notch2 and its target genes Hes1 and Hey1 in the brains of Nestin-Cre/N2ICD mice compared with control mice. Bar diagram shows mean±S.D., ***P<0.001 (Student's t-test)
Figure 2.
N2ICD expression in NSCs during embryogenesis results in a hyperplasia of the neurogenic region. (a) Cresyl violet stained coronal sections showing hyperplasia of the neurogenic region (ganglionic eminence, GE; outlined by a dashed line) in E18.5 Nestin-Cre/N2ICD mice compared with control mice. E18.5 Nestin-Cre/N2ICD mice also displayed enlarged ventricles (V) and a lack of a properly developed striatum (Str). (b) Quantification of the ganglionic eminence revealed a more than threefold increase in size in E18.5 Nestin-Cre/N2ICD mice compared with E18.5 controls. (c) Immunostaining for the proliferation marker Ki67 reveals a highly increased population of proliferating cells in E18.5 Nestin-Cre/N2ICD mice compared with E18.5 control mice. (d) Immunostaining for the marker proteins GAD65/67 (arrowheads) and Substance P (arrows) reveals that Nestin-Cre/N2ICD mice do not express these proteins in the ventral forebrain of E18.5 mice, in contrast to the striatum of control mice. DAPI staining shows that the typical porous structure of the striasome (arrows in control mice) is lacking in E18.5 Nestin-Cre/N2ICD mice. Bar diagram shows mean±S.D., ***P<0.001 (Student's t-test). Scale bars are (a and c)=200μm, (d)=50 μm
N2ICD expression in adult mice increases proliferation and inhibits neuronal differentiation in neurogenic niches
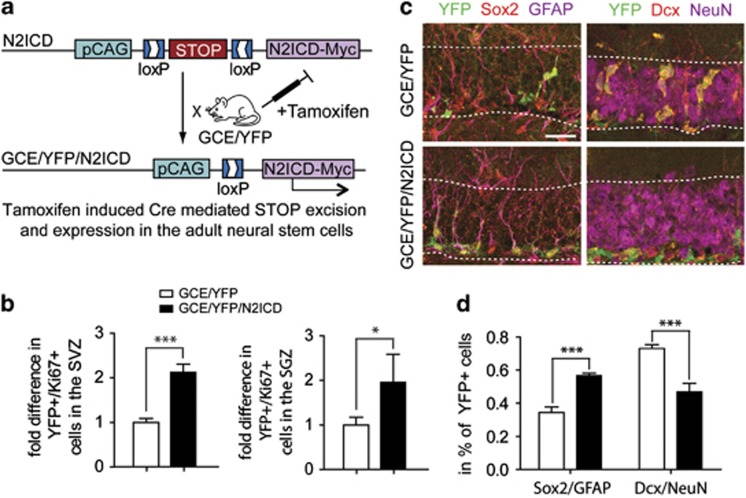
GBM mostly occur in adults and therefore N2ICD expression in adult NSCs more accurately addresses a possible role of Notch2 in gliomagenesis. The perinatal lethality of Nestin-Cre/N2ICD mice precludes studying a possible role of Notch2 in malignant transformation of adult NSCs. We therefore crossed N2ICD mice with double transgenic GFAPCreERT2/R26R-YFP (GCE/YFP (yellow fluorescent protein)) mice to generate triple transgenic GCE/YFP/N2ICD mice.24, 25 These mice allow for tamoxifen-induced N2ICD and YFP expression in adult GFAP+ NSCs and astrocytes24 (Figure 3a). GCE/YFP mice, which express YFP but not N2ICD upon tamoxifen induction, were used as littermate controls. GCE/YFP/N2ICD mice exhibit a twofold increase in Ki67+ proliferating YFP+ cells in the subventricular zone and the subgranular zone (SGZ) of the dentate gyrus, two prominent areas of neurogenesis in the adult brain (Figure 3b). This indicates that N2ICD expression increases proliferation in NSCs in the adult, similar as it does during embryogenesis.
Figure 3.
Notch2 regulates proliferation and differentiation of adult NSCs. (a) N2ICD mice were mated with GFAPCreERT2/Rosa26-YFP (GCE/YFP) mice, which yields GCE/YFP/N2ICD mice that express both N2ICD and YFP upon tamoxifen-induced Stop codon excision in adult NSCs. YFP immunostaining in GCE/YFP/N2ICD mice was therefore used to identify cells that constitutively express N2ICD as a result of the GFAP-CreERT2-mediated excision event. YFP+ cells in GCE/YFP mice were used as controls. YFP+ cells expressing a proliferation marker (Ki67) or differentiation markers (Sox2, GFAP, Dcx, NeuN) were used for quantification in (b) or (c), respectively. (b) Quantification of YFP/Ki67+ cells revealed a twofold increase in proliferating YFP+ cells in GCE/YFP/N2ICD mice compared with GCE/YFP mice in both the SGZ and SVZ, indicating increased proliferation in the neurogenic niche of adult mice with N2ICD expression. (c) Immunostaining for YFP and NSC markers (Sox2, GFAP; left panels) or neuronal markers (Dcx, NeuN; right panels) in the dentate gyrus in GCE/YFP/N2ICD and GCE/YFP mice. Quantification reveals that GCE/YFP/N2ICD mice have approximately a twofold increase in YFP+ cells expressing NSC markers compared with GCE/YFP mice, while the number of YFP+ neurons is strongly decreased (d). This indicates that N2ICD expression increases the number of NSCs, while preventing neurogenesis. GCL=granule cell layer. Bar diagrams show mean±S.E.M., *P<0.05, ***P<0.01 (Student's t-test). Scale bars are (c)=25 μm
We next analyzed whether N2ICD prevents neuronal differentiation in the adult brain (Figure 3c). Brain sections from GCE/YFP/N2ICD and GCE/YFP mice were co-immunostained for YFP and markers for adult NSCs (Sox2, GFAP; of note GFAP, which is widely used as a marker for astrocytes, also labels NSCs in the dentate gyrus) or neuronal markers (Dcx, NeuN). The dentate gyrus of GCE/YFP/N2ICD mice showed approximately a twofold increase in YFP+ cells expressing GFAP/Sox2 (Figures 3c). In addition, GCE/YFP/N2ICD mice had a significantly reduced number of YFP+ cells expressing Dcx/NeuN (Figures 3c). This shows that Notch2 signaling inhibits neuronal differentiation of adult NSCs in the dentate gyrus.
N2ICD expression in neurospheres increases proliferation, promotes survival and astrocytic commitment
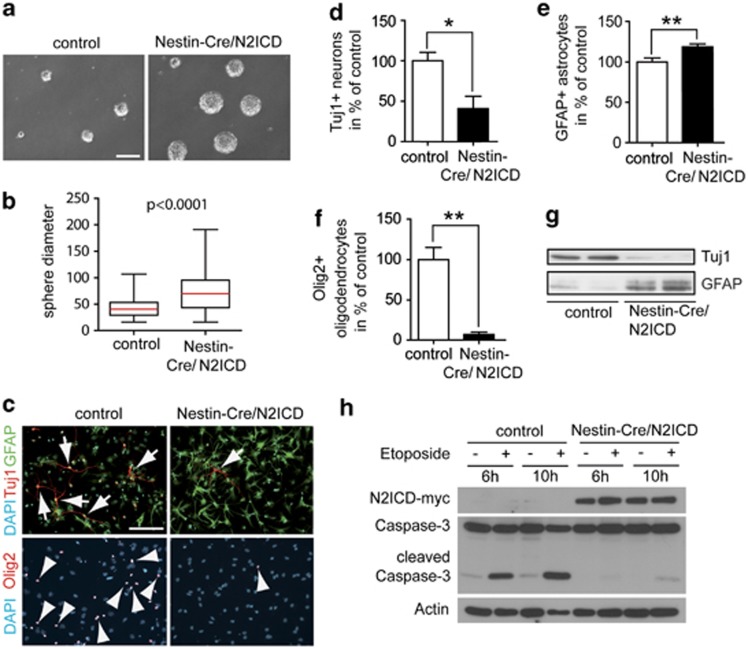
To study NSC proliferation and expansion, we prepared neurospheres from the ganglionic eminence of E14.5 Nestin-Cre/N2ICD and littermate control embryos (Figure 4a). Neurospheres from Nestin-Cre/N2ICD NSCs were significantly larger than those from control NSCs (73.1±2.4 μm, n=226 neurospheres versus 42.56±1.08 μm, n=224 neurospheres, mean diameter±S.E.M., P<0.0001), indicating that N2ICD expression increases NSC proliferation in neurospheres (Figures 4a), similar as in vivo. Next, we used neurospheres to study whether N2ICD regulates NSC fate decisions. We differentiated neurospheres from E14.5 Nestin-Cre/N2ICD embryos in vitro and quantified cells expressing the neuronal marker βIII-Tubulin (Tuj1), the oligodendrocyte marker Olig2 and the astrocyte marker GFAP (Figure 4c). A significantly reduced number of Tuj1+ cells in Nestin-Cre/N2ICD cultures indicates that N2ICD prevents NSCs from efficiently differentiating into neurons (Figures 4c). In contrast, differentiated Nestin-Cre/N2ICD NSCs showed a significant increase in GFAP+ astrocytes (Figures 4c). Intriguingly, the staining intensity for GFAP in differentiated Nestin-Cre/N2ICD NSCs was visibly increased compared with the control (Figure 4c). Increased GFAP protein levels and decreased Tuj1 protein levels were confirmed on immunoblots (Figure 4g). Moreover, the number of Olig2+ oligodendrocytes was significantly decreased in Nestin-Cre/N2ICD NSCs (Figures 4c). This supports that Notch2 signaling biases fate decisions in NSCs toward the astrocytic lineage by inhibiting differentiation into neurons or oligodendrocytes.
Figure 4.
Notch2 signaling regulates NSC proliferation and differentiation in vitro. (a) Nestin-Cre/N2ICD neurospheres overexpressing N2ICD have increased sphere size compared with single transgenic N2ICD control spheres. (b) Quantification of neurosphere diameters showed that the median diameter in Nestin-Cre/N2ICD spheres was increased by 75% when compared with control spheres, suggesting that N2ICD expression increases NSC proliferation. (c) Immunostainings of differentiated Nestin-Cre/N2ICD and control NSCs for neuronal (Tuj1, arrows), astrocytic (GFAP) and oligodendrocytic (Olig2, arrowheads) markers. Quantification of cells expressing marker proteins in percent of DAPI+ nuclei reveals that N2ICD largely blocks neuronal differentiation (d) and increases the number of astrocytes (e). Furthermore, Nestin-Cre/N2ICD NSCs almost completely lost their ability to differentiate into Olig2+ oligodendrocytes (f). (g) GFAP protein levels were highly increased in western blot analysis of differentiated Nestin-Cre/N2ICD NSCs, whereas Tuj1 levels diminished. (h) NSCs overexpressing N2ICD were more resistant to apoptosis. Lower levels of cleaved Caspase-3 were detected in the N2ICD-expressing NSCs after etoposide treatment. Box plot diagrams show median (red line), boxed 25 and 75% percentiles, while whiskers mark minima and maxima (Mann–Whitney test, P<0.0001). Bar diagrams show mean±S.E.M., *P<0.05, **P<0.01 (Student's t-test). Nestin-Cre mediates floxed Stop codon excision in the entire neural lineage.22 All quantifications are therefore based on the total number of cells. Scale bar (b and c)=100 μm
To test the role of N2ICD in NSC survival and apoptosis, Nestin-Cre/N2ICD and control neurospheres were treated with etoposide to induce apoptotic cell death. Etoposide is an anti-cancer agent inhibiting topoisomerase II, which induces DNA strand breaks. Etoposide is widely used in chemotherapy, including the treatment of GBM.26 In our experiments, induction of apoptosis was monitored by Caspase-3 cleavage, which is part of the apoptotic signaling cascade (Figure 4h). Our results show that NSCs overexpressing N2ICD have reduced levels of cleaved Caspase-3 compared with control NSCs, supporting that Notch2 signaling prevents apoptosis.
N2ICD expression in human GBM cell lines increases proliferation and prevents apoptosis
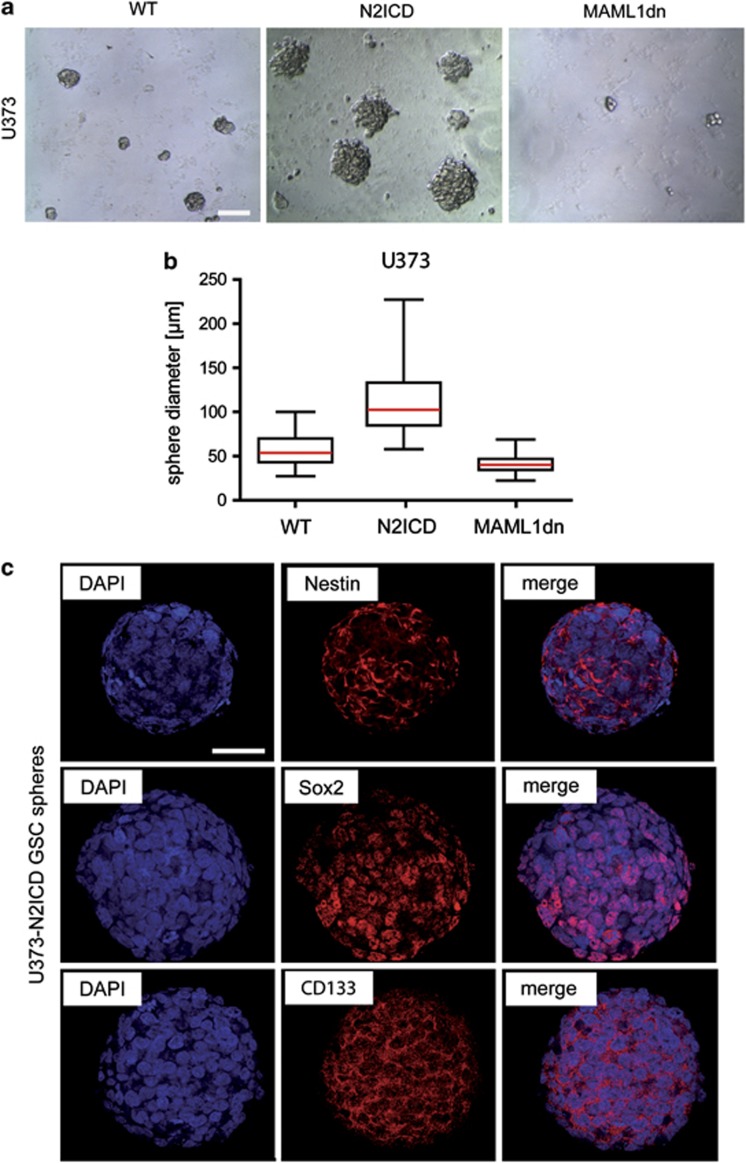
We studied whether Notch2 signaling regulates proliferation and resistance to apoptosis in GBM cells. To activate or inhibit Notch2 signaling in GBM cells, we stably transfected the human GBM cell line U373 with N2ICD (U373-N2ICD cells) or dominant-negative mastermind-like I (U373-MAML1dn cells), which prevents canonical Notch signaling.8, 27 Transfected GBM cells were cultured in neurosphere media under non-adherent condition, which produced GSC-like spheres. Compared with wild-type (WT) spheres, the size of N2ICD-expressing spheres was significantly increased, whereas the size of MAML1dn-expressing spheres was significantly decreased (WT, 56±1.7 μm, n=90 spheres; N2ICD, 111±2.4 μm, n=215; MAML1dn, 41±0.5 μm, n=291; mean diameter ±S.E.M., P<0.0001; Figures 5a and b). The presence of GSC markers (Nestin, Sox2, and CD133) in the spheres confirmed that these derived from GSC-like cells rather than from non stem-like GBM cells growing under non-adherent conditions (Figure 5c).
Figure 5.
Notch2 signaling controls proliferation in GSC-like cells. (a) Compared to spheres derived from the parental U373 cell line (WT), spheres overexpressing N2ICD are increased in size (N2ICD), indicating increased proliferation of GSC-like cells. In contrast, spheres derived from U373 cells expressing MAML1dn, which inhibits canonical Notch signaling, were smaller in size (MAML1dn). (b) Quantification shows that U373-N2ICD spheres have twice the diameter compared with U373-WT spheres, whereas U373-MAML1dn spheres show a decrease in diameter by 25%. (c) Immunostaining of U373-N2ICD spheres for GSC markers (Nestin, Sox2 and CD133) confirms that the spheres retain stem-like properties. Box plot diagrams show median (red line), boxed 25 and 75% percentiles, while whiskers mark minima and maxima (Mann–Whitney test, P<0.0001). Scale bar (a)=100 μm, (c)=50 μm
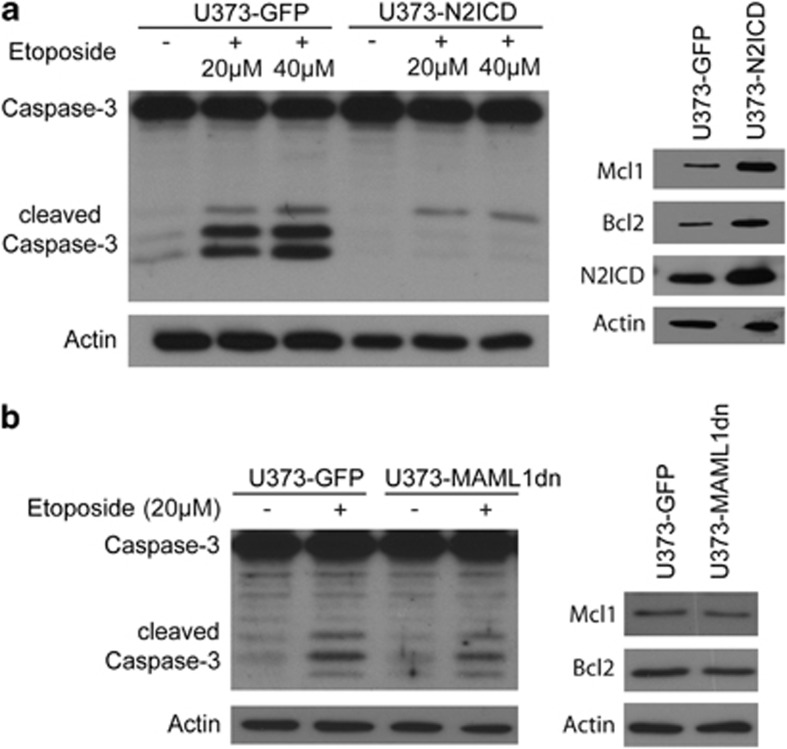
To evaluate whether Notch2 signaling has a role in GBM cells chemoresistance to cell death, U373-N2ICD and U373-GFP (green fluorescent protein) control GBM cells were treated with etoposide. Both cell lines showed a higher resistance to apoptosis induction compared with NSCs (data not shown). In fact, etoposide treatment for U373 GBM cells had to be prolonged to 24 h to observe apoptosis. As with N2ICD-expressing NSCs (Figure 4h), GBM cells expressing N2ICD showed lower levels of cleaved Caspase-3 compared with control GBM cells (Figure 6a). This result supports a role for N2ICD activity in the chemoresistance of glioma cells to apoptosis. In addition, U373-N2ICD GBM cells showed increased levels of anti-apoptotic proteins such as Bcl-2 and Mcl-1 compared with control GBM cells (Figure 6a), in line with the observed resistance to apoptosis. To further investigate whether the prevention of apoptosis in U373 GBM cells is mediated by canonical or non-canonical Notch signaling, we treated U373-MAML1dn and U373-GFP control GBM cells with etoposide. Caspase-3 cleavage in response to etoposide was similar in the U373-MAML1dn and control U373-GFP cells, showing that the inhibition of canonical Notch signaling in U373-MAML1dn GBM cells does not increase apoptosis (Figure 6b). Likewise, protein levels for Bcl2 and Mcl1 were similar in U373-MAML1dn and U373-GFP control GBM cells treated with etoposide (Figure 6b). It is therefore possible that non-canonical Notch signaling prevents apoptosis, consistent with previous reports.28, 29 Thus, Notch2 signaling not only increases proliferation of GSC-like cells but also induces chemoresistance of GBM cells to etoposide treatment, likely by upregulating anti-apoptotic pathways.
Figure 6.
N2ICD expression increases resistance of U373 GBM cells to apoptosis. (a) U373-N2ICD GBM cells expressing N2ICD are more resistant to etoposide-induced apoptosis. Less Caspase-3 protein is cleaved in U373-N2ICD GBM cells compared with U373-GFP GBM cells (left panel). U373-N2ICD GBM cells with increased N2ICD protein levels have increased Mcl1 and Bcl2 protein levels when compared with U373-GFP cells, indicating that Notch2 signaling increases the resistance to apoptosis by upregulation of anti-apoptotic factors. Actins controls for sample loading (right panel). (b) Similar levels of Caspase-3 cleavage are observed in U373-MAML1dn and U373-GFP GBM cells, supporting that the inhibition of canonical Notch signaling does not increase apoptosis in response to etoposide treatment (left panel). Likewise, Bcl2 and Mcl1 protein levels are similar in U373-MAML1dn compared with U373-GFP GBM cells. Actin protein levels control for sample loading (right panel)
Notch2 levels in primary human GBM correlate with antiapoptotic, stem cell and glial markers
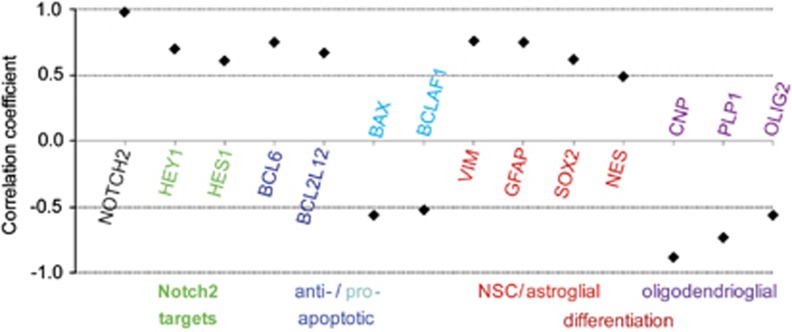
Analyzing published microarray data,30 we investigated whether Notch2 expression in primary human GBM samples correlates with the expression of genes regulating cell differentiation and survival (Figure 7 and Supplementary Table 1). Notch2 expression correlated with expression of the target genes Hes1 and Hey1 (rs=0.7 and 0.61). Transcripts for the anti-apoptotic proteins BCL6 and BCL2L12 exhibited correlation with Notch2 transcripts (rs=0.75 and 0.67), whereas transcripts for the proapoptotic proteins Bax and BCLAF1 showed a negative correlation (rs=−0.56 and −0.52). This further implicates Notch2 into GBM survival. NSC/GSC markers (Sox2 and Nestin) positively correlated with Notch2 expression (rs=0.62 and 0.49), supporting that Notch2 levels correlate with an increase in GSC cells. The expression of the astrocyte markers Vimentin and GFAP highly correlated with Notch2 expression (rs=0.75 and 0.76), in line with Notch2 directing astrocyte versus oligodendrocyte fate decisions. In contrast, transcripts for oligodendrocyte markers (CNP, PLP1 and Olig2) showed a strong negative correlation with Notch2 transcript levels (rs=−0.88, −073 and −0.56). In summary, this correlation analysis further supports that Notch2 signaling contributes to the cellular identity of GBM.
Figure 7.
Notch2 mRNA levels in primary human GBM correlate with mRNA levels of genes inhibiting apoptosis, promoting stemness and inducing astrocyte differentiation. Correlation coefficients for Notch2 and genes involved in apoptosis (blue) and differentiation (red/purple) as well as Notch2 targets (green) are shown as Spearman's Correlations with a P-value of less than 0.05. The correlation coefficient (0.98) for another Notch2 probe is included as a positive control
Discussion
Developmentally stalled NSCs are a possible source of GSCs giving raise to malignant glioma.2, 3, 4, 5, 6, 7 NSCs inherently have the features of tumor cells (e.g., multipotency, self-renewal capacity, high motility and robust proliferative potential) and therefore are at risk for malignant transformation.2, 3, 4, 5, 6, 7 Notch2 is highly expressed in GBM8 and N2ICD expression in GBM cell xenografts significantly reduced survival.9 In contrast, loss of Notch2 is frequently found in oligodendroglioma and low Notch2 levels correlate with a much better prognosis.10 Here, we used a transgenic approach to study whether constitutive Notch2 signaling in NSCs has a role in proliferation, differentiation and apoptosis, and possibly contributes to GBM formation. In support of this, we found that Notch2 signaling in NSCs in vivo increases cell proliferation and prevents neuronal differentiation, both in embryos and in adult mice. Importantly, N2ICD expression is not sufficient to induce tumors but leads to a prominent expansion of the neurogenic niche. Furthermore, N2ICD expression in cultured NSCs promotes astrocyte differentiation at the expense of neuronal and oligodendrocyte differentiation. The expression of N2ICD in NSCs also increased the resistance to apoptosis, rendering these NSC less sensitive to the cytotoxic drug etoposide. Our findings therefore indicate that constitutive Notch2 signaling in NSCs is sufficient to induce key features of GSCs. In addition, they suggest that constitutive Notch2 signaling could promote NSCs to give rise to tumors of the astrocytic rather than the oligodendroglial lineage.
We addressed whether Notch2 signaling is responsible for some of the features of GBM expressing high Notch2 levels. We found that blocking endogenous Notch signaling in cultured GBM cells reduces proliferation, whereas N2ICD expression significantly increases proliferation. Furthermore, we observed that N2ICD expression in cultured GBM cells causes an upregulation of anti-apoptotic proteins and increases cell survival. These results are in line with N2ICD expression increasing proliferation and reducing apoptosis in HSR–GBM1 cells and xenografts thereof.9 Enhanced proliferation and survival of GBM cells with elevated Notch2 levels may therefore provide an explanation for the poor prognosis of GBM with high Notch2 levels and the better prognosis of oligodendroglioma with Notch2 deletions.9, 10 We found that Notch2 expression levels in GBM biopsies positively correlate with the transcript levels of genes controlling stemness (Sox2, Nestin) and astrocyte fate (Vimentin, GFAP), while they negatively correlate with the transcript levels of genes controlling oligodendrocyte fate (Olig2, CNP, PLP1). In addition, Notch2 expression levels in GBM biopsies positively and negatively correlate with the expression levels of antiapoptotic (BCL6, BCL2L12) and proapoptotic (Bax, BCLAF1) markers, respectively.
The enhanced proliferation seen in the presence of Notch2 signaling may stochastically increase the risk of NSCs to acquire somatic mutations and to transit to GSCs. If the increased Notch2 signaling occurs after GSCs are formed this would likely promote GSCs to give rise to astrocytomas, such as GBM, rather than oligodendroglioma. A loss of Notch2 signaling in subsets of expanding GSCs with Notch2 amplification could explain the formation of mixed oligodendroglioma. In any instance, blockade of Notch2 signaling may interfere with GBM formation and thus be of therapeutic benefit. Unfortunately, pan-Notch inhibitors (e.g., γ-secretase inhibitors) produce severe side-effects in the intestinal crypt.31 As genetic deletion of either Notch1 or Notch2 receptors does not result in intestinal phenotypes, a specific therapeutic targeting of Notch2 receptors may still be possible.32 Genentech developed therapeutic antibodies specifically targeting the Adam protease cleavage-site in the Notch1 or Notch2 receptors.33 Although the antibody blocking Notch1 signaling efficiently inhibits proliferation of T-cell acute lymphoblastic leukemia cells, no data are available yet for the antibody blocking Notch2 signaling.33 It certainly would be interesting to test such an antibody for the treatment of GBM.
On a different note, the developmental phenotypes seen in mice expressing N2ICD in NSCs shed light on the functions of Notch2 signaling during embryonic and adult neurogenesis. The pronounced hyperplasia of the neurogenic niche during embryonic development and the ensuing lack of a properly developed striatum indicate that Notch2 not only expands the NSC pool but that Notch2 downregulation is also important to allow subsequent NSC differentiation. Reduced neuronal differentiation of adult NSCs expressing N2ICD within the SGZ of the dentate gyrus supports that Noch2 downregulation is also important for adult neurogenesis. These findings are in line with Notch2 inhibiting differentiation of cerebellar granule neuron precursors14 and keeping astrocytes in an immature state.34 Our developmental studies show that Notch2 has a role in regulating differentiation and proliferation of NSCs in the embryonic and adult brain.
In conclusion, Notch2 signaling in NSCs induces key features of GSCs, such as increased proliferation, reduced apoptosis and induces astrocytic lineage entry. In addition, high/constitutive Notch2 expression may favor the formation of astrocytoma, in particular GBM. Of note, however, high/constitutive Notch2 expression is not sufficient to induce GBM formation, which probably requires the acquisition of additional mutations.
Materials and Methods
Mice
N2ICD mice23 were crossed with heterozygous Nestin-Cre mice22 to obtain double transgenic Nestin-Cre/N2ICD mice that allow N2ICD expression in the neural lineage 22, 35 (Figures 1a). Single transgenic N2ICD mice were used as littermate controls. N2ICD mice were crossed with GFAPCre-ERT2 (hereafter GCE) mice24 containing a Cre/LoxP inducible Rosa26-YFP reporter gene (hereafter YFP)25 resulted in triple transgenic GCE/YFP/N2ICD mice expressing N2ICD in the adult NSC niche and in astrocytes (Figures 3a and data not shown). GCE/YFP mice were used as littermate controls. Intraperitoneal administration of tamoxifen (2 mg, Sigma, St. Louis, MO, USA) once daily for 5 consecutive days was used for Cre-mediated excision of floxed STOP cassettes in 8–10-week-old GCE/YFP/N2ICD mice and GCE/YFP mice. Mice were killed 7 days after the last tamoxifen injection and perfused with paraformaldehyde. Genotyping was performed with TaqMan-PCR primers (YFP mice: sense 5′-ACAGCTCGTCCATGCCGA-3′, antisense 5′-ATCACATGGTCCTGCTGGAGT-3′, probe 5′-FAM-TGATCCCGGCGGCGGTCA-TAMRA-3′ N2ICD mice: sense 5′-ATATCCGCGGTGGAGATCAA-3′, antisense 5′-TAGACCAGGCTGGGCTAAA-3′, probe 5′-VIC-CGGTACCAGATCTC-MGB-3′ Nestin-Cre/GCE mice: sense 5′-GCCGCGCGAGATATGG-3′, primer antisense 5′-GCCACCAGCTTGCATGATC-3′, probe 5′-FAM-CCGCGCTGGAGTTTCAATACCGG-TAMRA-3′). All animal experimentation was performed in accordance with institutional guidelines approved by the veterinary office of Basel-Stadt.
Immunohistochemistry and immunoblots
Immunostaining and immunoblots were performed as described23 with rabbit anti-Caspase-3 (#9062, Cell Signaling, Beverly, MA, USA), mouse anti-beta-Actin (A5316, Sigma), anti-Bcl-2 (Santa Cruz, Santa Cruz, CA, USA) and anti-Mcl1 (Santa Cruz), mouse anti-NeuN (Chemicon, Billerica, MA, USA), rabbit anti-GFAP (Dako, Glostrup, Denmark), mouse anti-GFAP (Chemicon), rat anti-Notch2 (Developmental Studies Hybridoma Bank, Iowa City, IA, USA), mouse anti-Myc (SC-40, Santa Cruz), goat anti-Myc (Santa Cruz), rat anti-Substance-P (Abcam, Cambridge, UK), rabbit anti-Ki67 (Novocastra, Newcastle, UK), rabbit anti-Gad65/67 (Sigma), rabbit anti-Olig2 (Chemicon) goat anti-Sox2 (R&D Systems, Abingdon, UK), goat anti-Dcx (Santa Cruz), chicken anti-GFP (Molecular Probes/Invitrogen, Carlsbad, CA, USA), mouse anti-Nestin (Santa Cruz), rabbit anti-CD133 (Santa Cruz), mouse anti-βIII-Tubulin (Tuj1) (Sigma), mouse anti-Myc (Santa Cruz) and rabbit anti-Caspase-3 (Cell Signaling) antibodies. The secondary antibodies used were Alexa-conjugated or horseradish peroxidase-conjugated (Jackson Immunoresearch, Newmarket, UK). Image analysis was performed with a Leica DMI6000 fluorescence microscope or a Zeiss LSM510 confocal microscope and ImageJ software (NIH, Bethesda, MD, USA).
Neurospheres
NSC cultures were prepared and maintained as described.36 For determination of neurosphere number and size, 100 μl samples containing comparable numbers of cells from each genotype were transferred into wells of a 96-well plate and grown for 5 days. For in vitro differentiation, cells were seeded at a density of 2 × 10⁵ cells/cm2 on coverslips coated with 15 μg/ml poly-L-ornithin and 40 μg/ml laminin. Cells were differentiated in neurosphere medium lacking FGF2, EGF and heparin, and fixed after 5 days with 4% PFA.
Stable expression of N2ICD in GBM cell lines
U373 GBM cells37 were grown and stably transfected as described.8 N2ICD (nucleotides 5107–7425 of the human Notch2 cDNA, AF308601) was expressed from pcDNA3.0-IRES-EGFP, dominant-negative Mastermind-like I (MAML1dn) from pEGFP-N3-MAML1dn (gift of Dr. Aster, HMS, Boston, MA, USA)27 and GFP from pcDNA3.1-IRES-EGFP as control. For culturing GSC-like spheres from GBM, U373 GBM cells were cultured under the same conditions as neurospheres. Parental U373 cells (WT) were used as controls.
RT-PCR quantification
Total RNA was isolated from whole brain of E16.5 embryos using the SV-total-RNA isolation system (Promega, Wallisellen, Switzerland) and used as template to synthesize cDNA with GoScript reverse transcriptase (Promega). Relative quantitative RT-PCR was performed using the Power-SYBR-Green PCR Master Mix (Applied Biosystems, Zug, Switzerland) according to manufacturer's protocol. Data were normalized to GAPDH cDNA. The following primers were used for Notch2 (sense 5′-CCCAAGGACTGCGAGTCAGG-3′, antisense 5′-GGCAGCGGCAGGAATAGTGA-3′), Hes1 (sense 5′-CTACCCCAGCCAGTGTCAAC-3′, antisense 5′-AAGCGGGTCACCTCGTTCAT-3′), Hey1 (sense 5′-CTTGAGTTCGGCGCTGTGTTCC-3′, antisense 5′-GATGCCTCTCCGTCTTTTCCT-3′) and GAPDH (sense 5′-TTAGCCCCCCTGGCCAAGG-3′, antisense 5′-CTTACTCCTTGGAGGCCATG-3′).
Pharmacological induction of apoptosis
After growing 6 days in vitro (div) neurospheres (2–4 passages, Nestin-Cre/N2ICD and single transgenic N2ICD controls) were dissociated to obtain a single cell suspension. Cells were plated at a density of 5 × 10⁴ cells/ml in a 6-well plate (BD, Franklin Lakes, NJ, USA) in neurosphere medium for 4 days to allow neurosphere formation. On the 4th day etoposide (Sigma) was added at a concentration of 20 μM for either 6 or 10 h. Untreated neurospheres were used as a control. Neurospheres were harvested by centrifugation at 300 × g for 5 min and lysed. U373 GBM cells stably transfected either with N2ICD, MAML1dn or GFP were plated at 5 × 10⁴ cells/ml. After 2 days 20 or 40 μM etoposide was added for 24 h and protein extracts were obtained as described above. Apoptosis induction was assessed by immunoblot detection of cleaved Caspase-3 from at least three independent experiments.
Correlation Analysis
For bioinformatics analysis, we used absolute expression values from recently published microarray data.30 Briefly, labeled total RNA from two normal brains and 15 GBM samples was hybridized to Affymetrix U133v2.0 Gene. Data-mining was performed using the Genedata Analyst 4.1 package (Genedata, Basel, Switzerland). All samples were quantile normalized and median scaled to correct for minor variation in expression distribution. Expression values for specific genes were used to calculate Spearman's correlation coefficients.
Acknowledgments
We thank C Giachino, B Erne, J Kinter, T Zeis, V Niketopoulou and S Frank for help with histological analysis, N Gakhar-Koppole, M Lino, JL Boulay, V Taylor and A Pinard for helpful discussion, and R Zedi for animal caretaking. We thank JC Aster for the MAML1dn construct. This work was supported by Oncosuisse CCRP Grant KFP OCS-01613–12–2004 to BB, AM and BH.
Glossary
- NSC
neural stem cell
- GSC
glioma stem cell
- NICD
Notch intracellular domain
- N2ICD
Notch2 intracellular domain
- MAML1
mastermind-like 1
- GBM
glioblastoma multiforme
- SVZ
subventricular zone
- SGZ
subgranular zone
- YFP
yellow fluorescent protein
- GFP
green fluorescent protein
- WT
wild-type
The authors declare no conflict of interest.
Footnotes
Supplementary Information accompanies the paper on Cell Death and Disease website (http://www.nature.com/cddis)
Edited by A Verkhratsky
Supplementary Material
References
- Louis DN, Ohgaki H, Wiestler OD, Cavenee WK, Burger PC, Jouvet A, et al. The 2007 WHO classification of tumours of the central nervous system. Acta Neuropathol. 2007;114:97–109. doi: 10.1007/s00401-007-0243-4. [DOI] [PMC free article] [PubMed] [Google Scholar]
- Tan BT, Park CY, Ailles LE, Weissman IL. The cancer stem cell hypothesis: a work in progress. Lab Invest. 2006;86:1203–1207. doi: 10.1038/labinvest.3700488. [DOI] [PubMed] [Google Scholar]
- Sanai N, Alvarez-Buylla A, Berger MS. Neural stem cells and the origin of gliomas. N Engl J Med. 2005;353:811–822. doi: 10.1056/NEJMra043666. [DOI] [PubMed] [Google Scholar]
- Vescovi AL, Galli R, Reynolds BA. Brain tumour stem cells. Nat Rev Cancer. 2006;6:425–436. doi: 10.1038/nrc1889. [DOI] [PubMed] [Google Scholar]
- Furnari FB, Fenton T, Bachoo RM, Mukasa A, Stommel JM, Stegh A, et al. Malignant astrocytic glioma: genetics, biology, and paths to treatment. Genes Dev. 2007;21:2683–2710. doi: 10.1101/gad.1596707. [DOI] [PubMed] [Google Scholar]
- Stiles CD, Rowitch DH. Glioma stem cells: a midterm exam. Neuron. 2008;58:832–846. doi: 10.1016/j.neuron.2008.05.031. [DOI] [PubMed] [Google Scholar]
- Ignatova TN, Kukekov VG, Laywell ED, Suslov ON, Vrionis FD, Steindler DA. Human cortical glial tumors contain neural stem-like cells expressing astroglial and neuronal markers in vitro. Glia. 2002;39:193–206. doi: 10.1002/glia.10094. [DOI] [PubMed] [Google Scholar]
- Sivasankaran B, Degen M, Ghaffari A, Hegi ME, Hamou MF, Ionescu MC, et al. Tenascin-C is a novel RBPJkappa-induced target gene for Notch signaling in gliomas. Cancer Res. 2009;69:458–465. doi: 10.1158/0008-5472.CAN-08-2610. [DOI] [PubMed] [Google Scholar]
- Fan X, Khaki L, Zhu TS, Soules ME, Talsma CE, Gul N, et al. Notch pathway blockade depletes CD133-positive glioblastoma cells and inhibits growth of tumor neurospheres and xenografts. Stem Cells. 2009;28:5–16. doi: 10.1002/stem.254. [DOI] [PMC free article] [PubMed] [Google Scholar]
- Boulay JL, Miserez AR, Zweifel C, Sivasankaran B, Kana V, Ghaffari A, et al. Loss of NOTCH2 positively predicts survival in subgroups of human glial brain tumors. PLoS One. 2007;2:e576. doi: 10.1371/journal.pone.0000576. [DOI] [PMC free article] [PubMed] [Google Scholar]
- Artavanis-Tsakonas S, Rand MD, Lake RJ. Notch signaling: cell fate control and signal integration in development. Science. 1999;284:770–776. doi: 10.1126/science.284.5415.770. [DOI] [PubMed] [Google Scholar]
- Weinmaster G. Notch signal transduction: a real rip and more. Curr Opin Genet Dev. 2000;10:363–369. doi: 10.1016/s0959-437x(00)00097-6. [DOI] [PubMed] [Google Scholar]
- Komine O, Nagaoka M, Watase K, Gutmann DH, Tanigaki K, Honjo T, et al. The monolayer formation of Bergmann glial cells is regulated by Notch/RBP-J signaling. Dev Biol. 2007;311:238–250. doi: 10.1016/j.ydbio.2007.08.042. [DOI] [PubMed] [Google Scholar]
- Solecki DJ, Liu XL, Tomoda T, Fang Y, Hatten ME. Activated Notch2 signaling inhibits differentiation of cerebellar granule neuron precursors by maintaining proliferation. Neuron. 2001;31:557–568. doi: 10.1016/s0896-6273(01)00395-6. [DOI] [PubMed] [Google Scholar]
- Higuchi M, Kiyama H, Hayakawa T, Hamada Y, Tsujimoto Y. Differential expression of Notch1 and Notch2 in developing and adult mouse brain. Brain Res Mol Brain Res. 1995;29:263–272. doi: 10.1016/0169-328x(94)00257-f. [DOI] [PubMed] [Google Scholar]
- Irvin DK, Zurcher SD, Nguyen T, Weinmaster G, Kornblum HI. Expression patterns of Notch1, Notch2, and Notch3 suggest multiple functional roles for the Notch-DSL signaling system during brain development. J Comp Neurol. 2001;436:167–181. [PubMed] [Google Scholar]
- Breunig JJ, Silbereis J, Vaccarino FM, Sestan N, Rakic P. Notch regulates cell fate and dendrite morphology of newborn neurons in the postnatal dentate gyrus. Proc Natl Acad Sci USA. 2007;104:20558–20563. doi: 10.1073/pnas.0710156104. [DOI] [PMC free article] [PubMed] [Google Scholar]
- de la Pompa JL, Wakeham A, Correia KM, Samper E, Brown S, Aguilera RJ, et al. Conservation of the Notch signalling pathway in mammalian neurogenesis. Development. 1997;124:1139–1148. doi: 10.1242/dev.124.6.1139. [DOI] [PubMed] [Google Scholar]
- Gaiano N, Fishell G. The role of Notch in promoting glial and neural stem cell fates. Annu Rev Neurosci. 2002;25:471–490. doi: 10.1146/annurev.neuro.25.030702.130823. [DOI] [PubMed] [Google Scholar]
- Kageyama R, Nakanishi S. Helix-loop-helix factors in growth and differentiation of the vertebrate nervous system. Curr Opin Genet Dev. 1997;7:659–665. doi: 10.1016/s0959-437x(97)80014-7. [DOI] [PubMed] [Google Scholar]
- Lewis J. Neurogenic genes and vertebrate neurogenesis. Curr Opin Neurobiol. 1996;6:3–10. doi: 10.1016/s0959-4388(96)80002-x. [DOI] [PubMed] [Google Scholar]
- Tronche F, Kellendonk C, Kretz O, Gass P, Anlag K, Orban PC, et al. Disruption of the glucocorticoid receptor gene in the nervous system results in reduced anxiety. Nat Genet. 1999;23:99–103. doi: 10.1038/12703. [DOI] [PubMed] [Google Scholar]
- Tchorz JS, Kinter J, Muller M, Tornillo L, Heim MH, Bettler B. Notch2 signaling promotes biliary epithelial cell fate specification and tubulogenesis during bile duct development in mice. Hepatology. 2009;50:871–879. doi: 10.1002/hep.23048. [DOI] [PubMed] [Google Scholar]
- Hirrlinger PG, Scheller A, Braun C, Hirrlinger J, Kirchhoff F. Temporal control of gene recombination in astrocytes by transgenic expression of the tamoxifen-inducible DNA recombinase variant CreERT2. Glia. 2006;54:11–20. doi: 10.1002/glia.20342. [DOI] [PubMed] [Google Scholar]
- Srinivas S, Watanabe T, Lin CS, William CM, Tanabe Y, Jessell TM, et al. Cre reporter strains produced by targeted insertion of EYFP and ECFP into the ROSA26 locus. BMC Dev Biol. 2001;1:4. doi: 10.1186/1471-213X-1-4. [DOI] [PMC free article] [PubMed] [Google Scholar]
- Franceschi E, Cavallo G, Scopece L, Paioli A, Pession A, Magrini E, et al. Phase II trial of carboplatin and etoposide for patients with recurrent high-grade glioma. Br J Cancer. 2004;91:1038–1044. doi: 10.1038/sj.bjc.6602105. [DOI] [PMC free article] [PubMed] [Google Scholar]
- Weng AP, Nam Y, Wolfe MS, Pear WS, Griffin JD, Blacklow SC, et al. Growth suppression of pre-T acute lymphoblastic leukemia cells by inhibition of Notch signaling. Mol Cell Biol. 2003;23:655–664. doi: 10.1128/MCB.23.2.655-664.2003. [DOI] [PMC free article] [PubMed] [Google Scholar]
- Eliasz S, Liang S, Chen Y, De Marco MA, Machek O, Skucha S, et al. Notch-1 stimulates survival of lung adenocarcinoma cells during hypoxia by activating the IGF-1R pathway. Oncogene. 2010;29:2488–2498. doi: 10.1038/onc.2010.7. [DOI] [PMC free article] [PubMed] [Google Scholar]
- Perumalsamy LR, Nagala M, Banerjee P, Sarin A. A hierarchical cascade activated by non-canonical Notch signaling and the mTOR-Rictor complex regulates neglect-induced death in mammalian cells. Cell Death Differ. 2009;16:879–889. doi: 10.1038/cdd.2009.20. [DOI] [PubMed] [Google Scholar]
- Korur S, Huber RM, Sivasankaran B, Petrich M, Morin P, Hemmings BA, et al. GSK3beta regulates differentiation and growth arrest in glioblastoma. PLoS One. 2009;4:e7443. doi: 10.1371/journal.pone.0007443. [DOI] [PMC free article] [PubMed] [Google Scholar]
- van Es JH, van Gijn ME, Riccio O, van den Born M, Vooijs M, Begthel H, et al. Notch/gamma-secretase inhibition turns proliferative cells in intestinal crypts and adenomas into goblet cells. Nature. 2005;435:959–963. doi: 10.1038/nature03659. [DOI] [PubMed] [Google Scholar]
- Riccio O, van Gijn ME, Bezdek AC, Pellegrinet L, van Es JH, Zimber-Strobl U, et al. Loss of intestinal crypt progenitor cells owing to inactivation of both Notch1 and Notch2 is accompanied by derepression of CDK inhibitors p27Kip1 and p57Kip2. EMBO Rep. 2008;9:377–383. doi: 10.1038/embor.2008.7. [DOI] [PMC free article] [PubMed] [Google Scholar]
- Wu Y, Cain-Hom C, Choy L, Hagenbeek TJ, de Leon GP, Chen Y, et al. Therapeutic antibody targeting of individual Notch receptors. Nature. 2010;464:1052–1057. doi: 10.1038/nature08878. [DOI] [PubMed] [Google Scholar]
- Tanaka M, Kadokawa Y, Hamada Y, Marunouchi T. Notch2 expression negatively correlates with glial differentiation in the postnatal mouse brain. J Neurobiol. 1999;41:524–539. [PubMed] [Google Scholar]
- Tronche F, Kellendonk C, Reichardt HM, Schutz G. Genetic dissection of glucocorticoid receptor function in mice. Curr Opin Genet Dev. 1998;8:532–538. doi: 10.1016/s0959-437x(98)80007-5. [DOI] [PubMed] [Google Scholar]
- Giachino C, Basak O, Taylor V. Isolation and manipulation of mammalian neural stem cells in vitro. Methods Mol Biol. 2009;482:143–158. doi: 10.1007/978-1-59745-060-7_9. [DOI] [PubMed] [Google Scholar]
- Ishii N, Maier D, Merlo A, Tada M, Sawamura Y, Diserens AC, et al. Frequent co-alterations of TP53, p16/CDKN2A, p14ARF, PTEN tumor suppressor genes in human glioma cell lines. Brain Pathol. 1999;9:469–479. doi: 10.1111/j.1750-3639.1999.tb00536.x. [DOI] [PMC free article] [PubMed] [Google Scholar]
Associated Data
This section collects any data citations, data availability statements, or supplementary materials included in this article.


