Abstract
Objectives
The mandibular condylar cartilage is a heterogeneous tissue containing cells at various stages of chondrocyte maturation organized into 4 zones: superficial, polymorphic, flattened, and hypertrophic. The goal of this study was to use transgenic mice containing chondrocyte maturation markers fused to fluorescent protein transgenes to isolate and characterize homogenous cell populations of the mandibular condylar cartilage.
Methods
Fluorescent reporter expression in the mandibular condylar cartilage of transgenic mice containing the 3.6-kb fragment of the rat collagen type 1 promoter fused to a topaz-fluorescent protein (Col3.6-tpz), collagen type 2 promoter fused to a cyan-fluorescent protein (Col2-cyan), and/or collagen type 10 promoter fused to cherry-fluorescent protein (Col10-cherry) was examined. Mandibular condylar cartilage cells were analyzed by fluorescence-activated cell sorting (FACS) and either used for gene expression analysis or plated in cell cultures and exposed to adipogenic, osteogenic, or chondrogenic conditions. To determine cell fate, transgenic mice containing the Col3.6-cre recombinase were bred with cre reporter mice.
Results
Localization and analysis of gene expression revealed that Col3.6-tpz-positive cells corresponded to the polymorphic/flattened zones and Col2-cyan-positive cells corresponded to the flattened/hypertrophic zones of the mandibular condylar cartilage. Mandibular condylar cartilage FACS-sorted Col3.6-tpz-positive cells have the potential to differentiate into bone, cartilage, and fat. Cell fate mapping revealed that Col3.6 cells are precursors of some of the hypertrophic chondrocytes in the mandibular condylar cartilage.
Conclusion
Col3.6-tpz cells represent an earlier stage of the mandibular condylar cartilage maturation pathway.
Key Words: Temporomandibular joint, Mandibular condylar cartilage, Fibrocartilage, Cell fate, Chondrocyte maturation
Introduction
Approximately 10% of the people who suffer from temporomandibular joint (TMJ) diseases have degenerative diseases of the TMJ and in severe cases require joint replacement [Stewart and Standish, 1983; Tanaka et al., 2008]. Recently, emphasis has been placed on cell-based regenerative therapies for TMJ replacement [Detamore et al., 2007; Naujoks et al., 2008]. The mandibular condylar cartilage is a heterogeneous tissue containing cells at various stages of chondrocyte maturation [Shibukawa et al., 2007]. Ideally, regenerative cell-based therapies would be used to reproduce the zonal architecture of the mandibular condylar cartilage [Wang et al., 2009]. However, very little is known about the molecular phenotype of the cells that comprise the mandibular condylar cartilage [Landesberg et al., 1996; Hinton et al., 2009].
Recently, new methods have been developed to isolate and study defined populations of tissues by use of transgenic mice with the promoter of differentiation markers fused to fluorescent protein reporters [Rowe and Lichtler, 2002]. In these methods when the promoter is activated it causes translation of the particular fluorochrome. The advantages of using this technology are that it allows spatial and temporal visualization of the expression of the promoter on tissue sections, cells can easily be isolated by fluorescence-activated cell sorting (FACS), and one can multiplex different fluorescent reporters [Rowe, 2005]. These methods have already been successfully used in bone to label and isolate cells at distinct stages of osteoblast differentiation [Bilic-Curcic et al., 2005].
The mandibular condylar cartilage is organized into 4 zones: the superficial, polymorphic, flattened, and hypertrophic zones [Wadhwa and Kapila, 2008]. It has been postulated that the superficial and polymorphic zones of the mandibular condylar cartilage are similar to periosteum [Meikle, 2007] and contain the progenitors for the flattened and hypertrophic zones [Hinton et al., 2009]. Unlike hyaline cartilage, the mandibular condylar cartilage contains cells that express both collagen (Col) type 1 and collagen type 2, i.e. fibrocartilage [Benjamin and Ralphs, 2004]. Typically, Col2a1 is found in hyaline cartilage [Martel-Pelletier et al., 2008] while Col1a1 [Viguet-Carrin et al., 2006] is expressed in bone. In this study, we used transgenic mice with the 3.6-kb fragment of the rat Col1a1 promoter fused to a green-fluorescent protein (Col3.6-tpz), which has been previously shown to be highly expressed in calvarial osteoblastic cells [Kalajzic et al., 2002], and transgenic mice with the Col2a1 promoter fused to a cyan-fluorescent protein (Col2-cyan), which has been shown to be expressed in the hyaline articular cartilage [Chokalingam et al., 2009], to examine whether we could isolate distinct homogenous cell populations in the mandibular condylar cartilage. We hypothesized that the Col3.6-tpz reporter marks the superficial and polymorphic zones and contains the progenitors for the flattened and hypertrophic zones of the mandibular condylar cartilage. Greater understanding of the mandibular condylar cartilage cell types and their fate is critical for regenerative cell-based therapies specific for the TMJ.
Materials and Methods
We used transgenic mice in a CD-1 background containing promoters of fibrocartilage maturation (collagen types 1, 2, and 10) fused to fluorescent proteins (topaz, cyan, and cherry) to label (sagittal sections of the TMJ), isolate (FACS sorting of mandibular condylar cartilage cells), characterize gene expression (real-time PCR from freshly FACS-sorted mandibular condylar cartilage cells), and determine the differentiation potential (mandibular condylar cartilage FACS-sorted cells cultured in either adipogenic, osteogenic, or chondrogenic conditions) of homogenous cell populations obtained from the mandibular condylar cartilage. We also examined in vivo cell fate by breeding transgenic mice containing the 3.6-kb fragment of the collagen type 1 promoter fused to a cre protein with a cre reporter mouse (X-gal staining performed on sagittal TMJ sections of the pups).
Mice
All experiments were performed under an institutionally (University of Connecticut Health Center) approved protocol for the use of animals in research. The following mice were used in this study: CD-1 transgenic mice at 21–35 days of age containing the 3.6-kb fragment of the rat collagen type 1 promoter fused to a topaz-fluorescent protein (Col3.6-tpz) (n = 93) [Kalajzic et al., 2002]; double-colored mice containing both the collagen type 2 promoter fused to a cyan-fluorescent protein [Chokalingam et al., 2009] (Col2-cyan) and Col3.6-tpz protein (n = 23); tricolored mice with Col3.6-tpz, Col2-cyan, and collagen type 10 fused to cherry-fluorescent protein (Col10-cherry) (n = 3) and Col3.6 fused to a cre recombinase, and Cre reporter mice (n = 5) (ROSA26) [Soriano, 1999]. The Col3.6-tpz, Col10-cherry, and Col3.6 cre were constructed at the University of Connecticut Health Center in the laboratory of Dr. David Rowe. The Col2-cyan was obtained from Dr. Butler [Chokalingam et al., 2009] by Dr. Rowe, while the Rosa26 [Soriano, 1999] mice were purchased from Jackson Lab (Bar Harbor, Maine, USA).
Histology
Dissected TMJ were placed in a biopsy cassette (Thermo Shandon, Pittsburgh, Pa, USA) and fixed for 2 days in freshly prepared 4% paraformaldehyde dissolved in PBS and adjusted to pH 7.4 with NH4OH. The TMJ was then decalcified in 14% EDTA (Sigma-Aldrich, St. Louis, Mo., USA) (pH 7.1) for 3 days, soaked in 30% sucrose in PBS for 1 day at 4°C, and embedded in 10 × 10 × 5 mm disposable vinyl specimen molds (Electron Microscopy Sciences, Hatfield, Pa., USA) filled with frozen embedding medium Cryomatrix (Thermo Shandon). Serial sagittal sections of the whole joint were obtained by cryosectioning on a Leica CM1900 Cryostat (DE-69226; Leica, Inc., Nussloch, Germany) equipped with a CryoJane Frozen Sectioning Kit (Instrumedics, Inc., Richmond, Ill., USA). The CryoJane system is designed to capture a frozen cryostat section on special cold adhesive tape [Jiang et al., 2005] to assist in transferring the section to a cold glass microscope slide coated with an ultraviolet light-curable, pressure-sensitive adhesive (CryoJane adhesive-coated slides; Instrumedics). The section is permanently bonded to the adhesive on the slide with a flash of ultraviolet light.
Fluorescent Imaging.
The slides were rinsed with PBS for 5 min and mounted with 50% glycerol in PBS. Fluorescent imaging was examined with a Zeiss Axioplan 200 inverted microscope equipped with epifluorescence and a Zeiss AxioCam color digital camera. After the fluorescent image had been captured, the coverslip was removed by soaking the slide in PBS until it spontaneously detached, and then the slide was stained with hematoxylin and eosin. Sections through the whole joints were obtained for each animal, and observations were confirmed in different interspaced sections chosen to cover the whole joint. In this way, it was ensured that the reported observations were genuine and not local random abnormalities. The fluorescent imaging data were reproduced in at least 3 different animals of the same genotype.
X-Gal Staining.
TMJs and knees (articular cartilage of the tibia was used as the negative control) from 21-day-old mice carrying both Col3.6-cre and ROSA26 transgenes were dissected into cold PBS and fixed in 0.2% glutaraldehyde (Sigma-Aldrich) at room temperature for 2 h. They were washed 3 times for 30 min each time with wash buffer (2 mM MgCl2 + 0.01% deoxycholate + 0.02% Nonidet P-40 + PBS) at room temperature and incubated in X-gal (Sigma-Aldrich) staining solution [PBS + 5 mM K3Fe (CN)6 + 5 mM K4Fe(CN)6 + 0.01% deoxycholate + 0.02% Nonidet P-40 + 2 mM MgCl2 + 1 mg/ml X-gal) at room temperature overnight. After staining, the samples were postfixed in 10% formalin, decalcified with 14% EDTA, and processed for paraffin embedding. Both TMJs and knees were sagittally sectioned at 5-μm thickness and counterstained with Eosin Y (Thermo Shandon). The X-gal staining data were reproduced in 5 different animals and observations were confirmed in different interspaced serial sections chosen to cover the whole joint.
FACS Sorting
Mouse condylar cartilage or calvaria were isolated from 21-day-old Col3.6-tpz mice (n = 90) or double-colored mice (Col3.6-tpz and Col2-cyan GFP) (n = 20). The condyles were dissected under a dissection microscope and only articular cartilage was collected. The calvariae were collected from the same mice. Cells were pooled from 9–11 mice. Cells from the mandibular condylar cartilage were harvested by digestion with collagenase type I (3 mg/ml) (Worthington, Lakewood, N.J., USA) and dispase (4 mg/ml) (Roche, Basel, Switzerland), and cells from calvaria were harvested by collagenase P (5 mg/ml) (Roche, Basel, Switzerland) and trypsin/EDTA (Sigma-Aldrich) digestion followed by centrifugation at 4°C. Single cell suspensions were prepared by resuspending cell pellets in 2 ml of PBS/2% FBS and passing the cell clumps through an 18-gauge needle followed by filtration through a 30-μm strainer. Cell sorting was performed using an FACS-Vantage BD cell sorter with a 130-μm nozzle at a speed of 3,000–5,000 cells/s. The GFP-cyan was excited at 413 nm by the violet line of a krypton laser and a 470/20 emission filter was used, whereas GFP-topaz was excited at 488 nm with an argon laser and a 550/30 emission filter was utilized. The percentage of cells expressing GFP at high and low intensities was determined manually by setting a separation point at 400 of fluorescent density (fig. 1c). Data were processed using Cell Quest software (Becton Dickinson, Franklin Lakes, N.J., USA). Cells were collected after sorting into α-MEM with 20% FBS (Lot-selected; HyClone, Waltham, Mass., USA). Prior to, during, and following sorting, the cell suspensions were kept at 4°C to minimize changes in gene expression.
Fig. 1.
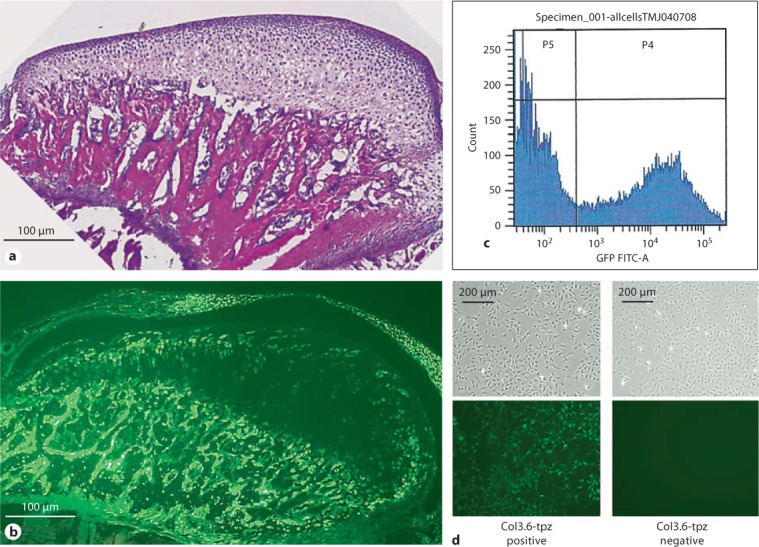
a H&E staining of sagittal sections of the mandibular condylar cartilage of 21-day-old Col3.6-tpz transgenic mice. b Fluorescent image of Col3.6-tpz expression (green) in the mandibular condylar cartilage and disc of 21-day-old mice. c FACS sorting for topaz from cells isolated from the mandibular condylar cartilage of Col3.6-tpz transgenic mice. d Two distinct populations were Col3.6-tpz negative (P5) and Col3.6-tpz positive (P4). The figure shows the bright-field (upper) and green-fluorescent (lower) images of day-4 cultures from GFP-tpz FACS-sorted mandibular condylar cartilage cell cultures.
RNA Extraction and PCR Amplification
Total RNA from freshly FACS-sorted condylar cells was extracted and converted to cDNA using a Cells-to-CT kit (Applied Biosystems, Foster City, Calif., USA) following the manufacturer's protocol. Real-time PCR was performed for the expression of different genes in separate wells (singleplex assay) of 96-well plates in a reaction volume of 20 μl. Gapdh was used as an endogenous control. Three replicates of each sample were amplified using Assays-on-Demand Gene Expression for the particular gene of interest using predesigned unlabeled gene-specific PCR primers and a TaqMan MGB FAM dye-labeled probe. The PCR reaction mixture (including 2× TaqMan Universal PCR Master Mix, 20× Assays-on-Demand Gene Expression Assay Mix, and 50 ng of cDNA) was run in an Applied Biosystems ABI Prism 7300 Sequence Detection System instrument utilizing universal thermal cycling parameters. For the genes for which the efficiencies of target and endogenous control amplification were approximately equal, the relative expression in a test sample compared to a reference calibrator sample (ΔΔCt method) was used for data analysis. For the genes that were not amplified with the same efficiency as the endogenous control, the relative standard curve method in which the target quantity was determined from the standard curve and divided by the target quantity of the calibrator was used. Gene expression was performed for proteoglycan 4 (Prg4), collagen type 1 (Col1a1), parathyroid hormone-related protein (Pthrp), SRY-box-containing gene 9 (Sox9), collagen type 2 (Col2a1), Indian hedgehog (Ihh), collagen type 10 (Col10a1), osteopontin (Opn), osteocalcin (Oc), alkaline phosphatase (Alp), bone sialoprotein (Bsp), dentin matrix acidic phosphoprotein 1 (Dmp1), and Runt-related transcription factor 2 (Runx2).
Cell Culture
To examine the mesenchymal differentiation potential of mandibular condylar cartilage cells, FACS-sorted Col3.6-tpz-positive and Col3.6-tpz-negative cells were plated and grown under adipogenic, osteogenic, or chondrogenic conditions. Mouse condylar cartilage cells were released from mandibular condyles obtained from 21-day-old Col3.6-tpz mice (n = 60) by stepwise enzymatic isolation. FACS sorting was performed on forty pooled mandibular condyles obtained from 20 mice sorted into 2 groups: topaz-GFP-positive cells and topaz-GFP-negative cells. The cells were plated at a concentration of 5 × 10⁴ cells/ml with culture medium [α-MEM with 20% FBS (HyClone), penicillin/streptomycin (P/S; GIBCO), 2 mM L-glutamine (L-glu; GIBCO), and 10 nM dexamethasone (Dex) (D-8893; Sigma-Aldrich) in 100-mm culture dishes. After 7 days of culture, the cells reached confluence and were replated at 1 × 10⁴ cells/cm2 in 6-well dishes for adipogenesis and osteogenesis or pelleted for chondrogenesis. For each differentiation procedure, triplicate wells were used and the procedure was repeated 3 times in independent separate experiments.
For osteogenesis and adipogenesis differentiation, cells continued in culture for 2 more days and then they were switched to differentiation media. For osteogenesis, cells were cultured with α-MEM + 20% FBS (HyClone) + 2 mM L-glu + P/S + 10 nM Dex + 100 μM L-ascorbic acid + 2 mM β-glycerophosphate. The cells were stained with alkaline phosphatase (ALP staining) on day 12 and with Alizarin Red S on day 15. For adipogenesis, cells were cultured with α-MEM + 10% FBS + P/S + 0.5 μM rosiglitazone (No. 71740; Cayman Chemical) + 1 μM insulin (bovine pancreas, I5500; Sigma-Aldrich). Oil Red O staining was performed for detecting adipocytes on day 21 of culture.
For chondrogenesis, the cells were pelleted (2 × 10⁶ cells per pellet) on day 7 and the pellets were cultured in DMEM + P/S + L-glu + Dex (10–7M) + 100 μM L-ascorbic acid + 1% ITS + 1 mM pyruvate with 10 ng/ml of TGF-β1 for 3 more weeks. The pellets were fixed with 10% formalin and processed for frozen sections, and Alcian blue staining was performed on the sections.
Statistical Analysis
The statistical significance of differences among means was determined by analysis of variance (ANOVA) with a post hoc comparison of more than 2 means via the Bonferroni method using GraphPad Prism (San Diego, Calif., USA).
Results
Col3.6-tpz expression was found exclusively in the upper zones of the mandibular condylar cartilage (fig. 1b) and not in any other articular cartilages (data not shown).
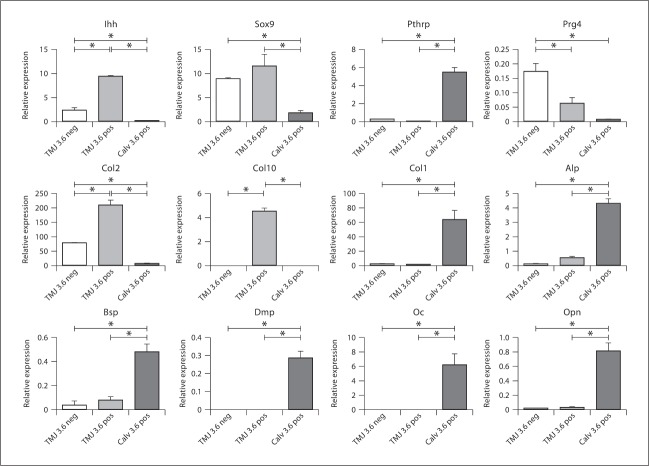
To compare the similarities and differences between Col3.6-tpz cells in the mandibular condylar cartilage to Col3.6-tpz cells in the calvaria, we performed a gene expression analysis of chondrocyte and osteoblastic maturation markers on freshly isolated FACS-sorted cells from the 2 tissues (fig. 1c). FACS-sorted Col3.6-tpz-positive cells in the mandibular condylar cartilage had a significantly higher expression of cartilage maturation markers (Col2a1, Col10a1, Sox9, and Ihh) and a significantly lower expression of osteoblastic differentiation markers (Dmp1, Opn, Oc, Bsp, and Alp) compared to FACS-sorted Col3.6-tpz-positive cells from the calvaria (fig. 2). We also found that FACS-sorted Col3.6-tpz-positive cells had a significantly higher expression of Col2a1, Col10a1, and Ihh and a significantly lower expression of Prg4 than did FACS-sorted Col3.6-tpz-negative cells obtained from the mandibular condylar cartilage.
Fig. 2.
Gene expression from FACS-sorted calvaria and mandibular condylar cartilage cells obtained from Col3.6-tpz transgenic mice. Cells were pooled from 10 mice and the experiment was repeated 3 times. Three populations of cells were analyzed: (1) mandibular condylar cartilage Col3.6-tpz-negative cells, (2) mandibular condylar cartilage Col3.6-tpz-positive cells, and (3) calvaria Col3.6-tpz-positive cells. Points are the mean ± SE for n = 3 for each group. * Significant difference (p < 0.05).
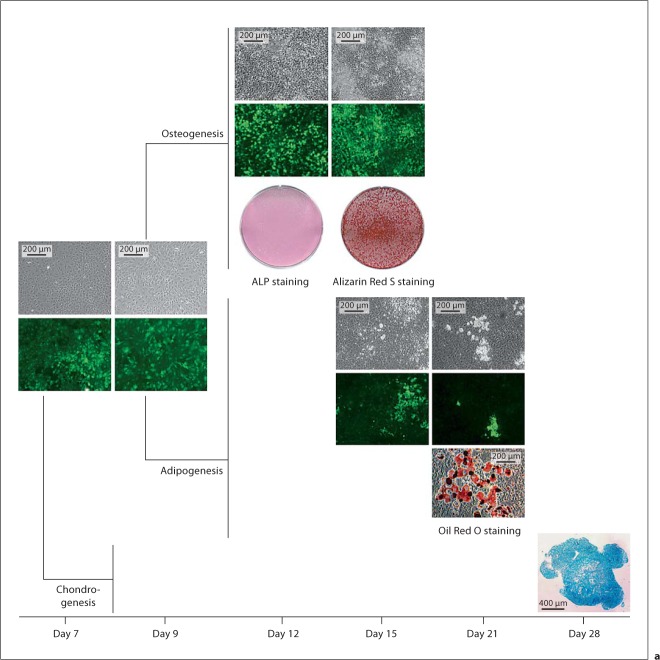
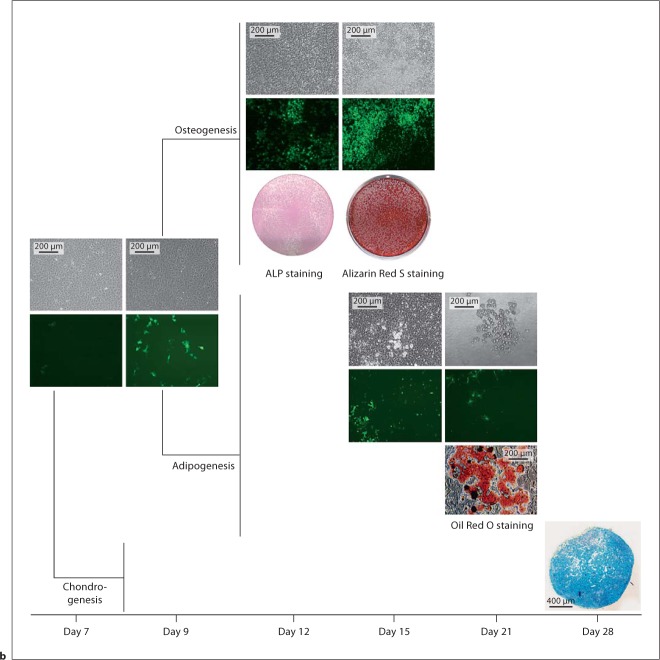
FACS-sorted Col3.6-tpz-positive and Col3.6-tpz-negative cells were also plated in cell cultures and exposed to adipogenic, chondrogenic, or osteogenic conditions. We found that both cell populations had the ability to differentiate into fat, bone, or cartilage as determined by Oil Red O, Alizarin Red, and Alcian blue staining (fig. 3). The experiment was repeated in 3 other separate independent experiments with similar results. Under adipogenic and osteogenic conditions, there was no Alizarin Red or Oil Red O staining detected, respectively (data not shown).
Fig. 3.
Osteogenesis, adipogenesis, and chondrogenesis potential of Col3.6-tpz-positive (a) or Col3.6-tpz-negative (b) cells. After FACS sorting, the cells were cultured for 7 days and grown to confluence. The cells were then replated at a density of 1 × 10⁴ cells/cm2 into 6-well culture plates, cultured for 2 more days (day 9), and exposed to either osteogenesis (α-MEM + 20% FBS + 2 mM glutamine + P/S + 10 nM Dex + 100 μM phosphoascorbate + 2 mM β-glycerophosphate) or adipogenesis (α-MEM + 10% FBS + P/S + 0.5 nM rosiglitazone + 1.0 nM insulin) media. For chondrogenesis, the cells were pelleted at 2 × 10⁶ cells per pellet and cultured with chondrogenesis medium [DMEM + P/S + L-glu + Dex (10–7M) + 100 μM L-ascorbic acid + 1% ITS + 1 mM pyruvate with 10 ng/ml of TGF-β1]. The cells were stained with ALP on day 12 of culture and Alizarin Red S on day 15 of culture for osteogenesis, with Oil Red O staining on day 21 of culture for adipogenesis, or with Alcian blue staining on day 28 of pellet culture on frozen sections for chondrogenesis.
We bred transgenic mice containing the Col3.6-tpz and Col2-cyan transgenes and examined if there was any overlapping expression in the mandibular condylar cartilage. In the upper zones there was only Col3.6-tpz expression, in the intermediate zones there was overlapping expression, and in the inferior zones there was only Col2-cyan expression (fig. 4a, b). FACS sorting for cyan and topaz-fluorescent proteins from freshly isolated mandibular condylar cartilage cells obtained from transgenic mice containing both the Col3.6-tpz and Col2-cyan transgenes was performed. To prevent contamination from the underlying subchondral bone, we did not include the deep hypertrophic zone when we isolated the mandibular condylar cartilage. Four distinct cell populations were obtained from FACS sorting: (1) double-negative Col2-cyan/Col3.6-tpz, (2) Col3.6-tpz-positive, (3) Col2-cyan-positive, and (4) double-positive Col2-cyan/Col3.6-tpz (fig. 4c). Real-time PCR analysis of gene expression showed that Col2-cyan-positive and double-positive Col2-cyan/Col3.6-tpz cells had a higher expression of late chondrocyte maturation markers (Ihh, Col10a1, and Col2a1) compared to the Col3.6-tpz-positive cell population (fig. 4). In addition, the Col3.6-tpz-positive cell population had a higher expression of late chondrocyte maturation markers than did the double-negative cell population.
Fig. 4.
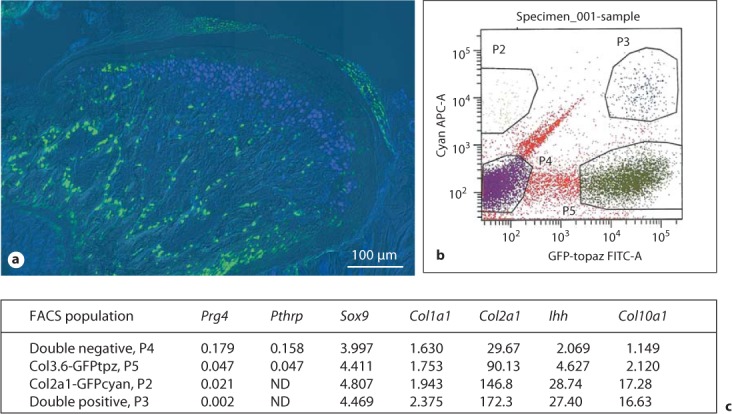
a Composite image of the mandibular condylar cartilage of 3-week-old transgenic mice carrying Col3.6-tpz (green) and Col2-cyan (blue) transgenes. b FACS sorting for cyan and topaz on the mandibular condylar cartilage cells obtained from ten 21-day-old transgenic mice littermates. Four populations were isolated: (1) double-negative (P4), (2) Col3.6 GFP tpz-positive (P5), (3) Col2a1 GFP cyan-positive (P2), and (4) double-positive (P3). c q-PCR analysis of gene expression on FACS sorted mandibular condylar cartilage cells. Numbers represent the average RQ values for 2 litters.
To examine the relationship between Col3.6-tpz-expressing cells and hypertrophic chondrocytes in the mandibular condylar cartilage, we triple bred transgenic mice containing the Col3.6-tpz, Col2-cyan, and Col10-cherry transgenes. In the mandibular condylar cartilage, there were transitioning cells of Col3.6-tpz→Col2-cyan and Col2-cyan→Col10-cherry (fig. 5). However, we did not find any Col3.6-topaz→Col10-cherry transitioning cells.
Fig. 5.
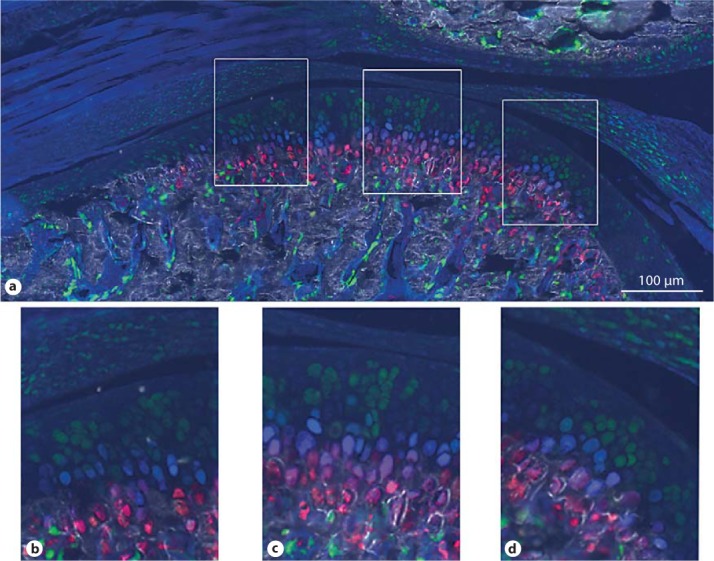
Composite GFP images of TMJ from 5-week-old transgenic mice carrying Col3.6-topaz (green), Col2a1-cyan (blue), and Col10A1-cherry (red) transgenes (top). a Image of the whole joint. b–d Corresponding magnified images of the anterior, central, and posterior portions.
To determine the fate of Col3.6 cells in the mandibular condylar cartilage, transgenic mice containing the Col3.6-cre recombinase transgene were bred with Cre reporter mice (ROSA26). LacZ expression determined by X-gal staining was found in all of the zones of the mandibular condylar cartilage (fig. 6a, b). However, not all of the cells in the flattened and hypertrophic zones of the mandibular condylar cartilage were X-gal stained. There was no X-gal staining in the articular cartilage of the tibia (fig. 6c). Similar results were found in 4 other Col3.6 cre/ROSA26 mice (data not shown).
Fig. 6.

a Mandibular condylar cartilage from a 21-day-old Col3.6 cre/Rosa LacZ transgenic mouse. Blue staining indicates that cells at one time expressed Col3.6. b Magnified image of the inset in a. c X-gal staining of the articular cartilage of a knee joint from the same Col3.6 cre/Rosa LacZ mouse.
Discussion
The goal of regenerative medicine is to mimic the native structure of the tissue. One of the great limitations in regenerating the TMJ is that the cells that make up the mandibular condylar cartilage have not been fully characterized. The mandibular condylar cartilage is composed of 4 distinct zones. The most superficial layer is the articular or superficial zone. It is found adjacent to the joint cavity and forms the outermost functional surface. Cells in this zone express the superficial zone protein (Szp), a product of the Proteoglycan 4 gene [Ohno et al., 2006]. The second zone is the polymorphic or proliferative zone and is predominantly populated with chondroprogenitor cells. There is no structured organization in the formation or arrangement of cells in this layer in contrast to what is usually seen in growth plate cartilage. Cells in this zone actively proliferate and express Pthrp and Sox9 [Shibukawa et al., 2007]. PTHrP is believed to enhance or sustain the proliferation of chondroprogenitor cells [Shibukawa et al., 2007], promote the maturation of chondroprogenitor cells to chondroblasts in the flattened zone, and inhibit chondrocyte hypertrophy [Huang et al., 2001; Rabie et al., 2003; Tsutsui et al., 2008]. However, SOX9 is believed to be a master regulator in chondrogenesis [Bi et al., 1999]. The third zone is the flattened zone. Cells in this layer are characterized by the expression of Sox9 and Col2 [Shibukawa et al., 2007]. The fourth zone is the hypertrophic zone. Cells in the hypertrophic zone are characterized by the expression of collagen type X (Col10) [Shibukawa et al., 2007]. There is only 1 study that we are aware of that has isolated homogenous populations of the mandibular condylar cartilage. In that study, bovine mandibular condylar cartilage cells were sorted by size using countercurrent centrifugal elutriation. Landesberg et al. [1996] found that the largest cells were hypertrophic chondrocytes while the smaller cells were fibroblast-like. However, the disadvantage of this approach was the lack of sensitivity of using size to obtain homogeneous cell populations of the mandibular condylar cartilage.
In this study, we used promoters of chondrocyte maturation markers (Col1a1, Col2, and Col10) fused to fluorescent proteins to label and isolate homogenous cell populations of the mandibular condylar cartilage by FACS. We found that Col2-cyan (fig. 4) was localized to the flattened/hypertrophic zones and absent from the upper zones of the mandibular condylar cartilage, which correlated with previous reports on Col2a1 mRNA endogenous gene expression [Shibukawa et al., 2007; Ochiai et al., 2010] in the mandibular condylar cartilage. Gene expression analysis of freshly isolated Col2-cyan cells further supported the expression of Col2-cyan in the flattened/hypertrophic zones. For example, we found that Col2-cyan-positive cells had a higher expression of Col2a1 mRNA and Ihh mRNA and a lower expression of Prg4 mRNA and Pthrp mRNA than did Col2-cyan-negative cells.
Col10-cherry (fig. 5) was exclusively found in the deep hypertrophic zone, which correlated with the Col10a1 mRNA reported expression [Fukada et al., 1999; Hossain et al., 2005] in the mandibular condylar cartilage. We were not able to isolate Col10-cherry cells due to the large size of the hypertrophic chondrocytes (we chose a 30-μm cell strainer for FACS sorting to obtain single cell suspensions of the mandibular condylar cartilage) and because of the difficulty of isolating them without contamination of the underlying subchondral bone.
Col3.6-tpz expression was predominantly found in the upper zones of the mandibular condylar cartilage. Gene expression analysis revealed that Col3.6-tpz-positive cells had a significantly higher expression of chondrocyte maturation markers and a significantly lower expression of Prg4 compared to Col3.6-tpz-negative cells, which suggests that Col3.6-tpz-positive cells were predominantly localized within the polymorphic/flattened zone of the mandibular condylar cartilage. Despite a higher expression of Col10a1 mRNA in the FACS-sorted Col3.6-tpz-positive cells compared to Col3.6-tpz-negative cells from the mandibular condylar cartilage, we do not think Col3.6-tpz-positive cells labeled hypertrophic chondrocytes. This is because, as we previously stated, it was difficult for us to isolate mandibular hypertrophic chondrocytes, none of the Col10-cherry cells had any Col3.6-tpz fluorescence, and Col3.6-tpz-positive cells did not have a significant increase in the gene expression of other hypertrophic chondrocyte markers (Alp, Bsp and Opn) [Gerstenfeld and Shapiro, 1996] compared to Col3.6-tpz-negative cells. Gene expression studies have shown that Col1a1 mRNA expression is localized throughout the mandibular condylar cartilage with possibly higher expression in the upper zones [Fukunaga et al., 2003; Wang et al., 2009]. In contrast, gene expression analysis of freshly isolated FACS-sorted mandibular condylar cartilage cells showed that there was equal expression of Col1a1 mRNA in Col3.6-tpz-positive cells compared to Col3.6-tpz-negative cells, which suggests that Col3.6-tpz expression does not match Col1a1 mRNA endogenous gene expression in the mandibular condylar cartilage. Similar results have been found in bone. Various fragments of the rat Col1a1 mRNA promoter were initially constructed to mark cells of the osteoblast lineage. It was determined that the 3.6-kb fragment of the rat Col1a1 promoter marked earlier cells in the osteoblast lineage compared to the 2.3-kb fragment of the rat Col1a1 promoter and that neither promoter correlated with endogenous Col1a1 mRNA gene expression [Kalajzic et al., 2005].
There were cells in the superficial or articular zone of the mandibular condylar cartilage that were not labeled by Col3.6-tpz or Col2-cyan. Gene expression of chondrocyte maturation markers of this population of cells (double negative; fig. 4c) revealed that there was less expression of both early (Sox9 and Col2a1) and late (Ihh and Col10a1) chondrocyte maturation markers compared to the Col3.6-tpz-positive cell population. Therefore, it may be possible that there are early progenitor cells in the superior portion of the mandibular condylar cartilage that differentiate into Col3.6-tpz cells. In support of this, we found that during our in vitro Col3.6-tpz-negative cell cultures the cells turned Col3.6-tpz positive during adipogenic and osteoblastic differentiation (fig. 3b). In addition, Hinton et al. [2009] recently found that there was a high expression of tooth-related and myogenic genes in the perichondrium, suggesting that cells within upper portions of the mandibular condylar cartilage have a higher level of plasticity than do mesenchymal progenitors.
From our multiplex fluorescent reporter studies, it appeared that there was a Col3.6-tpz→Col2-cyan→Col10-cherry cell maturation lineage in the mandibular condylar cartilage. Cell fate mapping of Col3.6-tpz cells revealed that Col3.6-tpz cells are the precursors of some but not all of the cells in the flattened and hypertrophic zones of the mandibular condylar cartilage. Taken together, the results suggest that there are multiple endochondral ossification lineage pathways in the mandibular condylar cartilage which are either dependent or independent of a Col3.6-tpz intermediate. During fracture healing, fibrocartilage cells in the callus undergo endochondral ossification [Schindeler et al., 2008], while in the growth plate endochondral ossification proceeds without a fibrocartilage intermediate. Therefore, it is possible that both of these pathways are active within the mandibular condylar cartilage.
In conclusion, via the use of transgenic mice with the promoters of chondrogenic maturation markers fused to fluorescent proteins, we isolated, characterized, and identified mandibular condylar cartilage cells at various stages of maturation. Specifically, we found that cells within the polymorphic/flattened zone expressed the 3.6-kb fragment of the collagen type 1 promoter, had mesenchymal-like cell properties (in vitro potential to differentiate into fat or bone), and could differentiate in vivo into collagen type 10-expressing hypertrophic chondrocytes through a collagen type 2-expressing cell intermediate. Greater understanding of the cellular biology and lineage of the mandibular condylar cartilage is critical for regenerative-based therapies specific for the TMJ.
Acknowledgements
This work was supported by 5K22DE017193 (S.W.) and 1R01DE020097 (S.W.) from the NIH.
Abbreviations used in this paper
- Col3.6-tpz
3.6-kb fragment of the rat collagen type I promoter fused to a topaz-fl uorescent protein
- Col2-cyan
collagen type 2 promoter fused to a cyan fluorescent protein
- Col10-cherry
collagen type 10 promoter fused to cherry fl uorescent protein
- FACS
fluorescence-activated cell sorting
- TMJ
temporomandibular joint
References
- Benjamin M., Ralphs J.R. Biology of fibrocartilage cells. Int Rev Cytol. 2004;233:1–45. doi: 10.1016/S0074-7696(04)33001-9. [DOI] [PubMed] [Google Scholar]
- Bi W., Deng J.M., Zhang Z., Behringer R.R., de Crombrugghe B. Sox9 is required for cartilage formation. Nat Genet. 1999;22:85–89. doi: 10.1038/8792. [DOI] [PubMed] [Google Scholar]
- Bilic-Curcic I., Kronenberg M., Jiang X., Bellizzi J., Mina M., Marijanovic I., Gardiner E.M., Rowe D.W. Visualizing levels of osteoblast differentiation by a two-color promoter-GFP strategy type I collagen-GFPcyan and osteocalcin-GFPtpz. Genesis. 2005;43:87–98. doi: 10.1002/gene.20156. [DOI] [PubMed] [Google Scholar]
- Chokalingam K., Hunter S., Gooch C., Frede C., Florer J., Wenstrup R., Butler D. Three-dimensional in vitro effects of compression and time in culture on aggregate modulus and on gene expression and protein content of collagen type II in murine chondrocytes. Tissue Eng Part A. 2009;15:2807–2816. doi: 10.1089/ten.tea.2008.0560. [DOI] [PMC free article] [PubMed] [Google Scholar]
- Detamore M.S., Athanasiou K.A., Mao J. A call to action for bioengineers and dental professionals directives for the future of TMJ bioengineering. Ann Biomed Eng. 2007;35:1301–1311. doi: 10.1007/s10439-007-9298-6. [DOI] [PubMed] [Google Scholar]
- Fukada K., Shibata S., Suzuki S., Ohya K., Kuroda T. In situ hybridisation study of type I, II, X collagens and aggrecan mRNAs in the developing condylar cartilage of fetal mouse mandible. J Anat. 1999;195:321–329. doi: 10.1046/j.1469-7580.1999.19530321.x. [DOI] [PMC free article] [PubMed] [Google Scholar]
- Fukunaga T., Yamashiro T., Oya S., Takeshita N., Takigawa M., Takano-Yamamoto T. Connective tissue growth factor mRNA expression pattern in cartilages is associated with their type I collagen expression. Bone. 2003;33:911–918. doi: 10.1016/j.bone.2003.07.010. [DOI] [PubMed] [Google Scholar]
- Gerstenfeld L.C., Shapiro F.D. Expression of bone-specific genes by hypertrophic chondrocytes implication of the complex functions of the hypertrophic chondrocyte during endochondral bone development. J Cell Biochem. 1996;62:1–9. doi: 10.1002/(SICI)1097-4644(199607)62:1%3C1::AID-JCB1%3E3.0.CO;2-X. [DOI] [PubMed] [Google Scholar]
- Hinton R.J., Serrano M., So S. Differential gene expression in the perichondrium and cartilage of the neonatal mouse temporomandibular joint. Orthod Craniofac Res. 2009;12:168–177. doi: 10.1111/j.1601-6343.2009.01450.x. [DOI] [PMC free article] [PubMed] [Google Scholar]
- Hossain K.S., Amizuka N., Ikeda N., Nozawa-Inoue K., Suzuki A., Li M., Takeuchi K., Aita M., Kawano Y., Hoshino M., Oda K., Takagi R., Maeda T. Histochemical evidences on the chronological alterations of the hypertrophic zone of mandibular condylar cartilage. Microsc Res Tech. 2005;67:325–335. doi: 10.1002/jemt.20211. [DOI] [PubMed] [Google Scholar]
- Huang W., Chung U.I., Kronenberg H.M., de Crombrugghe B. The chondrogenic transcription factor Sox9 is a target of signaling by the parathyroid hormone-related peptide in the growth plate of endochondral bones. Proc Natl Acad Sci USA. 2001;98:160–165. doi: 10.1073/pnas.011393998. [DOI] [PMC free article] [PubMed] [Google Scholar]
- Jiang X., Kalajzic Z., Maye P., Braut A., Bellizzi J., Mina M., Rowe D.W. Histological analysis of GFP expression in murine bone. J Histochem Cytochem. 2005;53:593–602. doi: 10.1369/jhc.4A6401.2005. [DOI] [PubMed] [Google Scholar]
- Kalajzic I., Kalajzic Z., Kaliterna M., Gronowicz G., Clark S.H., Lichtler A.C., Rowe D. Use of type I collagen green fluorescent protein transgenes to identify subpopulations of cells at different stages of the osteoblast lineage. J Bone Miner Res. 2002;17:15–25. doi: 10.1359/jbmr.2002.17.1.15. [DOI] [PubMed] [Google Scholar]
- Kalajzic I., Staal A., Yang W.P., Wu Y., Johnson S.E., Feyen J.H., Krueger W., Maye P., Yu F., Zhao Y., Kuo L., Gupta R.R., Achenie L.E., Wang H.W., Shin D.G., Rowe D.W. Expression profile of osteoblast lineage at defined stages of differentiation. J Biol Chem. 2005;280:24618–24626. doi: 10.1074/jbc.M413834200. [DOI] [PubMed] [Google Scholar]
- Landesberg R., Takeuchi E., Puzas J.E. Cellular, biochemical and molecular characterization of the bovine temporomandibular joint disc. Arch Oral Biol. 1996;41:761–767. doi: 10.1016/s0003-9969(96)00068-4. [DOI] [PubMed] [Google Scholar]
- Martel-Pelletier J., Boileau C., Pelletier J.P., Roughley P.J. Cartilage in normal and osteoarthritis conditions. Best Pract Res Clin Rheumatol. 2008;22:351–384. doi: 10.1016/j.berh.2008.02.001. [DOI] [PubMed] [Google Scholar]
- Meikle M.C. Remodeling the dentofacial skeleton the biological basis of orthodontics and dentofacial orthopedics. J Dent Res. 2007;86:12–24. doi: 10.1177/154405910708600103. [DOI] [PubMed] [Google Scholar]
- Naujoks C., Meyer U., Wiesmann H.P., Jasche-Meyer J., Hohoff A., Depprich R., Handschel J. Principles of cartilage tissue engineering in TMJ reconstruction. Head Face Med. 2008;4:3. doi: 10.1186/1746-160X-4-3. [DOI] [PMC free article] [PubMed] [Google Scholar]
- Ochiai T., Shibukawa Y., Nagayama M., Mundy C., Yasuda T., Okabe T., Shimono K., Kanyama M., Hasegawa H., Maeda Y., Lanske B., Pacifici M., Koyama E. Indian hedgehog roles in post-natal TMJ development and organization. J Dent Res. 2010;89:349–354. doi: 10.1177/0022034510363078. [DOI] [PMC free article] [PubMed] [Google Scholar]
- Ohno S., Schmid T., Tanne Y., Kamiya T., Honda K., Ohno-Nakahara M., Swentko N., Desai T.A., Tanne K., Knudson C.B., Knudson W. Expression of superficial zone protein in mandibular condyle cartilage. Osteoarthritis Cartilage. 2006;14:807–813. doi: 10.1016/j.joca.2006.02.002. [DOI] [PMC free article] [PubMed] [Google Scholar]
- Rabie A.B., Tang G.H., Xiong H., Hagg U. PTHrP regulates chondrocyte maturation in condylar cartilage. J Dent Res. 2003;82:627–631. doi: 10.1177/154405910308200811. [DOI] [PubMed] [Google Scholar]
- Rowe D.W. Viewing problems in bone biology from the perspective of lineage identification. J Musculoskelet Neuronal Interact. 2005;5:350–352. [PubMed] [Google Scholar]
- Rowe D., Lichtler A. A strategy for identifying osteoporosis risk genes. Endocrine. 2002;17:67–75. doi: 10.1385/ENDO:17:1:67. [DOI] [PubMed] [Google Scholar]
- Schindeler A., McDonald M.M., Bokko P., Little D.G. Bone remodeling during fracture repair the cellular picture. Semin Cell Dev Biol. 2008;19:459–466. doi: 10.1016/j.semcdb.2008.07.004. [DOI] [PubMed] [Google Scholar]
- Shibukawa Y., Young B., Wu C., Yamada S., Long F., Pacifici M., Koyama E. Temporomandibular joint formation and condyle growth require Indian hedgehog signaling. Dev Dyn. 2007;236:426–434. doi: 10.1002/dvdy.21036. [DOI] [PubMed] [Google Scholar]
- Soriano P. Generalized lacZ expression with the ROSA26 Cre reporter strain. Nat Genet. 1999;21:70–71. doi: 10.1038/5007. [DOI] [PubMed] [Google Scholar]
- Stewart C.L., Standish S.M. Osteoarthritis of the TMJ in teenaged females report of cases. J Am Dent Assoc. 1983;106:638–640. doi: 10.14219/jada.archive.1983.0108. [DOI] [PubMed] [Google Scholar]
- Tanaka E., Detamore M.S., Mercuri L.G. Degenerative disorders of the temporomandibular joint etiology, diagnosis, and treatment. J Dent Res. 2008;87:296–307. doi: 10.1177/154405910808700406. [DOI] [PubMed] [Google Scholar]
- Tsutsui T.W., Riminucci M., Holmbeck K., Bianco P., Robey P.G. Development of craniofacial structures in transgenic mice with constitutively active PTH/PTHrP receptor. Bone. 2008;42:321–331. doi: 10.1016/j.bone.2007.09.057. [DOI] [PMC free article] [PubMed] [Google Scholar]
- Viguet-Carrin S., Garnero P., Delmas P.D. The role of collagen in bone strength. Osteoporos Int. 2006;17:319–336. doi: 10.1007/s00198-005-2035-9. [DOI] [PubMed] [Google Scholar]
- Wadhwa S., Kapila S. TMJ disorders future innovations in diagnostics and therapeutics. J Dent Educ. 2008;72:930–947. [PMC free article] [PubMed] [Google Scholar]
- Wang L., Lazebnik M., Detamore M.S. Hyaline cartilage cells outperform mandibular condylar cartilage cells in a TMJ fibrocartilage tissue engineering application. Osteoarthritis Cartilage. 2009;17:346–353. doi: 10.1016/j.joca.2008.07.004. [DOI] [PubMed] [Google Scholar]


