Abstract
The aim of present study was to investigate myostatin gene polymorphism and its association with yearling weight records in Zel sheep using PCR-RFLP and PCR-SSCP methods. Blood samples were collected from 200 Zel sheep, randomly, and DNA was extracted using modified salting out method. Polymerase chain reaction was carried out to amplify 337, 222, and 311 bp fragments, respectively, comprising a part of exon 3, intron 1, and intron 2 of myostatin gene. In addition, exon 3 was digested by HaeIII enzyme under RFLP method, and introns 1 and 2 were studied using SSCP. Under RFLP method, all samples showed mm genotype. Under SSCP method, intron 1 was also monomorph but intron 2 was polymorph (AA, AB, and BB). The allelic frequencies for A and B were 75.5 and 24.5%, respectively. This locus was not in Hardy-Weinberg equilibrium (P < 0.05), and there was no significant effect of myostatin gene on yearling weights.
1. Introduction
Considerable progress in farm animal breeding has been made in the last few decades, but achieving greater understanding in the improvement of meat quality was very slow before molecular markers became an accessible technology with wide applications in breeding methods [1].
Meat quality is one of the important economic traits in domestic animals. Determination of meat quality requires analysis and classification of fat content, composition, tenderness, water-holding capacity, color, oxidative stability, and uniformity. Meat quality is affected by several factors such as breed, genotype, feeding, fasting, preslaughter handling, stunning, slaughter methods chilling, and storage conditions [2].
Finding of main genes responsible for meat quality will benefit the producers. In recent years, a lot of works have been performed in this field to find potential genes or chromosome regions associated with the meat quality traits in different farm animals, including cattle, sheep, and chicken. Myostatin (MSTN) or growth differentiation factor-8 (GDF-8) is a member of the mammalian growth transforming family (TGF-beta superfamily), which plays an important role in the regulation of embryonic development and tissue homeostasis in adults [3]. They are known to block myogenesis, hematogenesis and enhance chondrogenesis as well as epithelial cell differentiation in vitro. In mice, null mutants are significantly larger than wild-type animals, with 200–300% more skeletal-muscle mass, because of hyperplasia and hypertrophy [4]. Muscular hypertrophy (mh), also known as “double-muscling” in cattle, has been recognized as a physiological character for years [5] and is seen in Belgian Blue and Piedmontese cattle [6]. These animals had less bone, less fat, and 20% more muscle on an average [7]. Mutations within myostatin gene were red to muscular hypertrophy allele (mh allele) in the double muscle breeds [6]. Such a major effect of a single gene on processing yields opened a potential channel for improving processing yields of animals using knockout technology [8]. Therefore, considering of myostatin gene in farm animals is important to find better animal which opens interesting prospects for future selection programs, especially marker-assistant selection for economic traits.
In Iran, sheep meat is a major source of animal protein and investigation for meat quality and related genes is important. Zel sheep is a native Iranian meat breed and plays a great role in sheep rearing activities in the north of Iran [9]. The aim of present study was to identify genotypes of myostatin gene and their association with yearling weight records in Zel sheep using PCR-RFLP and PCR-SSCP methods in order to find effective alleles influencing meat quantity and quality traits in sheep.
2. Materials and Methods
2.1. Animals and DNA Extraction
Blood samples were randomly collected from 200 (190 ewes and 10 rams) Zel sheep (there were 230 ewes and 30 rams in this station) from Shirang's Zel Breeding Station in Fazel Abad city of Golestan province. DNA was extracted from 3 mL of blood as described by Miller et al. [10]. Quality and quantity of DNA were measured by visual and spectrophotometer methods.
2.2. PCR
Two pairs of primers were designed for each of intron 1 and 2 and exon 3 regions. The primer sequences are presented in Table 1. An aliquot of 100 ng genomic DNA was amplified in a total volume of 15 μL PCR mix. The PCR mix consisted of 7.5 μL Master mix (Cinna clon), 2 μL forward and reverse primers (10 pmol/μL), and 4.5 μL ddH2O. Amplification conditions are shown in Table 2.
Table 1.
Region, methods, primer's sequence (5'→3'), and length of PCR products of the ovine myostatin gene.
| Region | Using method | Primer's sequence (5'→3') | Length of fragment (bp) |
|---|---|---|---|
| Intron 1 | PCR-SSCP | F: TAC CTT CAT CAC TCT GCC TTC C | 222 |
| R: GGA GGA AAG AAG AGG GAC AAG | |||
| Intron 2 | PCR-SSCP | F: CAC ATT TTT CCC CCA GAA GAG | 311 |
| R: AAG ACA GTT CAG AAA ATA GCT GG | |||
| Exon 3 | PCR-RFLP | F: CCG GAG AGA CTT TGG GCT TGA | 337 |
| R: TCA TGA GCA CCC ACA GCG GTC |
F: forward and R: reverse.
Table 2.
PCR conditions.
| Location | Primary denaturation in 1st cycle | Denaturation | Annealing | Elongation | Final extension | Number of cycles | |||
|---|---|---|---|---|---|---|---|---|---|
| °C/Sec | °C | Sec | °C | Sec | °C | Sec | °C/Sec | n | |
| Intron 1 | 95/240 | 94 | 60 | 56.5 | 70 | 72 | 75 | 72/600 | 40 |
| Intron 2 | 95/240 | 95 | 50 | 55 | 60 | 72 | 75 | 72/600 | 40 |
| Exon 3 | 94/240 | 94 | 60 | 58.5 | 60 | 72 | 120 | 72/240 | 35 |
In every experiment, negative controls were used, aiming to avoid contaminations. Assays were performed in a thermal cycler (Personal Cycler-Biometra, CA, German), and the amplicons were analyzed by 1.5% agarose gel electrophoresis. The gels were stained with ethidium bromide and visualized under ultraviolet light.
2.3. Digestion Reaction
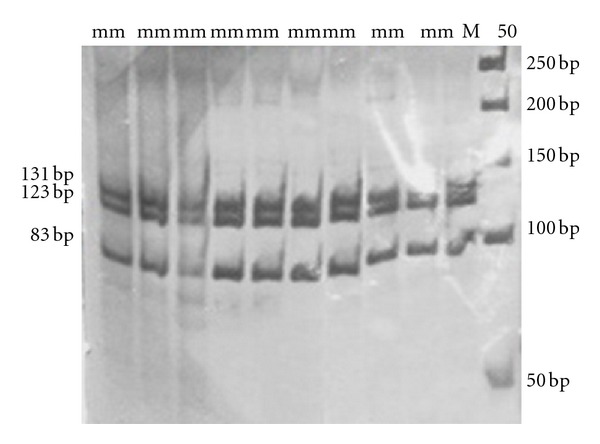
10 μL of PCR products were incubated for 10 h at 37°C with 1 μL (10 units) of HaeIII enzyme for myostatin gene (just for exon 3, using RFLP method). Digestion products were separated by electrophoresis on 8% nondenaturing polyacrylamide gels, stained by silver nitrate staining method [11] (Figure 3).
Figure 3.

Restriction patterns of 337 bp fragments of exon 3 after digesting with HaeIII on 8% nondenatured polyacrylamide gel after silver nitrate staining. Molecular marker was M50.
2.4. SSCP
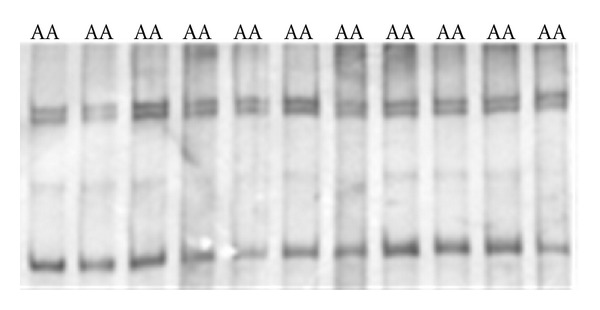
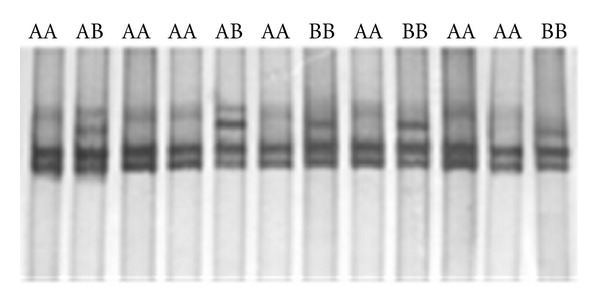
Genotyping of intron 1 and 2 was performed by PCR-SSCP method. PCR products (3 μL) were diluted with 13 μL of running buffer (including 800 μL formamide 99%, 100 μL loading dye, 100 μL glycerol 98%, 3 μL 0.5M EDTA, and 2 μL 10M NaOH). After heating at 95°C for 5 min, they were immediately placed on ice for 10 min. Polymorphisms were detected using 10% nondenaturing polyacrylamide gels (Figures 1 and 2). The mixture was electrophoresed for 4 h at 250 V and 10°C. DNA fragments were visualized using the silver nitrate staining method [11].
Figure 1.

The SSCP patterns of intron 1 (222 bp), on 10% nondenatured polyacrylamide gel after silver nitrate staining.
Figure 2.

The SSCP patterns of intron 2 (311 bp), on 10% nondenatured polyacrylamide gel after silver nitrate staining. Three patterns demonstrating the 3 genotypes are presented.
2.5. Statistical Analysis
Calculation of genotypes, alleles frequencies, mean expected and observed heterozygosities, and Chi-square test was performed using PopGene32 (ver. 1.32) [12]. Samples, which were born in 2006, 2007, and 2008 years, were used for statistical analysis. Yearling weight (YW) was analyzed using the fixed model of SAS [13] software and by GLM procedure by the following statistical model:
| (1) |
where Y ijkl is yearling weight of each animal; μ is general mean; S i is sex effect ( i = 1, and 2), D j is birth year effect ( j = 1, 2, and 3), Gk is genotype effect ( k = 1, 2, and 3), e ijkl is random error.
3. Results
3.1. Exon 3
A 337 bp fragment for exon 3 of MSTN locus was amplified. HaeIII restriction enzyme was used to digest the PCR products. The HaeIII digests the m allele but not M allele. Digestion of the m allele produced three fragments of 83, 123, and 131 bp (Figure 3). All samples were digested by HaeIII enzyme and showed the mm genotype. As a result, all of them were monomorph (Figure 1).
3.2. Intron 1 and 2
Intron 1 and 2 of myostatin gene with 222 and 311 bp lengths were amplified, respectively. Under the SSCP analysis, different conformations were detected by electrophoresis on 12% nondenaturing polyacrylamide gel (Figure 2). Results showed that intron 1 of this gene was also monomorph, and all samples showed the homozygote genotype (Figure 1). Different conformations were found in intron 2, and A and B alleles were detected with frequencies of 75.5 and 24.5%, respectively. In this population, this locus did not show Hardy-Weinberg equilibrium (P < 0.05) (Table 3). Observed heterozygosity for this locus was very low (0.04) showing high level of homozygosity in the herd. Results showed that there was no significant effect of genotypes of myostatin gene on yearling weights (P > 0.05) (Table 4). However, sex had significant effect on YW (P < 0.01). Yearling weight least squares means of males (31.62 ± 1.34 kg) were more than females (25.21 ± 0.57 kg).
Table 3.
Allele and genotype frequencies, observed, expected, and average heterozygosity for intron 2 of MSTN gene.
| Locus | Allelic frequencies (%) | Genotype frequencies (%) | Heterozygosity | χ 2 | |||||
|---|---|---|---|---|---|---|---|---|---|
| A | B | AA | AB | BB | Obs. | Exp. | Ave. | ||
| Intron 2 | 75.5 | 24.5 | 73.5 | 4 | 22.5 | 0.04 | 0.37 | 0.37 | 160.55∗ |
*P < 0.05.
Table 4.
Least square means (LSM), standard error (SE), and probability levels for YW (kg) of intron 2 of MSTN genotypes.
| Probability levels | Genotype | LSM∗ ± SE | ||
|---|---|---|---|---|
| AA | AB | BB | ||
| — | 0.9539 | 0.6367 | AA | 28.30a ± 0.72 |
| 0.9539 | — | 0.7397 | AB | 27.85a ± 1.61 |
| 0.6367 | 0.7397 | — | BB | 29.09a ± 0.84 |
∗Same letters in column show no significant difference (P > 0.05).
4. Discussion
Results showed polymorphism in intron 2, but intron 1 and exon 3 were monomorph. On the contrary, Soufy et al. [14, 15] observed polymorphism for exon 3 in Sanjabi sheep and native Kermanian cattle. Intron 1 was also monomorph, and all samples showed the homozygote genotype. On the other hand, intron 2 was polymorphic and three different genotypes were detected. Three different conformational patterns (AA, AB, and BB) were determined with frequencies of 73.5, 4, and 22.5%. The allelic frequencies for A and B were as 75.5 and 24.5%, respectively. Similar result was observed in Iranian Baluchi sheep [16, 17]. This inconsistency may be ascribed to breed differences, population and sampling size, environmental factors, mating strategies, geographical position effect, and frequency distribution of genetic variants.
Statistical analysis showed that myostatin locus had no significant effect on YW (P > 0.05). Similar to these findings, Masoudi et al. [17] did not report any significant effect of this locus on YW. Although, they found significant effect of different genotypes on birth weight, they also did not observe any significant effect on weaning and six month weights. Ansary et al. [16] detected significant effect of different genotypes on daily gain from birth to 3 month of age (P < 0.01). This may be due to the environmental effects that exist and affect this trait. It must be pointed that mutation in intron region is classified as a silent mutation and in spite of existence of mutation in this gene any associations is not reported. However, there are reports of diseases caused by silent mutations. It also seems that introns have a role in the expression of gene and necessitate for physical instructors of DNA. But they do not have a major role in rank of amino acids and proteins' instructor [18].
In this population, this locus did not show Hardy-Weinberg equilibrium. This confirmed that factors leading to disequilibrium, especially selection, may affect the genetic structure of the population. Based on our results, the investigated population showed a low degree of genotypic variability for the MSTN gene. This may be explained by the conservation and breeding strategies, which have been carried out. In recent years, in this station, only a few rams have been used as sires in breeding plans. Due to small effective population size, inbreeding was high, and, as a consequence, heterozygosity and genetic variability were low. Controlled breeding might help in lowering inbreeding. In spite of low variability for genomic DNA, these data provide evidence that Iranian's Zel sheep breed have a polymorphism in intron 2 for myostatin locus. However, results showed that this locus in this population may not be useful for developing future selection programs, especially marker-assistant selection for improving weight gain and meat traits.
It can be concluded that, although MSTN polymorphism did not have effect on YW, further analysis needs to be conducted on the effect of MSTN genotypes on yearling weight and other body weights. Furthermore, results showed that PCR-RFLP and PCR-SSCP are appropriate tools for evaluating genetic variability.
Acknowledgments
This work was financially supported by the Jahad-e-Agriculture (Golestan and I.R. Iran). The authors also acknowledge the staffs of Shirang Research Station for their helping to provide blood samples.
References
- 1.Gao Y, Zhang R, Hu X, Li N. Application of genomic technologies to the improvement of meat quality of farm animals. Meat Science . 2007;77(1):36–45. doi: 10.1016/j.meatsci.2007.03.026. [DOI] [PubMed] [Google Scholar]
- 2.Rosenvold K, Andersen HJ. Factors of significance for pork quality - A review. Meat Science . 2003;64(3):219–237. doi: 10.1016/S0309-1740(02)00186-9. [DOI] [PubMed] [Google Scholar]
- 3.Sonstegard TS, Rohrer GA, Smith TPL. Myostatin maps to porcine chromosome 15 by linkage and physical analyses. Animal Genetics . 1998;29(1):19–22. doi: 10.1046/j.1365-2052.1998.00229.x. [DOI] [PubMed] [Google Scholar]
- 4.McPherron AC, Lawler AM, Lee SJ. Regulation of skeletal muscle mass in mice by a new TGF-β superfamily member. Nature . 1997;387(6628):83–90. doi: 10.1038/387083a0. [DOI] [PubMed] [Google Scholar]
- 5.Arthur PF. Double muscling in cattle: a review. Australian Journal of Agricultural Research . 1995;46:1493–1515. [Google Scholar]
- 6.Kambadur R, Sharma M, Smith TPL, Bass JJ. Mutations in myostatin (GDF8) in double-muscled Belgian Blue and Piedmontese cattle. Genome Research . 1997;7(9):910–916. doi: 10.1101/gr.7.9.910. [DOI] [PubMed] [Google Scholar]
- 7.Kobolak J, Gocza E. The role of the myostatin protein in meat quality—a review. Archives Animal Breeding . 2002;45(2):159–170. [Google Scholar]
- 8.Kocabas AM, Kucuktas H, Dunham RA, Liu Z. Molecular characterization and differential expression of the myostatin gene in channel catfish (Ictalurus punctatus) Biochimica et Biophysica Acta - Gene Structure and Expression . 2002;1575(1–3):99–107. doi: 10.1016/s0167-4781(02)00289-0. [DOI] [PubMed] [Google Scholar]
- 9.Mason IL. A World Dictionary of Livestock Breeds, Types and Varieties . 4th edition. Oxford, UK: C.A.B International; 1996. [Google Scholar]
- 10.Miller SA, Dykes DD, Polesky HF. A simple salting out procedure for extracting DNA from human nucleated cells. Nucleic Acids Research . 1988;16(3):p. 1215. doi: 10.1093/nar/16.3.1215. [DOI] [PMC free article] [PubMed] [Google Scholar]
- 11.Benbouza H, Jacquemin JM, Baudin JP, Mergeai G. Optimization of a reliable, fast, cheap and sensitive silver staining method to detect SSR markers in polyacrylamide gels. Biotechnology, Agronomy, Society and Environment . 2006;10(2):77–81. [Google Scholar]
- 12.Yeh FC, Yang R, Boyle TJ, Ye Z, Xiyan JM. POPGENE 32, Microsoft Window-based Freeware for Population Genetic Analysis, Version 1.32 . Edmonton, Canada: Molecular Biology and Biotechnology Centre, University of Alberta; 2000. [Google Scholar]
- 13.SAS Institute. SAS User’s Guide, Version 8.2 . Cary, NC, USA: SAS Institute; 2001. [Google Scholar]
- 14.Soufy B, Mohammadabadi MR, Shojaeyan K, et al. Evaluation of Myostatin gene polymorphism in Sanjabi sheep by PCR-RFLP method. Animal Science Reserches . 2009;19(1):81–89. [Google Scholar]
- 15.Soufy B, Shojaeian K, Abadi MM, Zadeh BA, Mohamadi A. Myostatin gene polymorphism in native kermanian cattle using molecular marker. Proceedings of the 6th National Biotechnology Congress of Iran; August 2009; Tehran, Iran. Milad Tower Conference Hall; [Google Scholar]
- 16.Ansary M, Tahmoorespour M, Valeh MV, Nassiry MR, Shahroudi FE. Investigation of polymorphism of GDF-8 gene and its association with average daily gain in Baluchi sheep. Proceedings of the 3th Congress on Animal Science; 2008; Mashhad, Iran. Ferdowsi University of Mashhad; [Google Scholar]
- 17.Masoudi A, Hemrani H, Abbasi A, et al. Using PCR-SSCP techniques to study polymorphism of myostatin gene and its association with production traits in Baluchi sheep. Proceedings of the 4th National Biotechnology Congress of Iran; August 2005; Kerman, Iran. [Google Scholar]
- 18.Matthews HR, Freedland R, Miesfeld RL. Biochemistry a Short Course . Hoboken, NJ, USA: Wileyliss, Inc.; 1997. [Google Scholar]


