

Abstract
Little is known about the effects of aging, the strongest risk factor for Parkinson’s disease (PD), on glial responses to dopamine (DA) neuron degeneration in midbrain subregions that display selective vulnerability to degeneration. We evaluated the impact of aging on astrocytes and microglia in a regionally specific manner in a monkey model of PD. 1-Methyl-4-phenyl-1,2,3,6-tetrahydropyridine (MPTP) was delivered unilaterally via the internal carotid artery of young, middle-aged, and old-aged rhesus monkeys. Astrocytes and microglia were identified using glial fibrillary acidic protein and human leukocyte antigen-DR (HLA-DR) immunolabeling, respectively. Glial reactivity was assessed using (1) stereological cell counting, (2) fluorescence intensity, and (3) a morphology rating scale. In the midbrain contralateral and ipsilateral to the MPTP injection, astrocyte number and intensity did not change with age. In both sides of the midbrain, cellular morphology suggested astrocyte hypertrophy in middle-age dissipated in old-age, irrespective of DA subregion and regional differences in vulnerability to degeneration. In the contralateral midbrain, microglia became mildly activated (increased cell number and intensity, and morphological changes) with advancing age. Inflammation was evident at 3 months postlesion by severe microglial activation in the ipsilateral midbrain. HLA-DR fluorescence intensity and an abundance of activated microglia (based on morphological criteria) were consistently exacerbated in the vtSN of both sides of the midbrain. These results suggest the glial responses accompanying aging and DA neuron degeneration following a toxic insult represent persistent alterations in the microenvironment of surviving DA neurons that are important factors in understanding regional differences in susceptibility to degeneration.
Keywords: Parkinson’s disease, MPTP, aging, animal model, nonhuman primate, nigra, VTA, glia
INTRODUCTION
In Parkinson’s disease (PD), regional differences in susceptibility to degeneration exist among midbrain dopamine (DA) neurons (Damier et al., 1999; Fearnley and Lees, 1991; Gibb and Lees, 1991). DA neurons in the ventral tier of the substantia nigra (vtSN) are most vulnerable to degeneration, while the dorsal tier of the substantia nigra (dtSN) and ventral tegmental area (VTA) are relatively resistant to degeneration. Similar regional differences in susceptibility to degeneration have been noted following administration of 1-methyl-4-phenyl-1,2,3,6-tetrahydropyridine (MPTP) in nonhuman primates (German et al., 1988; Kitt et al., 1986; Schneider et al., 1987). The underlying causes of the regional differences remain unknown.
Aging is the strongest risk factor for developing PD, and age-related changes suggest nigrostriatal system dysfunction occurs during normal aging. In some studies, regional patterns of age-related changes are similar to the patterns seen in PD (Chu and Kordower, 2007; Emborg et al., 1998; Gerhardt et al., 2002; Irwin et al., 1994; Kanaan et al., 2007; McCormack et al., 2004). Despite similarities between aging and PD, it remains unclear whether they are linked by shared cellular mechanisms of DA neuron vulnerability. By tracking regional changes in response to MPTP during the aging process, the factors involved in selective vulnerability and resistance to degeneration can be studied. In turn, further understanding these factors may provide important information on the development of PD.
An important component of PD pathogenesis is the response of the glial environment to DA neuron degeneration (Teismann and Schulz, 2004). In humans and non-human primates exposed to MPTP, reactive astrocytes are seen in the substantia nigra (SN) 1–16 years following the initial insult (Barcia et al., 2004; Langston et al., 1999). The biological significance of this astrocyte reaction is unclear. Evidence suggests that midbrain astrocytes can act as a source of neuroprotection through antioxidant and neurotrophic mechanisms (Damier et al., 1993; Lin et al., 1993). Few studies have assessed region-specific responses of astrocytes to DA neuron degeneration in the human and nonhuman primate midbrain (Barcia et al., 2004; Damier et al., 1993), and none have evaluated the influence of advancing age at the time of DA neuron loss on these responses.
Microglial responses in specific midbrain subregions, and the influences of aging on these responses, likely play an important role in the selective vulnerability of DA neurons. While the timing of microglial activation in the etiology and progression of PD remains unclear, experimental findings indicate microglial activation can play a pivotal role in DA neuron degeneration (Hunot and Hirsch, 2003; Kim and Joh, 2006). Numerous studies have shown that microglial activation and increased levels of proinflammatory cytokines are prominent features in the SN of PD patients (Boka et al., 1994; Hirsch et al., 1998; Imamura et al., 2003; Mogi et al., 1994, 2000) and many animal models of PD (Akiyama and McGeer, 1989; Castano et al., 1998; McGeer et al., 2003). Induction of inflammation results in DA neuron loss (Castano et al., 1998), and inhibiting microglial activation enhances DA neuron survival (Castano et al., 2002; Du et al., 2001; Wu et al., 2002). Sugama et al. (2003), demonstrated that MPTP administration in mice causes exaggerated microglial activation in the SN of aged animals compared with young animals, which was associated with greater DA neuron loss. However, the microglial response in specific midbrain DA subregions following MPTP administration in aging nonhuman primates has not been studied.
This study tested the hypothesis that glial responses to DA neuron degeneration are exacerbated with advancing age at the time of MPTP exposure. Furthermore, we tested the hypothesis that in response to DA neuron degeneration, glial changes are differentially expressed in regional patterns consistent with an involvement in resistance or vulnerability to degeneration among ventral midbrain DA neuron populations. MPTP exposure resulted in enhanced glial reactivity in all ages and all DA subregions, which was still evident 3 months post-MPTP. Astrocyte changes were not consistently altered in a regional pattern suggestive of a prominent role in the vulnerability of DA neurons to degeneration. Changes in microglia suggest an exaggerated inflammatory state preferentially displayed in the vulnerable vtSN region. Following MPTP exposure, the vtSN exhibits a significant degree of ongoing inflammation 3 months after the initial insult, which may enhance DA neuron vulnerability in this region to additional insults.
MATERIALS AND METHODS
Animals and MPTP Administration
Young (8–9 years, n = 4), middle-aged (14–17 years, n = 5), and old-aged (26.5–31 years, n = 5) female rhesus monkeys (Macaca mulatta) were used as described previously (Collier et al., 2007). All monkeys were born in captivity and ages are based on birth records. All animals were kept in individual primate cages throughout their lives. Each animal was unilaterally treated with MPTP (Sigma Chemicals, St. Louis, MO) via intracarotid artery injections following a previously published protocol (Emborg et al., 2001). To maintain aging as a primary endpoint, and not aging-related changes in sensitivity to MPTP, the MPTP dose was adjusted downward in aged subjects and all animals were treated until a common behavioral endpoint, complete disuse of the contralateral forelimb, developed. The first dose was 3.5 mg/kg for animals weighing ≥7 kg, 3.0 mg/kg for animals weighing ≤7 kg, and 2.3 mg/kg for animals >17 years of age. Some young and middle-aged animals had to be retreated one time with 2.0 mg/kg to achieve complete disuse of the contralateral forelimb. This study was approved by the Institutional Animal Care and Use Committees of Rush University Medical Center and the Biological Research Laboratory at the University of Illinois at Chicago. All laws and regulations outlined in the National Institutes of Health, United States Public Health Service Guide for the Care and Use of Laboratory Animals were adhered to during the project.
Tissue Collection and Preparation
The tissue analyzed was from a set of animals previously studied for changes in striatal neurotrophic activity (Collier et al., 2005), SN cell counts, and DA biochemistry (Collier et al., 2007). Tissue was collected at a single time point, three months post-MPTP, to study persistent changes that may better model the chronic condition in PD patients. The brains were removed and immersion fixed in 4% paraformaldehyde and then cryoprotected in 30% sucrose. The tissue was cut through the coronal plane into 50-μm-thick sections. All analyses were performed in the midbrain (vtSN, dtSN, and VTA) contralateral and ipsilateral to the MPTP injection. The contralateral midbrain is representative of changes associated with the normal aging process and/or minimal exposure to MPTP. Confirming this contention, our previous stereological cell counts of tyrosine hydroxylase (TH)-positive neurons in the contralateral midbrain (Collier et al., 2007) do not differ from those obtained previously from untreated age-matched animals (Kanaan et al., 2007). The ipsilateral midbrain is representative of changes occurring after significant DA neuron degeneration (Collier et al., 2007). The anatomical subregions have been described in detail previously (Kanaan et al., 2007). The sections were between the caudal edges of the mammillary bodies (rostrally) and the decussation of the superior cerebellar peduncle (caudally). For the vtSN, the cerebral peduncle was the ventral and lateral boundary, the lateral border of the third cranial nerve rootlets was the medial boundary, and the superior edge of the densocellular area was the dorsal boundary. The dtSN was defined by the dorsal border of the vtSN ventrally, the lateral border of the third cranial nerve rootlets and medial lemniscus medially, and the red nucleus and medial lemniscus dorsally. The VTA was defined by the interpeduncular nucleus ventrally, the midline medially, and the extent of the third cranial nerve rootlets dorsally and laterally.
Antibodies
Astrocytes, microglia, and DA neurons were identified using the following primary antibodies, respectively: rabbit anti-cow glial fibrillary acidic protein (GFAP) antibody (Dako, Z0334, lot 00015316), mouse anti-human B-lymphocyte clone LN-3 IgG2b antibody (HLA-DR; MP Biomed, 693031, lot R13319), and mouse anti-TH IgG1 antibody (Chemicon, MAB318, lot 24120307). The rabbit anti-cow GFAP polyclonal antibody was generated against GFAP isolated from cow spinal cord, the mouse anti-human B-lymphocyte clone LN-3 monoclonal antibody recognizes nonpolymorphic HLA-DR (Ia-like) antigen, and the TH antibody was raised against TH purified from pheochromocytoma-12 cells. GFAP is considered as one of the best markers for identifying astrocytes (Pekny and Nilsson, 2005), and HLA-DR is a class II major histocompatability complex glycoprotein commonly used with human and monkey tissue to identify activated microglia presumably with the ability to present antigens (Aloisi, 2001; Hurley et al., 2003). Mouse anti-TH has been described in detail previously (Kanaan et al., 2007).
The HLA-DR and TH antibodies are different IgG isotypes, and thus, isotype-specific secondary antibodies were used. The specificity of the isotype-specific antibodies was determined using mismatched secondary anti-bodies. Pairing the IgG2b primary antibody with IgG1 secondary antibody, and pairing the IgG1 primary antibody with IgG2b secondary produced no staining (data not shown). The lack of cross-reactivity confirmed the specificity of the isotype-specific secondary antibodies.
GFAP and HLA-DR Immunohistochemistry
For cell counting and morphological rating, a 1-in-12 series of tissue was processed for GFAP (astrocytes) or HLA-DR (microglia) immunohistochemistry using a similar protocol to those previously published (Kanaan et al., 2006, 2007). Briefly, tissues were sequentially incubated in 0.6% H2O2, blocking solution, and primary antibody solution for 72 h at 4°C (astrocytes: rabbit anti-GFAP primary antibody at 1:50,000; microglia: mouse anti-HLA-DR primary antibody at 1:200), biotinylated goat anti-rabbit secondary antibody (astrocytes, 1:400; Vector, BA1000) or biotinylated goat anti-mouse secondary antibody (microglia, 1:400; Vector, BA-9200), and avidin–biotin complex solution (Vector, PK-6100). All tissue was simultaneously reacted with 3,3-diaminobenzidine tetra-hydrochloride (Sigma, D5637) enhanced with 2% nickel ammonium sulfate (Fisher, N48-500). Once mounted on microscope slides, the sections were processed for a Nissl counterstain using 1% cresyl violet.
Stereology
The numbers of GFAP-positive astrocytes and HLA-DR-positive microglia were estimated in the vtSN, dtSN, and VTA of young, middle-aged, and old-aged MPTP-lesioned monkeys using stereological cell counting techniques. The optical fractionator probe was used to estimate total number of glia in each region of the contra-lateral and ipsilateral midbrain following the same method as described previously (Kanaan et al., 2007). For astrocytes, ~1%, 9%, and 4% of the area was sampled for cell counting in the vtSN, dtSN, and VTA (both ipsilateral and contralateral), respectively. Coefficients of error (CE) were calculated using the Gundersen method to estimate the accuracy of optical fractionator results (Gundersen et al., 1999; West and Gundersen, 1990). CEs for astrocyte cell counts were between 0.12 and 0.04. For microglia, ~3%, 18%, and 7% of the area was sampled in the contralateral vtSN, dtSN, and VTA, respectively. For the ipsilateral midbrain, ~1%, 9%, and 3% of the area was sampled in the vtSN, dtSN, and VTA, respectively. CEs for microglia cell counts were between 0.29 and 0.04. The estimated total numbers of glial cells were used for statistical comparisons between age groups within each DA subregion, and the glial cell density (estimated cell number/mm3) was used for comparisons between DA subregions within each age group.
Morphology Rating of Astrocytes and Microglia
Morphological characteristics of astrocytes and microglia are correlated with functional states ranging from “resting” to “activated” (Pekny and Nilsson, 2005; Streit et al., 1999). Tissue labeled with GFAP immunohistochemistry was used to determine the degree of astrocyte activation with a qualitative rating scale for the morphology in each DA subregion. A (−) rating indicates the presence of resting astrocytes characterized by little cytoplasmic staining and fine lightly stained fibers (Fig. 1A). A (+) rating indicates the majority of astrocytes exhibit intermediate levels of hypertrophy characterized by increased cytoplasmic staining and thicker more darkly stained processes (Fig. 1B). A (++) rating indicates the presence of numerous astrocytes in a fully hypertrophic state characterized by an enlarged cell body, strong cytoplasmic staining, and thick, short, strongly labeled processes (Fig. 1C).
Fig. 1.

Three distinct astrocyte morphology ratings were seen using GFAP immunohistochemistry. (A) A (−) rating indicates the majority of astrocytes were in a resting state, with fine long fibers and low levels of GFAP-immunoreactivity (arrow). (B) A (+) rating indicates the majority of astrocytes were mildly hypertrophic, which was marked by increased cytoplasmic immunoreactivity and thickened processes (arrow). (C) A (++) rating indicates the majority of astrocytes were fully activated, exhibiting strongly immunoreactive enlarged cell bodies with shortened processes (arrow). Ratings are indicated in the parentheses. Scale bar = 25 μm in C.
Tissue labeled with HLA-DR immunohistochemistry was used to determine the degree of microglial activation with a qualitative rating scale for the morphology in each DA subregion. A (−) rating indicates the presence of resting microglia with little to no cytoplasmic staining and numerous fine lightly stained fibers (Fig. 2A). Microglia in a “hyperramified” state are believed to represent an intermediate stage of activation and are characterized by a ramified morphology similar to resting microglia, but with increased HLA-DR-immunoreactivity. A (+) rating indicates the presence of numerous hyperramified microglia and a few microglia exhibiting signs of advanced activation (Fig. 2B). In advanced stages of activation, microglia take on a macrophage-like morphology with larger cell bodies that are intensely immunoreactive and few short, thick, and strongly labeled processes. Additionally, advanced stages of activation are associated with the presence of multicellular clusters. A (++) rating indicates the presence of numerous hyperramified microglia in addition to the emergence of many fully activated microglia morphologies (Fig. 2C). Lastly, a (+++) rating indicates the vast majority of microglia exhibit morphological characteristics consistent with advanced stages of activation (Fig. 2D).
Fig. 2.

Four distinct microglia morphology ratings were observed using HLA-DR immunohistochemistry. (A) A (−) rating indicates the presence of resting microglia characterized by little cytoplasmic staining and fine processes (arrow). (B) A (+) rating indicates microglia were primarily hyperramified, exhibiting increased cytoplasmic staining and more intensely labeled highly branched fibers (arrow). (C, D) Advanced stages of activation include macrophage-like morphologies characterized by intense staining in enlarged cell bodies and short, thick fibers (arrow in C and D). Multicellular clusters (groups of numerous activated microglia) were found in advanced stages of activation (white asterisk in D). A (++) rating indicates numerous hyperramified microglia and multiple microglia in the advanced stages of activation (C). A (+++) rating indicates that the majority of microglia were in advanced stages of activation (D). Scale bar = 50 μm in D.
Semiquantitative Immunofluorescence Intensity
The relative intensity of GFAP and HLA-DR fluorescence was determined in a 1-in-24 series of tissue stained using triple-label immunofluorescence for GFAP, HLA-DR, and TH. TH was used to delineate midbrain subregions. Tissue sections were sequentially incubated in: blocking serum for 1 h, primary antibody solution for 72 h at 4°C, and secondary antibody solution for 1 h. The primary antibody solution consisted of rabbit anti-GFAP (1:2,000), mouse anti-HLA-DR (1:100; IgG2b), and mouse anti-TH (1:1,400; IgG1). The secondary antibody solution consisted of goat anti-rabbit IgG conjugated with Alexa Fluor® 555 (GFAP), goat anti-mouse IgG2b conjugated with Alexa Fluor® 488 (HLA-DR), and goat anti-mouse IgG1 conjugated with Alexa Fluor® 647 (TH) antibodies diluted 1:400. The sections were mounted on a microscope slide and autofluorescence was blocked using autofluorescent eliminator reagent (Chemicon, 2160) following a previously published protocol (Kanaan et al., 2007).
Relative GFAP and HLA-DR fluorescence intensity was quantified using a three-laser scanning Olympus confocal microscope equipped with Fluoview version 4.3 software (Olympus America) and argon and helium/neon ion lasers. HLA-DR was detected using excitation of 488 nm and an emission filter of 505–525 nm. GFAP was detected using excitation of 543 nm and an emission filter of 560–600. TH was detected using excitation of 633 nm and an emission filter of 660-infared. Autofluorescence did not contribute to the fluorescence as it was effectively blocked (as described earlier), which was confirmed in control sections (data not shown).
Images for measuring regional levels of GFAP fluorescence were taken at 10× magnification, an image resolution of 1,024 × 768, and saved in the multi-tiff format in Fluoview. Images for measuring HLA-DR fluorescence in individual microglia were taken at 20× magnification. Higher magnification was needed to visualize resting microglia. Sections throughout the rostralcaudal extent of the SN were used for analysis. All confocal settings (e.g., photomultiplier, gain, offset, laser intensity, confocal aperture, scan speed) were identical between animals and use of the sequential scan mode ensured fluorophore crossover did not occur. ImageJ version 1.36b software (National Institutes of Health, Bethesda, MD) was used to measure average pixel intensity. This analysis measures average pixel intensity ranging from 0 (black) to 4,095 (white). Background levels of staining were determined in areas of the cerebral peduncle where no staining was present (“blank” areas between glial cell bodies and fibers). Background levels were subtracted from the measurements made in the vtSN, dtSN, and VTA.
Statistics
All data were analyzed using nonparametric statistical tests. For comparisons between age groups, the Kruskal–Wallis one-way analysis of variance (ANOVA) on ranks test was used. Comparisons between the contralateral and ipsilateral midbrain of MPTP-lesioned animals were done using the Wilcoxon Signed Rank test. To determine correlations with chronological age, the Spearman rank correlation test was used. For comparisons between DA subregions within each age group, the Friedman repeated measure ANOVA on ranks test was used. The Dunn’s method was used for post hoc comparisons when a significant main effect was reached. A P ≤ 0.05 was considered statistically significant. All statistics were done using SigmaStat version 3.0.1 software (SPSS, Chicago, IL).
RESULTS
Aging and the Response of Astrocytes to MPTP in the Midbrain
Astrocyte number was highest in the dtSN of the contralateral midbrain
Stereological cell counting was used to determine whether astrocyte numbers change in the contralateral midbrain of young, middle-aged, and old-aged monkeys. When numbers of astrocytes were compared across age groups using ANOVA on rank tests, no significant differences were found (Fig. 3A; P > 0.05). Similarly, when correlation analyses were used to determine the association between astrocyte number and advancing chronological age no significant correlations were detected in any DA subregion (P > 0.05). Astrocyte cell density was highest in the dtSN, which reached significance compared with the vtSN in all age groups (P < 0.05; Fig. 3A). Thus, in the contralateral midbrain, the number of astrocytes was not significantly different between animals of different ages, and the dtSN had the highest cell density of astrocytes.
Fig. 3.

In both sides of the midbrain, the dtSN had the highest cell density of GFAP-positive astrocytes. (A) In all three age groups, astrocyte cell density was greatest in the contralateral dtSN compared with the contralateral vtSN (#, P < 0.05). (B) In the ipsilateral midbrain, astrocyte cell density was significantly greater in the dtSN compared with the VTA in aged animals (#, P < 0.05). No age-related differences in astrocyte number were found in any region of the contralateral (A) and ipsilateral (B) midbrain.
Astrocyte number was highest in the dtSN of the ipsilateral midbrain
The responses of astrocytes in the ipsilateral midbrain were similar to the age-related and region-specific changes in the contralateral midbrain. The numbers of astrocytes were not significantly different between age groups (P > 0.05; Fig. 3B). Similarly, the number of astrocytes was not significantly correlated with advancing chronological age in any DA subregion (P > 0.05). All subregions had similar astrocyte cell density, except in old-aged animals in which astrocyte cell density in the dtSN was significantly greater than in the VTA (P < 0.05; Fig. 3B). These data demonstrate that the numbers of astrocytes were not significantly different in the ipsilateral midbrain 3 months post-MPTP exposure in young, middle-aged, and old-aged animals, but the dtSN had the highest cell density of astrocytes.
Regional GFAP fluorescence was greatest in the VTA of the contralateral midbrain
To further assess changes in astrocytes, the intensity of regional GFAP fluorescence was measured in the contralateral midbrain of young, middle-aged, and old-aged monkeys. GFAP fluorescence was not significantly different between age groups (P > 0.05; Fig. 4A). Similarly, GFAP fluorescence was not significantly correlated with advancing chronological age in any DA subregion (P > 0.05). In the VTA, GFAP fluorescence was greatest, which reached statistical significance compared with the dtSN in all age groups (P < 0.05; Fig. 4A). The photomicrographs illustrate differences in GFAP fluorescence between the contralateral dtSN and VTA of an old-aged monkey (Fig. 4A′,A″). Increased GFAP fluorescence was mostly attributable to increased GFAP-positive fibers in the vtSN and VTA compared with the dtSN. Of note, the dtSN had the highest cell density of astrocytes (Fig. 3A), while the VTA had the greatest GFAP fluorescence (Fig. 4A–A″). This was due to the greater amount of GFAP-positive fibers in the neuropil of the VTA region (Fig. 4A′,A″). Thus, GFAP fluorescence was unaltered with increasing age, and greater in the contralateral VTA compared with the dtSN.
Fig. 4.

In both sides of the midbrain, regional GFAP fluorescence intensity was greatest in the VTA. (A) In all three age groups, the VTA had significantly greater GFAP fluorescence intensity compared with the dtSN (*P < 0.05). (B) GFAP fluorescence intensity in the VTA was significantly greater compared with the dtSN only in aged animals (*P < 0.05). (A′, A″, B′, B″) The photomicrographs illustrate greater GFAP fluorescence in the VTA (A″ and B″) compared with the dtSN (A′, B′) of the contralateral (A′, A″) and ipsilateral (B′, B″) midbrain in an old-aged animal. Scale bar = 50 μm in A″ and B″.
Regional GFAP fluorescence was greatest in the VTA of the ipsilateral midbrain
Astrocyte responses in the ipsilateral midbrain were similar to the age-related and region-specific responses in the contralateral midbrain. GFAP levels were not significantly different between age groups (P > 0.05; Fig. 4B). Similarly, advancing chronological age at the time of MPTP exposure was not significantly correlated with changes in GFAP fluorescence (P > 0.05). In old-aged animals, GFAP fluorescence in the VTA was significantly greater compared with the dtSN (P < 0.05; Fig. 4B). In young and middle-aged animals, all three regions exhibited similar fluorescence intensity (P > 0.05). The photomicrographs illustrate GFAP fluorescence between the dtSN and VTA (Fig. 4B′,B″) in the ipsilateral midbrain of an old-aged MPTP-lesioned monkey. Similar to the contralateral midbrain, the ipsilateral dtSN had the greatest cell density of astrocytes (Fig. 3B), while the VTA had the highest level of GFAP fluorescence (Fig. 4B–B″). Again, this was mostly attributable to more GFAP-positive fibers in the VTA (Fig. 4B′,B″). Thus, GFAP fluorescence in the VTA was greater than the dtSN. Regardless of the age at the time of MPTP exposure, GFAP fluorescence was not significantly changed in the midbrain at 3 months post-MPTP.
Astrocyte hypertrophy occurs in the midbrain of middle-aged monkeys
A qualitative rating scale was used to determine morphological responses of GFAP-positive astrocytes in the midbrain 3 months after MPTP exposure in young, middle-aged, and old-aged animals (Table 1). Astrocyte morphology was relatively consistent across the three DA subregions on both sides of the midbrain in young, middle-aged, and old-aged animals 3 months after MPTP exposure. Three distinct ratings were noted (Fig. 1A–C). An age-related inverted U-shaped relationship was apparent in the morphological changes on both sides of the midbrain.
TABLE 1.
Morphological Rating of GFAP-Positive Astrocytes in Contralateral and Ipsilateral Midbrain 3 Months After Unilateral MPTP Infusion in Young, Middle-Aged, and Old-Aged Monkeys
| Age group | Animal no. | Age (years) | Regions
|
|||||
|---|---|---|---|---|---|---|---|---|
| vtSN
|
dtSN
|
VTA
|
||||||
| C | I | C | I | C | I | |||
| Young | 6965 | 8 | − | + | − | + | − | + |
| 6966 | 8 | + | ++ | + | ++ | + | ++ | |
| 7009 | 8 | − | + | − | + | − | + | |
| 7086 | 10 | − | + | − | + | − | + | |
| Middle | 6339 | 14 | ++ | ++ | ++ | ++ | ++ | ++ |
| 6327 | 17 | + | ++ | + | ++ | + | ++ | |
| 6337 | 17 | + | ++ | + | ++ | + | ++ | |
| 7010 | 17 | − | + | − | + | − | + | |
| 7014 | 17 | − | ++ | − | + | − | + | |
| Old | 6254 | 27 | − | + | − | + | − | + |
| 6237 | 28 | − | + | − | + | − | + | |
| 6553 | 30 | + | ++ | − | + | − | + | |
| 6725 | 30 | − | + | − | + | − | + | |
| 6724 | 31 | + | ++ | + | ++ | + | ++ | |
C, contralateral midbrain; I, ipsilateral midbrain; (−) resting astrocytes, characterized by little cytoplasmic staining and long thin lightly moderately stained processes; (+) numerous astrocytes in an intermediate hypertrophic state, characterized by increased cytoplasmic staining and thicker darker processes; (++) the majority of astrocytes are in advanced stages of activation, characterized by increased cell body size with intense staining and shorter thick intensely stained processes.
In the contralateral midbrain, morphological changes in astrocytes were not robust with increasing age. The majority of young animals (3 of 4 animals) had astrocytes in a resting state, and only one animal had mildly hypertrophic astrocytes (Fig. 5A–A″). By middle-age, the majority of animals (3 of 5) had astrocytes that were mildly hypertrophic or fully activated (+ = 2 and ++ = 1), while only two had resting astrocytes (Fig. 5B–B″). Similar to young animals, the majority of old-aged animals had resting astrocytes (3–4 of 5 animals), and only 1–2 animals had mildly hypertrophic astrocytes (Fig. 5C–C″). Of note, only in a middle-aged animal were fully activated astrocytes observed.
Fig. 5.

In the contralateral midbrain, hypertrophy of GFAP-positive astrocytes occurs in middle-aged animals. (A–A″) The majority of vtSN (A), dtSN (A′), and VTA (A″) astrocytes in young monkeys were in the resting state. (B–B″) In middle-aged animals, astrocytes in the vtSN (B), dtSN (B′), and VTA (B″) undergo moderate hypertrophy. (C–C″) In aged animals, astrocytes in the vtSN (C), dtSN (C′), and VTA (C″) were in a resting state, similar to young monkeys. Closed arrows indicate GFAP-positive astrocytes and open arrows indicate cells in insets. Scale bar = 25 μm in C″.
In the ipsilateral midbrain, the inverted U-shaped relationship was maintained, but the degree of astrocyte activation was elevated (Table 1). In the majority of young animals, all subregions contained mildly hypertrophic astrocytes (3 of 4 animals), while only one animal had fully activated astrocytes (Fig. 6A–A″). The majority of old-aged animals had mildly hypertrophic astrocytes (3–4 of 5 animals), while 1–2 animals had fully activated astrocytes (Fig. 6C–C″). In contrast, the majority of middle-aged animals (3–4 of 5 animals) had fully activated astrocytes, while only 1–2 animals had mildly reactive astrocytes (Fig. 6B–B″). Thus, MPTP exposure was associated with an exacerbation of age-related astrocyte morphological changes, and middle-aged animals had the most reactive astrocytes. Interestingly, these changes had persisted for 3 months following the MPTP insult.
Fig. 6.

In the ipsilateral midbrain, hypertrophy of GFAP-positive astrocytes occurs in middle-aged animals at 3 months post-MPTP. (A–A″) In young animals, astrocytes exhibit intermediate degrees of reactivity in the vtSN (A), dtSN (A′), and VTA (A″). (B–B″) In the vtSN (B), dtSN (B′), and VTA (B″) of middle-aged animals, astrocytes exhibit morphological characteristics consistent with both intermediate and advanced degrees of activation. (C–C″) By old-age, astrocytes have undergone changes back to intermediate levels of reactivity in the vtSN (C), dtSN (C′), and VTA (C″), similar to young animals. Closed arrows indicate GFAP-positive astrocytes and open arrows indicate cells in insets. Scale bar = 25 μm in C″.
Comparisons between astrocytes in the contralateral and ipsilateral midbrain of MPTP-lesioned monkeys
To determine whether there were differences in astrocytes between the contralateral and ipsilateral midbrain of aging MPTP-lesioned monkeys, the cell number, fluorescence intensity, and morphological rating data were compared. There were no comparisons of cell number or GFAP fluorescence intensity that reached statistical significance between the contralateral and ipsilateral midbrain in any age group or any DA subregion (data not shown).
Aging and the Response of Microglia to MPTP in the Midbrain
Aging was associated with increased numbers of microglia in the contralateral midbrain
Stereological cell counting was used to determine whether the number of microglia changes in DA subregions of the contralateral and ipsilateral midbrain in aging MPTP-lesioned monkeys. When comparisons between age groups were performed using ANOVA on ranks tests, old-aged animals had significantly increased numbers of microglia compared with young animals in all subregions of the contralateral midbrain (P < 0.05; Fig. 7A). Similarly, correlation analyses revealed a significant association between advancing chronological age and increased numbers of microglia in all subregions of the contralateral midbrain (P < 0.05). In old-aged animals, the contralateral dtSN had significantly greater microglia cell density than the VTA (P < 0.05). No other regional differences were found in any age group (Fig. 7A). Thus, with increasing age, the number of microglia increased in all DA subregions of the contralateral midbrain at 3 months post-MPTP.
Fig. 7.

Aging was associated with increased numbers of HLA-DR-positive microglia throughout the contralateral midbrain, but not ipsilateral midbrain. (A) In the contralateral midbrain, old-aged animals had significantly increased cell density of microglia in all subregions (#, P < 0.05). (B) In the ipsilateral midbrain, no differences in microglia cell density were seen between any of the age groups. In both sides of the midbrain in old-aged animals, the dtSN had significantly greater microglia cell density compared with the VTA (A and B; *P < 0.05), but no other differences were seen between DA subregions.
Aging was not associated with increased numbers of microglia in the ipsilateral midbrain
The number of microglia was not significantly different between age groups in the ipsilateral midbrain (P > 0.05; Fig. 7B). Similarly, advancing chronological age at the time of MPTP exposure was not significantly correlated with microglia number in any DA subregion (P > 0.05). After MPTP exposure in old-aged animals, the dtSN had a significantly greater microglia cell density compared with the VTA (P < 0.05). No other regional differences were found in any age group (Fig. 7B). Thus, in the ipsilateral midbrain 3 months post-MPTP exposure, the number of microglia was similar regardless of age at the time of MPTP exposure.
In the contralateral midbrain, HLA-DR fluorescence intensity was increased in aged animals and was greatest in the vtSN
To further assess changes in microglia, HLA-DR fluorescence intensity was measured in the midbrain of young, middle-aged, and old-aged monkeys. In the contralateral midbrain, comparisons between age groups revealed significantly greater HLA-DR intensity in dtSN and VTA microglia of old-aged animals compared with those in young animals (P < 0.05; Fig. 8A). In the vtSN, a trend toward increased intensity was found (P = 0.08). Similarly, in all three DA subregions advancing chronological age was significantly correlated with increased HLA-DR intensity (P < 0.05; Supplemental Fig. 1A–C). In young and old-aged animals, HLA-DR intensity in vtSN microglia was significantly greater than the intensity in microglia of the dtSN (P < 0.05; Fig. 8A). The photomicrographs illustrate the increased intensity of microglia in the aged vtSN compared with microglia in the dtSN of aged animals (Fig. 8B′,B″). Thus, aged animals had increased HLA-DR intensity in microglia throughout DA midbrain subregions in the contralateral midbrain, and microglia intensity in the vtSN is greater than the dtSN.
Fig. 8.
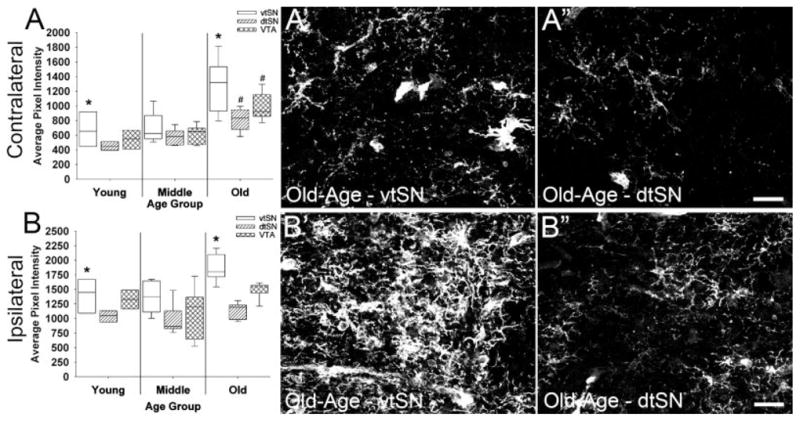
Aging was associated with increased HLA-DR fluorescence intensity in the contralateral midbrain, and vtSN microglia were most intense. (A) Microglia intensity was significantly greater in old-aged animals compared with young animals in the contralateral dtSN and VTA (#, P < 0.05), while a trend was noted in the vtSN (P = 0.08). In young and old-aged animals, vtSN microglia intensity was significantly greater than dtSN microglia intensity (*P < 0.05). (B) In young and old-aged monkeys, vtSN microglia were more intense when compared with dtSN microglia in the ipsilateral hemisphere. No differences in microglia intensity were seen between age groups; however, advancing chronological age was significantly correlated with increased intensity specifically in the vtSN (see Supplemental Fig. 1). (A′, A″, B′, B″) The images depict increased HLA-DR intensity in vtSN microglia (A′ and B′) compared with dtSN microglia (A″ and B″) of the contralateral (A′ and A″) and ipsilateral (B′ and B″) midbrain in an old-aged animal. Scale bars = 50 μm in A″ and B″.
In the ipsilateral midbrain, HLA-DR fluorescence intensity was increased in aged animals specifically in the vtSN
HLA-DR fluorescence intensity was similar between young, middle-age, and old-age groups in all DA subregions (P > 0.05; Fig. 8B). Correlation analyses demonstrated that, advancing chronological age was significantly correlated with increased HLA-DR intensity specifically in the ipsilateral vtSN (P < 0.05; Supplemental Fig. 1D–F), not the dtSN and VTA (P > 0.05). In young and old-aged animals, HLA-DR intensity in vtSN microglia was significantly greater than HLA-DR intensity in microglia of the dtSN (P < 0.05; Fig. 8B). The photomicrographs depict greater HLA-DR intensity in the ipsilateral midbrain of aged vtSN microglia compared with dtSN microglia (Fig. 8B′,B″). Thus, only in the ipsilateral vtSN did microglia continue to show significant increases in HLA-DR intensity with advancing age at the time of MPTP exposure.
Microglia in the aged vtSN exhibited the most severe degree of activation following MPTP exposure
To further evaluate the degree of reactivity in HLA-DR-positive microglia, as indicated by morphological changes, the morphology of microglia was qualitatively rated (Table 2). Four distinct morphological ratings were seen in the midbrains of MPTP-lesioned animals (Fig. 2A–D). In general, microglia morphology shifted from resting to more activated morphologies with increasing age at the time of MPTP exposure throughout both sides of the midbrain (Figs. 9,10).
TABLE 2.
Morphological Rating of HLA-DR-Positive Microglia in the Contralateral and Ipsilateral Midbrain 3 Months After Unilateral MPTP Infusion in Young, Middle-Aged, and Old-Aged Monkeys
| Age group | Animal no. | Age (years) | Regions
|
|||||
|---|---|---|---|---|---|---|---|---|
| vtSN
|
dtSN
|
VTA
|
||||||
| C | I | C | I | C | I | |||
| Young | 6965 | 8 | − | ++ | − | ++ | − | ++ |
| 6966 | 8 | − | + | − | + | − | ++ | |
| 7009 | 8 | − | ++ | − | + | − | + | |
| 7086 | 10 | − | +++ | − | +++ | − | +++ | |
| Middle | 6339 | 14 | + | ++ | − | ++ | − | + |
| 6327 | 17 | ++ | ++ | + | ++ | + | ++ | |
| 6337 | 17 | + | +++ | + | +++ | + | ++ | |
| 7010 | 17 | + | + | + | + | + | + | |
| 7014 | 17 | − | ++ | − | + | − | + | |
| Old | 6254 | 27 | + | ++ | + | ++ | + | ++ |
| 6237 | 28 | ++ | +++ | + | + | + | ++ | |
| 6553 | 30 | ++ | +++ | + | ++ | + | ++ | |
| 6725 | 30 | + | +++ | + | ++ | + | ++ | |
| 6724 | 31 | +++ | +++ | + | ++ | + | ++ | |
C, contralateral midbrain; I, ipsilateral midbrain; (−) resting microglia with little to no cytoplasmic immunoreactivity and few lightly stained fine fibers; (+) numerous hyperramified microglia, characterized by increased cytoplasmic immunoreactivity and numerous highly branched fibers with moderate levels of staining, but no or few microglia with morphologies of advanced activation; (++) numerous hyperramified microglia and fully activated microglia, characterized by shortened thicker processes, increased cell body size, and strong immunoreactivity, in addition to the emergence of multicellular clusters; (+++) vast majority of microglia are in advanced stages of activation, which includes macrophage-like morphology and numerous multicellular clusters.
Fig. 9.

In the contralateral midbrain, morphological changes were consistent with moderate microglial activation, which was exacerbated in the vtSN. (A–A″) In young MPTP-lesioned monkeys, vtSN (A), dtSN (A′), and VTA (A″) microglia exhibited resting morphological characteristics. (B–B″) In middle-aged animals, microglia in the vtSN (B), dtSN (B′), and VTA (B″) primarily exhibited hyperramified morphology, and one animal contained numerous fully activated vtSN microglia. (C–C″) In aged animals, microglia generally exhibited hyperramified morphologies with the presence of some fully activated microglia in the vtSN. Only in the vtSN of an aged animal was the majority of microglia exhibiting characteristics of advanced activation. Closed arrows indicate HLA-DR-positive microglia and open arrows indicate cells in insets. Scale bar = 25 μm in C″.
Fig. 10.

Three months after MPTP exposure, microglia throughout the ipsilateral midbrain exhibit ongoing activation, and the vtSN was most severely affected. (A–B″) In young and middle-aged animals, vtSN (A, B), dtSN (A′, B′), and VTA (A″, B″) microglia in the ipsilateral midbrain exhibited the entire range of morphologies. Only in one young and one middle-aged animal was the majority of microglia fully activated. (C–C″) In aged animals, the majority of microglia exhibited a significant degree of ongoing reactivity as evidenced by morphologies of advanced activation in the vtSN (C). In four out of five aged animals, the majority of microglia were in advanced stages of activation. The dtSN (C′) and VTA (C″) microglia exhibit both hyperramified and fully activated morphologies. Closed arrows indicate microglia and open arrows indicate cells in insets. Scale bar = 25 μm in C″.
In the contralateral midbrain of young animals, all DA subregions contained resting microglia (4 of 4 animals; Fig. 9A–A″). In middle-aged animals, microglia in the dtSN and VTA were resting (1 of 5 animals) and mildly reactive (4 animals), while no animals contained fully activated microglia. In contrast, microglia in the vtSN of one middle-aged animal exhibited characteristics of advanced activation, while three animals had mildly reactive microglia and one animal contained resting microglia (Fig. 9B–B″). In all old-aged animals, microglia were no longer resting, but had become mildly reactive in the dtSN and VTA (5 of 5 animals). In the vtSN, one of five old-aged animals had mostly fully activated microglia, two had mildly reactive and some fully activated microglia, and two animals had mildly reactive microglia (Fig. 9C–C″). Of note, only in the vtSN of an aged animal was the most advanced rating seen.
In the ipsilateral midbrain, microglia in young animals (Fig. 10A–A″) exhibited the full range of morphologies (one animal: mildly reactive; two animals: mildly reactive with some fully activated; one animal: fully activated). Microglia in middle-aged monkeys (Fig. 10B–B″) exhibited the full range of morphologies (one animal: mildly reactive; three animals: mildly reactive with some fully activated; one animal: fully activated). In old-aged animals (Fig. 10C–C″), the majority of vtSN microglia were fully activated (4 of 5 animals), while only one animal had mildly reactive and some fully activated microglia. In contrast, dtSN and VTA microglia were mildly reactive with the presence of some fully activated microglia (5 of 5 animals). Notably, changes in microglia morphology occurred in all DA subregions, but the vtSN microglia consistently exhibited more activated morphological characteristics compared with dtSN and VTA microglia. Thus, MPTP exposure at increasing ages resulted in increased microglial activation (as indicated by morphology) at 3 months after the MPTP insult, an effect that was exacerbated in the vulnerable vtSN region in both sides of the midbrain.
Differences between microglia in the contralateral and ipsilateral midbrains of MPTP-lesioned monkeys
Microglia number, HLA-DR fluorescence intensity, and microglia morphology data from the contralateral and ipsilateral midbrain were compared. There were no differences in microglia number or staining intensity between sides of the midbrain in any age group or DA subregion (data not shown). As expected, in response to MPTP on the ipsilateral midbrain, microglia exhibited more reactive morphology than those in the contralateral midbrain (Table 2, Figs. 9 and 10). Moreover, the vtSN was most severely affected in all treatment groups. In the ipsilateral midbrain of MPTP-lesioned animals the vast majority of microglia were fully activated (Table 2, Figs. 9 and 10). Thus, the ipsilateral midbrain usually exhibited signs of greater inflammation (microglia number, HLA-DR intensity, and morphology) compared with the contralateral midbrain, but these differences did not reach statistical significance.
DISCUSSION
Age-Related and Region-Specific Responses of Midbrain Astrocytes After MPTP Exposure
In PD patients, there is variable astrocyte activation. Some cases lack signs of astrocyte reactivity, while others show mild degrees of activation, and still others show a severe degree of activation (Damier et al., 1993; Forno et al., 1992; Mirza et al., 2000). Studies of humans and nonhuman primates exposed to MPTP typically find reactive astrocytes in the SN from 1 to 16 years after MPTP exposure (Barcia et al., 2004; Langston et al., 1999). In agreement with persistent and relatively mild astrocyte activation in nonhuman primates exposed to MPTP, morphological changes in astrocytes were still evident 3 months after MPTP exposure in our monkeys. In the contralateral midbrain, the degree of activation and inverted U-shaped relationship between young, middle-aged, and old-aged animals was consistent with our data from aging naive control animals (personal communication). In the ipsilateral midbrain, astrocytes followed the same inverted U-shape relationship between age groups, but the degree of astrocyte activation, as assessed by morphology, was elevated. In contrast, no age-related changes in astrocyte number or GFAP fluorescence were detected in either side of the midbrain in animals unilaterally treated with MPTP. It must be acknowledged that the inverted U-shaped relationship is based on the ratings of the majority of animals in each age group; however, not all animals in each age group support this relationship. Inter-animal variability is to be expected and may be exaggerated with the low subject numbers associated with nonhuman primate studies. However, the overall relationship suggests an interesting change occurs in middle-aged animals. Numerous studies have demonstrated that astrocyte activation can be transient after a toxic insult or injury, peaking within 1 week and largely subsiding by ~1 month in rodent models (Gordon et al., 1997; Pasinetti et al., 1999; Schauwecker et al., 1998; Stromberg et al., 1986). Perhaps 3 months after MPTP exposure in non-human primates, astrocytes continue to express activated morphologies, while significant changes in astrocyte number and GFAP fluorescence have subsided.
In general, we did not detect consistent regional differences in ongoing astrocyte reactivity after MPTP suggestive of an involvement in regional differences in susceptibility to degeneration. Of note, there was one finding that suggested astrocytes may be involved in the resistance of dtSN neurons to degeneration. The dtSN had the greatest cell density of astrocytes, but the intensity of regional GFAP fluorescence was lowest in the dtSN. This discrepancy was clearly a result of more GFAP-positive fibers in the vtSN and VTA compared with the dtSN. The functional implications of greater astrocyte cell density in the dtSN await further investigation. Our findings are somewhat different from those of Barcia et al. (2004), who stereologically quantified the number of GFAP-positive astrocytes 1 year after chronic MPTP administration in a small set of adult cynomolgus monkeys. Astrocyte cell density in the α and β SN regions (similar to our vtSN) was significantly increased compared with control animals, but there was no change in the γ SN region (similar to our dtSN). Our finding of minimal regional differences indicates astrocytes in DA subregions mostly respond in a similar fashion regardless of whether the DA neurons in the region are more or less vulnerable to degeneration.
Whether astrocyte activation represents a neuroprotective or neurodestructive event is not entirely clear. Astrocytes have been implicated in mediating neurotoxic cascades after proinflammatory cytokine exposure (Chao et al., 1996; Hua et al., 2002; Jana et al., 2005). However, evidence suggests astrocytes can act as a source of neuroprotection in the midbrain through production of antioxidants, anti-inflammatory cytokines, and trophic factors (Nagatsu and Sawada, 2005; Teismann and Schulz, 2004). It is of interest that with advancing age, middle-aged monkeys in this study exhibit increased activation of astrocytes that may potentially contribute to a compensatory response to age-related degenerative changes. In the oldest animals, astrocyte activation is lost, potentially reflecting exhaustion of this defense mechanism. In the future, the cytokine/trophic factor profile of reactive astrocytes in specific DA subregions and the effects age at the time of MPTP exposure have on cytokine/trophic factor production will be important in understanding the functional implications of the observed changes in astrocytes.
Age-Related and Region-Specific Responses of Midbrain Microglia After MPTP Exposure
Microglial activation is believed to act primarily as a neurodestructive process. However, an appreciation for neuroprotective roles is becoming more prominent and the protective or destructive effects of activation are most likely context dependent (e.g., acute versus chronic inflammation) (van Rossum and Hanisch, 2004; Vilhardt, 2005). For example, microglia can produce neurotrophic factors, and may play a role in synaptic/axonal plasticity after neuronal injury (Batchelor et al., 1999; Cullheim and Thams, 2007). On the other hand, numerous reports have demonstrated that activation of microglia and the production of proinflammatory cytokines and free radicals by activated microglia may be harmful to neurons (Kim and Joh, 2006). Our microglia data are consistent with the presence of a chronic inflammatory state in DA midbrain subregions 3 months after MPTP exposure in aging animals. Microglial activation is well established as a prominent feature in PD, and is suspected to play a role in PD pathogenesis (Hirsch et al., 1998; McGeer et al., 1988). It remains unclear how the age at the onset of PD affects glial pathology in humans. However, it is known that late-onset PD follows a more malignant time course compared with early-onset PD (Eshius and Leenders, 2001). One factor involved in the more rapid progression in aged patients could be related to the presence of ongoing age-related inflammation, and the exacerbated response to DA neuron degeneration by vtSN microglia in aged animals. Future studies are necessary to confirm this hypothesis.
Our HLA-DR fluorescence intensity and morphology data demonstrate that microglia in the vulnerable vtSN region are more severely affected by MPTP exposure compared with those in the relatively resistant dtSN and VTA regions. In contrast, HLA-DR-positive microglia cell number does not seem to differ between the vtSN, dtSN, or VTA. Work in animal models of PD consistently shows that DA neuron degeneration is associated with robust microglial activation (Akiyama and McGeer, 1989; Castano et al., 1998; McGeer et al., 2003), but few studies have directly evaluated differences between DA subregions. In animal models, it seems that microglial activation does not strictly adhere to regional boundaries after exposure to toxic insults (Barcia et al., 2004; Hurley et al., 2003). Similar to our results, Barcia et al. (2004) have shown that the number of microglia was increased in the α and β subregions (similar to our vtSN) and γ subregion (similar to our dtSN) of the midbrain 1 year after chronic MPTP exposure in adult cynomolgus monkeys. By mapping HLA-DR-positive microglia and rating their level of reactivity, Hurley et al. (2003) described a disconnection between DA neurodegeneration and the regional pattern of microglial activation following MPTP exposure in adult monkeys. In sites of both degeneration (SN) and little or no degeneration (VTA and both segments of the globus pallidus), there was an increase in the presence of activated microglia. In contrast, other degeneration sites (putamen and caudate) had little microglial activation. Similarly, our microglia number data was not different between DA subregions; however, we did find HLA-DR intensity and morphological differences in microglia that suggests microglia are more reactive to MPTP in the vtSN.
An important component of microglial activation in PD is the production of various proinflammatory cytokines (Nagatsu and Sawada, 2005). Numerous proinflammatory cytokines are dramatically increased in the SN, striatum, and cerebrospinal fluid of PD patients (Hunot and Hirsch, 2003; Nagatsu and Sawada, 2005; Teismann and Schulz, 2004). Increased production of proinflammatory cytokines in microglia could participate in DA neuron degeneration (Teismann and Schulz, 2004). Thus, our data suggest an ongoing age-related chronic inflammatory state in the midbrain, which is particularly prevalent in the vtSN after MPTP exposure, may play a role in the enhanced susceptibility of vtSN DA neurons. Moreover, persistence in microglial activation will most likely increase future sensitivity of remaining DA neurons. Since aged vtSN microglia are most activated this region would be particularly vulnerable to future insults. Again, understanding the region-specific cytokine profile and how age at the time of DA neuron degeneration influences microglial cytokine production is crucial in further understanding the implications of microglial responses to degeneration.
MPTP Animal Model Considerations
Certain caveats associated with the current experimental design must be considered (Collier et al., 2007). First, our results may be specific to nonhuman primates, and the findings are limited by the low number of animals. To this end, statistically significant differences likely reflect large changes, but subtle changes, which could have biological relevance, may remain undetected. Second, unilaterally lesioned animals provide an opportunity for comparison between the midbrain contralateral (“intact”) to the MPTP injection and the ipsilateral side (“lesioned”). The contralateral side likely represents changes primarily associated with normal aging, and/or a response to minimal toxin exposure. In contrast, the ipsilateral side represents responses to severe DA neuron degeneration. It remains controversial whether the contralateral midbrain is completely unaffected by unilateral intracarotid delivery of MPTP, but it is generally agreed upon that contralateral effects occur with increasing doses of MPTP (Bankiewicz et al., 1986; Guttman et al. 1990; Joyce et al., 1986; Oiwa et al., 2003). Our doses of MPTP are considered on the low end of the spectrum. Our previous report of stereological cell counts of TH-positive SN neurons in many of the same subjects studied here confirm that the contralateral midbrain of our monkeys had neuron numbers equivalent to those counted in untreated age-matched animals (Collier et al., 2007; Kanaan et al., 2007). Thirdly, sacrificing animals 3 months after onset of behavioral impairment was chosen to evaluate responses in the nigrostriatal system at a time point when DA neuron degeneration was stable. This approach potentially models patients of different ages with symptomatic parkinsonism. Unfortunately, we are unable to determine the short-term responses in the nigrostriatal system after MPTP exposure. In addition, we are unable to determine whether glial activation occurs prior to or after DA neuron degeneration. Lastly, the measures used in the current study do not allow a definitive determination of whether glia are acting in pro- or anti-inflammatory capacities or whether the state of activation has reached a threshold capable of causing DA neuron degeneration. Future studies will be necessary to determine these important aspects of glial activation.
CONCLUSIONS
The current study is the first to describe the influence of advancing age at the time of MPTP exposure on region-specific responses of glial cells in the midbrain of nonhuman primates. Patterns of astrocyte responses in the vtSN, dtSN, and VTA of the contralateral midbrain in aging animals exposed to MPTP were remarkably similar to those in normal aging. In the ipsilateral midbrain, astrocytes exhibit slightly increased hypertrophy that has persisted for 3 months after MPTP. In contrast, changes in microglia suggest the aged system shows the greatest response to similar extents of MPTP lesion (as defined behaviorally). In the vulnerable vtSN, microglia are chronically undergoing activation, which as expected, is most pronounced in the midbrain ipsilateral to MPTP exposure. The patterns of age-related changes in astrocyte morphology after MPTP exposure suggests astrocytes in aged animals are not hypertrophic. At this same time microglia exhibit signs of persistent severe activation, which may be a result of inadequate compensatory responses in the astrocyte population. Taken together these results suggest the glial response, particularly that of microglia, is an important factor in understanding regional differences in DA neuron degeneration and the persistent changes in the microenvironment around surviving DA neurons. It is becoming increasingly clear that DA neuron degeneration is a multifaceted phenomenon composed of numerous interconnected factors, and the responses of glial cells to degeneration are among these factors.
Supplementary Material
Acknowledgments
The authors thank Brian Daley for his technical assistance.
Grant sponsor: NIH; Grant number: AG17092; Grant sponsor: University of Cincinnati.
Footnotes
This article contains supplementary material available via the Internet at http://www.interscience.wiley.com/jpages/0894-1491/suppmat.
References
- Akiyama H, McGeer PL. Microglial response to 6-hydroxydopamine-induced substantia nigra lesions. Brain Res. 1989;489:247–253. doi: 10.1016/0006-8993(89)90857-3. [DOI] [PubMed] [Google Scholar]
- Aloisi F. Immune function of microglia. Glia. 2001;36:165–179. doi: 10.1002/glia.1106. [DOI] [PubMed] [Google Scholar]
- Bankiewicz KS, Oldfield EH, Chiueh CC, Doppman JL, Jacobowitz DM, Kopin IJ. Hemiparkinsonism in monkeys after unilateral internal carotid artery infusion of 1-methyl-4-phenyl-1,2,3,6-tetrahydropyridine (MPTP) Life Sci. 1986;39:7–16. doi: 10.1016/0024-3205(86)90431-5. [DOI] [PubMed] [Google Scholar]
- Barcia C, Sanchez Bahillo A, Fernandez-Villalba E, Bautista V, Poza YPM, Fernandez-Barreiro A, Hirsch EC, Herrero MT. Evidence of active microglia in substantia nigra pars compacta of parkinsonian monkeys 1 year after MPTP exposure. Glia. 2004;46:402–409. doi: 10.1002/glia.20015. [DOI] [PubMed] [Google Scholar]
- Batchelor PE, Liberatore GT, Wong JY, Porritt MJ, Frerichs F, Donnan GA, Howells DW. Activated macrophages and microglia induce dopaminergic sprouting in the injured striatum and express brain-derived neurotrophic factor and glial cell line-derived neurotrophic factor. J Neurosci. 1999;19:1708–1716. doi: 10.1523/JNEUROSCI.19-05-01708.1999. [DOI] [PMC free article] [PubMed] [Google Scholar]
- Boka G, Anglade P, Wallach D, Javoy-Agid F, Agid Y, Hirsch EC. Immunocytochemical analysis of tumor necrosis factor and its receptors in Parkinson’s disease. Neurosci Lett. 1994;172:151–154. doi: 10.1016/0304-3940(94)90684-x. [DOI] [PubMed] [Google Scholar]
- Castano A, Herrera AJ, Cano J, Machado A. Lipopolysaccharide intranigral injection induces inflammatory reaction and damage in nigrostriatal dopaminergic system. J Neurochem. 1998;70:1584–1592. doi: 10.1046/j.1471-4159.1998.70041584.x. [DOI] [PubMed] [Google Scholar]
- Castano A, Herrera AJ, Cano J, Machado A. The degenerative effect of a single intranigral injection of LPS on the dopaminergic system is prevented by dexamethasone, and not mimicked by rh-TNF-alpha, IL-1beta and IFN-gamma. J Neurochem. 2002;81:150–157. doi: 10.1046/j.1471-4159.2002.00799.x. [DOI] [PubMed] [Google Scholar]
- Chao CC, Hu S, Sheng WS, Bu D, Bukrinsky MI, Peterson PK. Cytokine-stimulated astrocytes damage human neurons via a nitric oxide mechanism. Glia. 1996;16:276–284. doi: 10.1002/(SICI)1098-1136(199603)16:3<276::AID-GLIA10>3.0.CO;2-X. [DOI] [PubMed] [Google Scholar]
- Chu Y, Kordower JH. Age-associated increases of alpha-synuclein in monkeys and humans are associated with nigrostriatal dopamine depletion: Is this the target for Parkinson’s disease? Neurobiol Dis. 2007;25:134–149. doi: 10.1016/j.nbd.2006.08.021. [DOI] [PubMed] [Google Scholar]
- Collier TJ, Dung LZ, Carvey PM, Fletcher-Turner A, Yurek DM, Sladek JR, Jr, Kordower JH. Striatal trophic factor activity in aging monkeys with unilateral MPTP-induced parkinsonism. Exp Neurol. 2005;191 (Suppl 1):S60–S67. doi: 10.1016/j.expneurol.2004.08.018. [DOI] [PubMed] [Google Scholar]
- Collier TJ, Lipton J, Daley BF, Palfi S, Chu Y, Sortwell C, Bakay RA, Sladek JR, Jr, Kordower JH. Aging-related changes in the nigrostriatal dopamine system and the response to MPTP in nonhuman primates: Diminished compensatory mechanisms as a prelude to parkinsonism. Neurobiol Dis. 2007;26:56–66. doi: 10.1016/j.nbd.2006.11.013. [DOI] [PMC free article] [PubMed] [Google Scholar]
- Cullheim S, Thams S. The microglial networks of the brain and their role in neuronal network plasticity after lesion. Brain Res Rev. 2007;55:89–96. doi: 10.1016/j.brainresrev.2007.03.012. [DOI] [PubMed] [Google Scholar]
- Damier P, Hirsch EC, Agid Y, Graybiel AM. The substantia nigra of the human brain. II. Patterns of loss of dopamine-containing neurons in Parkinson’s disease. Brain. 1999;122:1437–1448. doi: 10.1093/brain/122.8.1437. [DOI] [PubMed] [Google Scholar]
- Damier P, Hirsch EC, Zhang P, Agid Y, Javoy-Agid F. Glutathione peroxidase, glial cells and Parkinson’s disease. Neuroscience. 1993;52:1–6. doi: 10.1016/0306-4522(93)90175-f. [DOI] [PubMed] [Google Scholar]
- Du Y, Ma Z, Lin S, Dodel RC, Gao F, Bales KR, Triarhou LC, Chernet E, Perry KW, Nelson DL, Luecke S, Phebus LA, Bymaster FP, Paul SM. Minocycline prevents nigrostriatal dopaminergic neurodegeneration in the MPTP model of Parkinson’s disease. Proc Natl Acad Sci USA. 2001;98:14669–14674. doi: 10.1073/pnas.251341998. [DOI] [PMC free article] [PubMed] [Google Scholar]
- Emborg ME, Ma SY, Mufson EJ, Levey AI, Taylor MD, Brown WD, Holden JE, Kordower JH. Age-related declines in nigral neuronal function correlate with motor impairments in rhesus monkeys. J Comp Neurol. 1998;401:253–265. [PubMed] [Google Scholar]
- Emborg ME, Shin P, Roitberg B, Sramek JG, Chu Y, Stebbins GT, Hamilton JS, Suzdak PD, Steiner JP, Kordower JH. Systemic administration of the immunophilin ligand GPI 1046 in MPTP-treated monkeys. Exp Neurol. 2001;168:171–182. doi: 10.1006/exnr.2000.7592. [DOI] [PubMed] [Google Scholar]
- Eshius SA, Leenders KL. Parkinson’s disease: Symptoms and age dependency. In: Hof PR, Mobbs CV, editors. Functional neurobiology of aging. San Diego: Academic Press; 2001. pp. 675–688. [Google Scholar]
- Fearnley JM, Lees AJ. Ageing and Parkinson’s disease: Substantia nigra regional selectivity. Brain. 1991;114:2283–2301. doi: 10.1093/brain/114.5.2283. [DOI] [PubMed] [Google Scholar]
- Forno LS, DeLanney LE, Irwin I, Di Monte D, Langston JW. Astrocytes and Parkinson’s disease. Prog Brain Res. 1992;94:429–436. doi: 10.1016/s0079-6123(08)61770-7. [DOI] [PubMed] [Google Scholar]
- Gerhardt GA, Cass WA, Yi A, Zhang Z, Gash DM. Changes in somatodendritic but not terminal dopamine regulation in aged rhesus monkeys. J Neurochem. 2002;80:168–177. doi: 10.1046/j.0022-3042.2001.00684.x. [DOI] [PubMed] [Google Scholar]
- German DC, Dubach M, Askari S, Speciale SG, Bowden DM. 1-Methyl-4-phenyl-1,2,3,6-tetrahydropyridine-induced parkinsonian syndrome in Macaca fascicularis: Which midbrain dopaminergic neurons are lost? Neuroscience. 1988;24:161–174. doi: 10.1016/0306-4522(88)90320-x. [DOI] [PubMed] [Google Scholar]
- Gibb WR, Lees AJ. Anatomy, pigmentation, ventral and dorsal subpopulations of the substantia nigra, and differential cell death in Parkinson’s disease. J Neurol Neurosurg Psychiatr. 1991;54:388–396. doi: 10.1136/jnnp.54.5.388. [DOI] [PMC free article] [PubMed] [Google Scholar]
- Gordon MN, Schreier WA, Ou X, Holcomb LA, Morgan DG. Exaggerated astrocyte reactivity after nigrostriatal deafferentation in the aged rat. J Comp Neurol. 1997;388:106–119. [PubMed] [Google Scholar]
- Gundersen HJ, Jensen EB, Kieu K, Nielsen J. The efficiency of systematic sampling in stereology—Reconsidered. J Microsc. 1999;193:199–211. doi: 10.1046/j.1365-2818.1999.00457.x. [DOI] [PubMed] [Google Scholar]
- Guttman M, Fibiger HC, Jakubovic A, Calne DB. Intracarotid 1-methyl-4-phenyl-1,2,3,6-tetrahydropyridine administration: biochemical and behavioral observations in a primate model of hemiparkinsonism. J Neurochem. 1990;54:1329–1334. doi: 10.1111/j.1471-4159.1990.tb01966.x. [DOI] [PubMed] [Google Scholar]
- Hirsch EC, Hunot S, Damier P, Faucheux B. Glial cells and inflammation in Parkinson’s disease: A role in neurodegeneration? Ann Neurol. 1998;44 (Suppl 1):S115–S120. doi: 10.1002/ana.410440717. [DOI] [PubMed] [Google Scholar]
- Hua LL, Zhao ML, Cosenza M, Kim MO, Huang H, Tanowitz HB, Brosnan CF, Lee SC. Role of mitogen-activated protein kinases in inducible nitric oxide synthase and TNFalpha expression in human fetal astrocytes. J Neuroimmunol. 2002;126:180–189. doi: 10.1016/s0165-5728(02)00055-3. [DOI] [PubMed] [Google Scholar]
- Hunot S, Hirsch EC. Neuroinflammatory processes in Parkinson’s disease. Ann Neurol. 2003;53 (Suppl 3):S49–S58. doi: 10.1002/ana.10481. [DOI] [PubMed] [Google Scholar]
- Hurley SD, O’Banion MK, Song DD, Arana FS, Olschowka JA, Haber SN. Microglial response is poorly correlated with neurodegeneration following chronic, low-dose MPTP administration in monkeys. Exp Neurol. 2003;184:659–668. doi: 10.1016/S0014-4886(03)00273-5. [DOI] [PubMed] [Google Scholar]
- Imamura K, Hishikawa N, Sawada M, Nagatsu T, Yoshida M, Hashizume Y. Distribution of major histocompatibility complex class II-positive microglia and cytokine profile of Parkinson’s disease brains. Acta Neuropathol (Berl) 2003;106:518–526. doi: 10.1007/s00401-003-0766-2. [DOI] [PubMed] [Google Scholar]
- Irwin I, DeLanney LE, McNeill T, Chan P, Forno LS, Murphy GM, Jr, Di Monte DA, Sandy MS, Langston JW. Aging and the nigrostriatal dopamine system: A non-human primate study. Neurodegeneration. 1994;3:251–265. [PubMed] [Google Scholar]
- Jana M, Anderson JA, Saha RN, Liu X, Pahan K. Regulation of inducible nitric oxide synthase in proinflammatory cytokine-stimulated human primary astrocytes. Free Radic Biol Med. 2005;38:655–664. doi: 10.1016/j.freeradbiomed.2004.11.021. [DOI] [PubMed] [Google Scholar]
- Joyce JN, Marshall JF, Bankiewicz KS, Kopin IJ, Jacobowitz DM. Hemiparkinsonism in a monkey after unilateral internal carotid artery infusion of 1-methyl-4-phenyl-1,2,3,6-tetrahydropyridine (MPTP) is associated with regional ipsilateral changes in striatal dopamine D-2 receptor density. Brain Res. 1986;382:360–364. doi: 10.1016/0006-8993(86)91345-4. [DOI] [PubMed] [Google Scholar]
- Kanaan NM, Collier TJ, Marchionini DM, McGuire SO, Fleming MF, Sortwell CE. Exogenous erythropoietin provides neuroprotection of grafted dopamine neurons in a rodent model of Parkinson’s disease. Brain Res. 2006;1068:221–229. doi: 10.1016/j.brainres.2005.10.078. [DOI] [PubMed] [Google Scholar]
- Kanaan NM, Kordower JH, Collier TJ. Age-related accumulation of Marinesco bodies and lipofuscin in rhesus monkey midbrain dopamine neurons: Relevance to selective neuronal vulnerability. J Comp Neurol. 2007;502:683–700. doi: 10.1002/cne.21333. [DOI] [PubMed] [Google Scholar]
- Kim YS, Joh TH. Microglia, major player in the brain inflammation: Their roles in the pathogenesis of Parkinson’s disease. Exp Mol Med. 2006;38:333–347. doi: 10.1038/emm.2006.40. [DOI] [PubMed] [Google Scholar]
- Kitt CA, Cork LC, Eidelberg F, Joh TH, Price DL. Injury of nigral neurons exposed to 1-methyl-4-phenyl-1,2,3,6-tetrahydropyridine: A tyrosine hydroxylase immunocytochemical study in monkey. Neuroscience. 1986;17:1089–1103. doi: 10.1016/0306-4522(86)90079-5. [DOI] [PubMed] [Google Scholar]
- Langston JW, Forno LS, Tetrud J, Reeves AG, Kaplan JA, Karluk D. Evidence of active nerve cell degeneration in the substantia nigra of humans years after 1-methyl-4-phenyl-1,2,3,6-tetrahydropyridine exposure. Ann Neurol. 1999;46:598–605. doi: 10.1002/1531-8249(199910)46:4<598::aid-ana7>3.0.co;2-f. [DOI] [PubMed] [Google Scholar]
- Lin LF, Doherty DH, Lile JD, Bektesh S, Collins F. GDNF: A glial cell line-derived neurotrophic factor for midbrain dopaminergic neurons. Science. 1993;260:1130–1132. doi: 10.1126/science.8493557. [DOI] [PubMed] [Google Scholar]
- McCormack AL, Di Monte DA, Delfani K, Irwin I, DeLanney LE, Langston WJ, Janson AM. Aging of the nigrostriatal system in the squirrel monkey. J Comp Neurol. 2004;471:387–395. doi: 10.1002/cne.20036. [DOI] [PubMed] [Google Scholar]
- McGeer PL, Itagaki S, McGeer EG. Expression of the histocompatibility glycoprotein HLA-DR in neurological disease. Acta Neuropathol (Berl) 1988;76:550–557. doi: 10.1007/BF00689592. [DOI] [PubMed] [Google Scholar]
- McGeer PL, Schwab C, Parent A, Doudet D. Presence of reactive microglia in monkey substantia nigra years after 1-methyl-4-phenyl-1,2,3,6-tetrahydropyridine administration. Ann Neurol. 2003;54:599–604. doi: 10.1002/ana.10728. [DOI] [PubMed] [Google Scholar]
- Mirza B, Hadberg H, Thomsen P, Moos T. The absence of reactive astrocytosis is indicative of a unique inflammatory process in Parkinson’s disease. Neuroscience. 2000;95:425–432. doi: 10.1016/s0306-4522(99)00455-8. [DOI] [PubMed] [Google Scholar]
- Mogi M, Harada M, Riederer P, Narabayashi H, Fujita K, Nagatsu T. Tumor necrosis factor-alpha (TNF-alpha) increases both in the brain and in the cerebrospinal fluid from parkinsonian patients. Neurosci Lett. 1994;165:208–210. doi: 10.1016/0304-3940(94)90746-3. [DOI] [PubMed] [Google Scholar]
- Mogi M, Togari A, Kondo T, Mizuno Y, Komure O, Kuno S, Ichinose H, Nagatsu T. Caspase activities and tumor necrosis factor receptor R1 (p55) level are elevated in the substantia nigra from parkinsonian brain. J Neural Transm. 2000;107:335–341. doi: 10.1007/s007020050028. [DOI] [PubMed] [Google Scholar]
- Nagatsu T, Sawada M. Inflammatory process in Parkinson’s disease: Role for cytokines. Curr Pharm Des. 2005;11:999–1016. doi: 10.2174/1381612053381620. [DOI] [PubMed] [Google Scholar]
- Oiwa Y, Eberling JL, Nagy D, Pivirotto P, Emborg ME, Bankiewicz KS. Overlesioned hemiparkinsonian non human primate model: Correlation between clinical, neurochemical and histochemical changes. Front Biosci. 2003;8:a155–a166. doi: 10.2741/1104. [DOI] [PubMed] [Google Scholar]
- Pasinetti GM, Hassler M, Stone D, Finch CE. Glial gene expression during aging in rat striatum and in long-term responses to 6-OHDA lesions. Synapse. 1999;31:278–284. doi: 10.1002/(SICI)1098-2396(19990315)31:4<278::AID-SYN5>3.0.CO;2-0. [DOI] [PubMed] [Google Scholar]
- Pekny M, Nilsson M. Astrocyte activation and reactive gliosis. Glia. 2005;50:427–434. doi: 10.1002/glia.20207. [DOI] [PubMed] [Google Scholar]
- Schauwecker PE, Cogen JP, Jiang T, Cheng HW, Collier TJ, McNeill TH. Differential regulation of astrocytic mRNAs in the rat striatum after lesions of the cortex or substantia nigra. Exp Neurol. 1998;149:87–96. doi: 10.1006/exnr.1997.6679. [DOI] [PubMed] [Google Scholar]
- Schneider JS, Yuwiler A, Markham CH. Selective loss of subpopulations of ventral mesencephalic dopaminergic neurons in the monkey following exposure to MPTP. Brain Res. 1987;411:144–150. doi: 10.1016/0006-8993(87)90691-3. [DOI] [PubMed] [Google Scholar]
- Streit WJ, Walter SA, Pennell NA. Reactive microgliosis. Prog Neurobiol. 1999;57:563–581. doi: 10.1016/s0301-0082(98)00069-0. [DOI] [PubMed] [Google Scholar]
- Stromberg I, Bjorklund H, Dahl D, Jonsson G, Sundstrom E, Olson L. Astrocyte responses to dopaminergic denervations by 6-hydroxydopamine and 1-methyl-4-phenyl-1,2,3,6-tetrahydropyridine as evidenced by glial fibrillary acidic protein immunohistochemistry. Brain Res Bull. 1986;17:225–236. doi: 10.1016/0361-9230(86)90119-x. [DOI] [PubMed] [Google Scholar]
- Sugama S, Yang L, Cho BP, DeGiorgio LA, Lorenzl S, Albers DS, Beal MF, Volpe BT, Joh TH. Age-related microglial activation in 1-methyl-4-phenyl-1,2,3,6-tetrahydropyridine (MPTP)-induced dopaminergic neurodegeneration in C57BL/6 mice. Brain Res. 2003;964:288–294. doi: 10.1016/s0006-8993(02)04085-4. [DOI] [PubMed] [Google Scholar]
- Teismann P, Schulz JB. Cellular pathology of Parkinson’s disease: Astrocytes, microglia and inflammation. Cell Tissue Res. 2004;318:149–161. doi: 10.1007/s00441-004-0944-0. [DOI] [PubMed] [Google Scholar]
- van Rossum D, Hanisch UK. Microglia. Metab Brain Dis. 2004;19:393–411. doi: 10.1023/b:mebr.0000043984.73063.d8. [DOI] [PubMed] [Google Scholar]
- Vilhardt F. Microglia: Phagocyte and glia cell. Int J Biochem Cell Biol. 2005;37:17–21. doi: 10.1016/j.biocel.2004.06.010. [DOI] [PubMed] [Google Scholar]
- West MJ, Gundersen HJ. Unbiased stereological estimation of the number of neurons in the human hippocampus. J Comp Neurol. 1990;296:1–22. doi: 10.1002/cne.902960102. [DOI] [PubMed] [Google Scholar]
- Wu DC, Jackson-Lewis V, Vila M, Tieu K, Teismann P, Vadseth C, Choi DK, Ischiropoulos H, Przedborski S. Blockade of microglial activation is neuroprotective in the 1-methyl-4-phenyl-1,2,3,6-tetrahydropyridine mouse model of Parkinson disease. J Neurosci. 2002;22:1763–1771. doi: 10.1523/JNEUROSCI.22-05-01763.2002. [DOI] [PMC free article] [PubMed] [Google Scholar]
Associated Data
This section collects any data citations, data availability statements, or supplementary materials included in this article.