

Abstract
Background
The clinical utility of identifying pediatric metabolic syndrome (MetS) is controversial. This study sought to determine the status of pediatric MetS as a risk factor for adult subclinical atherosclerosis (carotid intima-media thickness, cIMT) and type 2 diabetes mellitus (T2DM), and compare and contrast this prediction with its individual components.
Methods and Results
Using data from the population-based, prospective, observational Bogalusa Heart and Cardiovascular Risk in Young Finns studies, we examined the utility of four categorical definitions of youth MetS and their components in predicting adult high cIMT, and T2DM among 1781 participants aged 9–18 years at baseline (1984–88) who were then examined 14–27 years later (2001–2007) when aged 24–41 years. Youth with MetS were at 2–3 times the risk of having high cIMT, and T2DM as adults compared with those free of MetS at youth. Risk estimates using high body mass index (BMI) were similar to that of MetS phenotypes in predicting adult outcomes. Comparisons of area under the receiver operating characteristic curve and net reclassification suggested that prediction of adult MetS, high cIMT, and T2DM in adulthood using youth MetS was either equivalent or inferior to classification based on high BMI or overweight and obesity.
Conclusions
Youth with MetS are at increased risk of meaningful adult outcomes, however, the simplicity of screening for high BMI or overweight and obesity in the pediatric setting offers a simpler, equally accurate alternative to identifying youth at risk of developing adult MetS, high cIMT, or T2DM.
Keywords: pediatrics, metabolic syndrome, diabetes, carotid atherosclerosis, obesity
INTRODUCTION
The clinical utility of identifying pediatric metabolic syndrome (MetS) has recently been questioned because of evidence demonstrating marked short-term instability in the categorical diagnosis. 1–3 While instability of the diagnosis is an important concern, particularly in relation to considerations of pharmacotherapy in children and adolescents (herein referred to as youth), it is only one component in prediction. An equally important consideration concerns whether or not pediatric MetS identifies those at increased risk of subsequent disease later in life. Adults with MetS are at increased risk of type 2 diabetes mellitus (T2DM)4 and cardiovascular disease (CVD),4 but the evidence base for youth is not well established. For example, while some studies suggest that pediatric MetS predicts adult MetS,5–7 few studies have examined the link between MetS in youth and risk of future CVD8 and T2DM in adulthood.7 Furthermore, the existing data are limited by very small case numbers, and did not fully consider the contribution of each MetS component to risk prediction.9 It is therefore evident the current understanding on youth MetS and its components and their association with adult cardiometabolic-related outcomes is in its infancy and there is clearly a need for data from large-scale longitudinal studies on the utility of identifying pediatric MetS.
The present study is based on two prospective cohorts, the Bogalusa Heart Study (BHS) and the Cardiovascular Risk in Young Finns Study, that both have MetS risk factor variables measured in youth (baseline) and again in adulthood (follow-up). Our aims were to determine the status of pediatric MetS as a risk factor for adult MetS, subclinical atherosclerosis (carotid intima-media thickness, cIMT) and T2DM, and compare and contrast this prediction with its individual components. A secondary aim was to determine the long-term (childhood to adulthood) stability of MetS. These aims accord with the directions for future research detailed in the February 2009 Scientific Statement from the American Heart Association (AHA) on MetS in children and adolescents.1
METHODS
For the BHS, youth aged 9–18 years who participated in either the 1984–85 or 1987–88 surveys and attended either the 2001–02 or 2003–07 adult surveys (then aged 25–41 years) were included in the analyses (N=374). To harmonize the study designs, we included from Young Finns those who participated in the 1986 survey when aged 9, 12, 15, or 18 years and in either the 2001 or 2007 adult follow-ups (then aged 24–39 years, N=1407). For individuals that participated in multiple baseline (in the case of BHS) or follow-up surveys, we used those measures that provided the longest time-period between baseline and follow-up. Each study received ethical approval, and obtained written informed consent from participants. Measures available at baseline and follow-up included: height and weight, blood pressure, lipids and lipoproteins, glucose, and insulin. Waist circumference and ultrasound examinations of the carotid artery were collected at follow-up only. Study samples and protocols have been described in detail previously.10, 11 We encourage readers to view the online-only supplement for more comprehensive methods.
Classification of the metabolic syndrome in childhood
Because there is no universal definition of pediatric MetS, we took an approach used in previous reports that characterize pediatric MetS using multiple alternate definitions.2 We used BMI as the measure of adiposity since waist circumference was not available for either cohort at baseline. For the first two definitions, we generated age-, sex-, race- (BHS), cohort-, and study-year-specific z-scores of BMI, systolic and diastolic blood pressures, HDL-cholesterol, triglycerides, and glucose. For the modified National Cholesterol Education Program (modNCEP) definition, a participant was categorized as having MetS if he/she had any three of the following five components: BMI ≥75th percentile, systolic or diastolic blood pressure ≥75th percentile, HDL-cholesterol ≤25th percentile, triglycerides ≥75th percentile, or glucose ≥75th percentile. For the modified International Diabetes Federation (modIDF) definition, the same cut-points as those for the modNCEP definition were used but the combination of the components differed. The modIDF required elevated BMI plus any two of the remaining four components to be classified as having MetS. The third and fourth definitions utilized age- and sex-standardized pediatric cut-points available in the literature to denote each component risk factor. For example, overweight or obesity was defined according to the Cole classification;12 prehypertension or hypertension was defined according to the fourth report on high blood pressure in children and adolescents from the National High Blood Pressure Education Program;13 low HDL-cholesterol and high triglycerides were defined using cut-points recently proposed from growth-curve data that were linked to adult definitions;14 and hyperglycemia was defined as plasma glucose ≥5.60 mmol/L (100 mg/dL), as growth-curve data linking youth glucose levels to adult hyperglycemia have shown levels to remain consistent in the pediatric setting.15 Pediatric NCEP (pedNCEP) definition required any three of these five criteria whereas the pediatric IDF (pedIDF) required overweight or obesity plus any two of the remaining four components. To complement the dichotomous definitions, a continuous MetS risk score (cMetS) was created using the methods described by Wijndaele et al.16 Similar to previous studies using this method,16, 17 two principal components were identified (see eTable 1 on the online-only supplement). The principal components were then summed, with weights determined by the relative proportion of variance explained, in order to compute cMetS where a higher score is indicative of a less favorable MetS profile.16
Classification of the metabolic syndrome in adulthood
To classify adult MetS, we used the recent definition proposed in a joint statement of the IDF Task Force on Epidemiology and Prevention, National Heart, Lung and Blood Institute (NHLBI), the AHA, the World Heart Federation, the International Atherosclerosis Society, and the International Association for the Study of Obesity.18
Classification of high carotid IMT in adulthood
As previously detailed,19 the most consistent cIMT measurement recorded across study centers was the maximum measurement at the far wall of the left common carotid artery. We defined high cIMT in adulthood as a maximum cIMT ≥90th percentile for age-, sex-, race-(BHS), study-year-, and cohort-specific values. In sensitivity analyses, we had essentially similar results using standardized cut-points corresponding to the 70th, 75th, 80th, and 85th cIMT percentiles (data not shown).
Classification of type 2 diabetes in adulthood
Participants were classified as having T2DM if they: (1) had a fasting plasma glucose ≥7.0 mmol/L (≥125 mg/dL); or (2) reported receiving oral hypoglycemic agents and/or insulin injections and did not have type 1 diabetes; or (3) reported a history of physician-diagnosed T2DM, which is consistent with the WHO definition.20 Women who reported having physician-diagnosed diabetes only during the term of their pregnancy were considered to have had gestational diabetes, and were classified as not currently having T2DM provided their plasma glucose levels were not ≥7.0 mmol/L (≥125 mg/dL).
Statistical analyses
Stability of MetS between youth and adulthood
Stability of MetS definitions between youth and adulthood are presented according to three groups: (1) persistent MetS (MetS positive youth who were also MetS positive as adults); (2) instable (those MetS positive at baseline but MetS negative at follow-up); and (3) incident MetS (MetS negative youth who were MetS positive as adults). The number of participants in each of these three groups is expressed as a proportion of the total MetS cases identified (total cases from youth and adulthood) and are presented graphically, which is consistent with previous reports.2, 3
Utility of pediatric MetS in predicting adult outcomes
Relative risks and 95% confidence intervals estimated using log binomial regression or Poisson regression with robust standard errors were used to examine associations between MetS phenotypes (number of MetS components in youth; youth MetS status; cMetS score) and outcomes of: (1) adult MetS; (2) adult high cIMT; and (3) adult T2DM. Analyses were performed for both cohort-stratified and cohort-pooled data. All estimates were adjusted for length of follow-up. We adjusted for length of follow-up to account for any within-cohort differences observed between length of follow-up and risk of adult outcomes, as we have previously observed and detailed.19 Race was also included as a covariate for BHS analyses. For pooled estimates, we included a two-level variable for cohort. Interactions between cohort and the predictor variables were assessed by including product terms as additional covariates. The association between each MetS component and the adult outcomes were examined using two models. Model 1 adjusted for length of follow-up and cohort; model 2 additionally included all MetS components.
The ability of each MetS definition in youth to predict MetS, high cIMT, and T2DM in adulthood was assessed using sensitivity, specificity, positive predictive value (PPV), negative predictive value (NPV), and area under receiver-operating characteristic curves (AUC). Because we found high BMI in youth to be the major contributing component in the prediction of adult outcomes, we also provide these data for high BMI. In addition, we performed comparisons between three models: (A) high youth BMI (referent model); (B) modNCEP (or pedNCEP) MetS definition; and (C) modIDF (or pedIDF) MetS definition to predict adult outcomes of MetS, high cIMT, and T2DM. Differences in AUC between models were estimated using the DeLong algorithm.21 Net reclassification improvement (NRI) was also calculated to determine the extent to which MetS definitions reassigned participants to a risk status that better reflected their final outcome (case or control).22 All statistical analyses were performed using STATA 10 with statistical significance inferred at a 2-tailed P-value ≤0.05.
RESULTS
Participant characteristics
Key baseline and follow-up characteristics are displayed in Table 1. Mean (SD) length of follow-up between baseline and follow-up was 24.4(3.7) years and ranged from 14–27 years. The prevalence of youth MetS differed according to definition. Those with T2DM at follow-up included 25 BHS participants (2 black males, 10 black females, 4 white males, 9 white females; prevalence in blacks=9.5%, whites=5.3%, overall=6.7%) and 11 Young Finns participants (4 male and 7 female, prevalence=0.8%).
Table 1.
Baseline and follow-up characteristics of participants
| Bogalusa | Young Finns | |||
|---|---|---|---|---|
| Males | Females | Males | Females | |
| Baseline | ||||
| N | 158 | 216 | 626 | 781 |
| Age, y | 14.0 (2.4) | 13.9 (2.5) | 13.3 (3.3) | 13.5 (3.3) |
| Blacks, % | 28.5 | 38.0 | - | - |
| BMI, kg/m2 | 21.4 (4.7) | 21.7 (4.9) | 19.1 (3.2) | 19.4 (3.2) |
| Systolic BP, mm/Hg | 110.5 (11.1) | 107.3 (9.4) | 112.7 (3.2) | 110.0 (10.9) |
| Diastolic BP, mm/Hg | 64.3 (8.5) | 67.0 (8.8) | 62.3 (10.2) | 63.2 (9.3) |
| HDL cholesterol, mmol/L | 1.51 (0.59) | 1.53 (0.48) | 1.49 (0.29) | 1.54 (0.26) |
| Triglycerides, mmol/L | 0.74 (0.52,1.04) | 0.74 (0.55,1.04) | 0.78 (0.62,1.02) | 0.86 (0.69–1.10) |
| Glucose, mmol/L | 4.83 (0.47) | 4.66 (0.45) | 4.80 (0.66) | 4.67 (1.11) |
| modNCEP MetS, % | 24.7 | 19.4 | 18.4 | 15.5 |
| modIDF MetS, % | 15.2 | 13.4 | 13.1 | 11.3 |
| pedsNCEP MetS, % | 3.4 | 3.5 | 2.6 | 2.2 |
| pedsIDF MetS, % | 3.4 | 3.5 | 1.9 | 2.0 |
| cMetS score | 0.11 (1.26) | 0.06 (1.23) | −0.02 (1.32) | 0.00 (1.25) |
| Overweight/obese, %* | 31.0 | 28.2 | 11.2 | 11.4 |
| Follow-up | ||||
| Age, y | 32.5 (2.9) | 32.6 (2.7) | 33.2 (4.1) | 33.5 (4.2) |
| NCEP MetS, % | 22.8 | 17.1 | 22.5 | 12.9 |
| High IMT, % | 10.3 | 7.8 | 11.5 | 10.2 |
| T2DM, % | 3.8 | 8.8 | 0.7 | 0.9 |
Data are mean (SD) or median (interquartile range) for continuous variables, and percentages for dichotomous variables. To convert HDL cholesterol to mg/dl, multiply values by 38.67; to convert triglyceride values to mg/dl, multiply values by 88.5; to convert glucose to mg/dl, multiply values by 18.
According to the Cole classification.12
Abbreviations: BMI=body mass index; BP=blood pressure; HDL=high-density lipoprotein; modNCEP=modified National Cholesterol Education Program; MetS=metabolic syndrome; modIDF= modified International Diabetes Federation; pedsNCEP=pediatric National Cholesterol Education Program; pedsIDF= pediatric International Diabetes Federation; cMetS=continuous metabolic syndrome score; cIMT=carotid intima-media thickness; T2DM=type 2 diabetes mellitus.
Stability of MetS between youth and adulthood
The proportions of participants who had persistent MetS, incident MetS, or lost MetS diagnosis using different youth MetS definitions is displayed in Figure 1. Of those with MetS at either baseline or follow-up, those with persistent MetS accounted for approximately 20% based on the modified definitions and ~7% using the pediatric definitions. Irrespective of the youth definition employed, the major proportion of participants with MetS had acquired it since youth.
Figure 1.
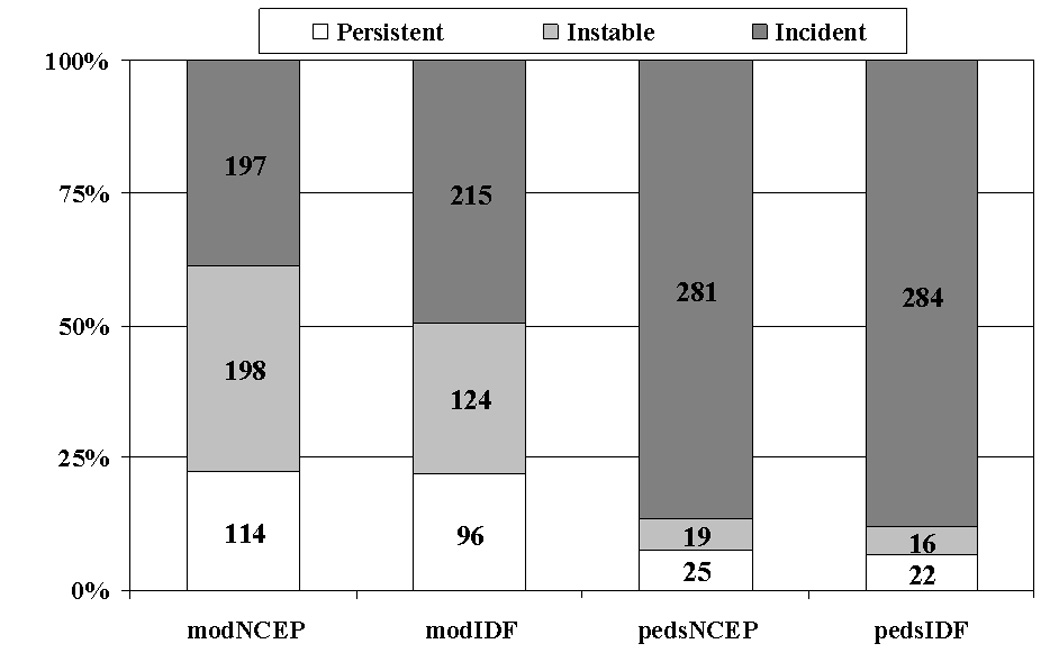
Proportions of participants with persistent, baseline only, and incident MetS according to two definitions of youth MetS. y-axis indicates the proportion of total MetS cases identified (youth and adult). Number of cases for each group is shown in the center of each bar. Dx=diagnosis.
Utility of pediatric MetS in predicting adult outcomes
Adult MetS
Pooled analyses suggested youth with MetS to have between 2.7 and 3.4 times greater risk of adult MetS compared with those without baseline MetS (all P<0.05, complete data not shown). The risk of adult MetS tended to increase as the number of youth MetS components increased (P-trend <0.001), while 1-SD increase in youth cMetS score increased risk of adult MetS (RR=1.5, 95%CI=1.4–1.6).
Adult high cIMT
Relative risks for pediatric MetS definitions in predicting high cIMT in adulthood are displayed in Table 2. Pediatric MetS definitions were associated with ~2-fold increase in risk for developing high cIMT in adulthood. The risk of high cIMT increased as the number of youth MetS components increased. As youth cMetS increased, risk of high cIMT in adulthood increased in each cohort, but was stronger in BHS than Young Finns (P for interaction <0.01). In light of this interaction, the pooled estimate should be interpreted with caution. Effect estimates from pooled analyses that additionally adjusted for baseline LDL-cholesterol and smoking were essentially similar.
Table 2.
Relative risk (RR) and 95% confidence intervals (95%CI) of high cIMT in adulthood according to MetS risk variables in childhood*
| Bogalusa | Young Finns | Pooled | ||||
|---|---|---|---|---|---|---|
| RR | (95%CI) | RR | (95%CI) | RR | (95%CI) | |
| No. MetS components | ||||||
| 0 | 1.0 | ref | 1.0 | ref | 1.0 | ref |
| 1 | 3.3 | (0.7–14.8) | 1.1 | (0.7–1.7) | 1.2 | (0.8–1.9) |
| 2 | 4.8 | (1.1–21.5) | 1.2 | (0.7–1.8) | 1.4 | (0.9–2.1) |
| 3 | 7.1 | (1.6–31.7) | 1.6 | (1.0–2.7) | 2.0 | (1.3–3.2) |
| ≥4 | 8.7 | (1.7–45.1) | 2.5 | (1.5–4.3) | 2.9 | (1.8–4.7) |
| Ptrend | <0.001 | 0.001 | <0.001 | |||
| modNCEP MetS | 2.6 | (1.3–5.0) | 1.8 | (1.3–2.5) | 1.9 | (1.4–2.6) |
| modIDF MetS | 3.7 | (1.9–7.3) | 1.9 | (1.3–2.7) | 2.2 | (1.6–3.0) |
| pedsNCEP MetS | 2.3 | (0.7–8.2) | 2.1 | (1.1–4.1) | 2.1 | (1.2–3.9) |
| pedsIDF MetS | 2.3 | (0.7–8.2) | 1.8 | (0.8–4.0) | 1.9 | (1.0–3.8) |
| cMetS† | 1.6 | (1.3–2.0) | 1.2 | (1.1–1.3) | 1.3 | (1.1–1.4) |
All models adjusted for length of follow-up; pooled estimates additionally adjusted for cohort. Reference category for dichotomous predictor variables (modNCEP, modIDF, pedsNCEP, pedsIDF) is no MetS.
Relative risks and 95%CIs expressed for a 1SD increase in cMetS. See Table 1 footnote for abbreviations.
Adult T2DM
Relative risks of T2DM in adulthood according to youth MetS is shown in Table 3. Pooled analyses showed youth with MetS had 2–3 times the risk of developing T2DM in adulthood compared to those without youth MetS. There was a trend toward increased risk of T2DM as MetS components increased, but this effect was driven by Young Finns (P for interaction <0.001). A 1-SD increase in cMetS in youth was associated with 30% excess risk of T2DM in adulthood.
Table 3.
Relative risk (RR) and 95% confidence intervals (95%CI) of T2DM in adulthood according to MetS risk variables in childhood*
| Bogalusa | Young Finns | Pooled | ||||
|---|---|---|---|---|---|---|
| RR | (95%CI) | RR | (95%CI) | RR | (95%CI) | |
| No. MetS components | ||||||
| 0 | 1.0 | ref | 1.0 | ref | 1.0 | ref |
| 1 | 1.2 | (0.4–4.0) | 3.1 | (0.3–27.8) | 1.7 | (0.6–4.8) |
| 2 | 2.3 | (0.7–7.5) | 1.2 | (0.1–18.4) | 2.2 | (0.8–6.5) |
| 3 | 1.7 | (0.4–6.5) | 5.0 | (0.5–53.8) | 2.3 | (0.7–7.4) |
| ≥4 | 3.7 | (0.9–16.0) | 12.9 | (1.3–127.4) | 6.3 | (2.0–20.5) |
| Ptrend | 0.06 | 0.04 | 0.006 | |||
| modNCEP MetS | 1.5 | (0.7–3.5) | 4.1 | (1.3–13.5) | 2.1 | (1.1–4.2) |
| modIDF MetS | 2.6 | (1.2–6.0) | 6.0 | (1.8–19.9) | 3.4 | (1.7–6.7) |
| pedsNCEP MetS | 2.9 | (0.8–11.1) | 4.2 | (0.5–34.6) | 3.6 | (1.1–11.7) |
| pedsIDF MetS | 2.9 | (0.8–11.1) | 5.2 | (0.7–40.2) | 3.8 | (1.2–12.6) |
| cMetS† | 1.1 | (0.8–1.6) | 1.4 | (1.0–2.1) | 1.3 | (1.0–1.6) |
All models adjusted for length of follow-up; pooled estimates additionally adjusted for cohort. Reference category for dichotomous predictor variables (modNCEP, modIDF, pedsNCEP, pedsIDF) is no MetS.
Relative risks and 95%CIs expressed for a 1SD increase in cMetS. See Table 1 footnote for abbreviations
Youth MetS components in predicting adult outcomes
Table 4 displays relative risks from pooled data for predicting MetS, high cIMT, and T2DM in adulthood according to each component of youth MetS (cohort-stratified data were essentially similar, data not shown). High BMI was the only consistent component associated with increased risk of adult outcomes in multivariable models. Insulin was a multivariable predictor of adult MetS but not high cIMT or T2DM; BMI remained a strong predictor of all outcomes with the inclusion of insulin (eTable 2). Risk estimates using high BMI (Table 4) were similar to that of MetS phenotypes (Tables 2–3) in predicting adult outcomes.
Table 4.
Relative risks (RR) and 95% confidence intervals (95%CI) of adult MetS, high cIMT, and T2DM according to each component of youth MetS definitions
| MetS | High cIMT | T2DM | ||||||||||
|---|---|---|---|---|---|---|---|---|---|---|---|---|
| Model 1* | Model 2† | Model 1* | Model 2† | Model 1* | Model 2† | |||||||
| RR | (95%CI) | RR | (95%CI) | RR | (95%CI) | RR | (95%CI) | RR | (95%CI) | RR | (95%CI) | |
| modNCEP/IDF | ||||||||||||
| BMI ≥75th percentile | 3.0 | (2.5–3.7) | 2.5 | (2.1–3.1) | 2.2 | (1.7–2.9) | 2.1 | (1.6–2.8) | 3.4 | (1.8–6.4) | 3.0 | (1.6–5.7) |
| BP ≥75th percentile | 1.5 | (1.2–1.8) | 1.2 | (1.0–1.5) | 1.4 | (1.0–1.8) | 1.3 | (1.0–1.7) | 1.0 | (0.5–2.0) | 0.9 | (0.5–1.8) |
| HDL-C ≤25th percentile | 1.9 | (1.6–2.4) | 1.4 | (1.2–1.8) | 1.3 | (1.0–1.8) | 1.1 | (0.8–1.6) | 1.8 | (0.9–3.4) | 1.5 | (0.7–3.1) |
| TG ≥75th percentile | 2.0 | (1.6–2.5) | 1.4 | (1.1–1.7) | 1.3 | (1.0–1.7) | 1.0 | (0.7–1.4) | 1.3 | (0.6–2.6) | 0.9 | (0.4–1.8) |
| Glucose ≥75th percentile | 1.5 | (1.2–1.9) | 1.3 | (1.0–1.6) | 1.1 | (0.8–1.6) | 1.0 | (0.7–1.4) | 1.8 | (0.9–3.4) | 1.5 | (0.8–2.9) |
| peds NCEP/IDF | ||||||||||||
| Overweight or obese | 2.9 | (2.4–3.6) | 2.5 | (2.0–3.1) | 2.4 | (1.8–3.2) | 2.2 | (1.6–3.0) | 3.4 | (1.7–6.8) | 3.4 | (1.7–6.7) |
| Prehypertensive or hypertension | 1.7 | (1.4–2.1) | 1.4 | (1.1–1.8) | 1.7 | (1.2–2.3) | 1.5 | (1.1–2.0) | 1.2 | (0.5–2.6) | 0.9 | (0.4–2.3) |
| Low HDL-C | 1.7 | (1.3–2.1) | 1.3 | (1.0–1.7) | 1.3 | (0.9–1.9) | 1.2 | (0.8–1.8) | 1.3 | (0.5–2.9) | 1.0 | (0.4–2.5) |
| Hypertriglyceridemia | 2.5 | (1.9–3.3) | 1.5 | (1.0–2.1) | 1.6 | (0.9–2.7) | 1.0 | (0.6–1.8) | 2.0 | (0.6–6.4) | 1.5 | (0.4–5.9) |
| Hyperglycemia | 1.3 | (0.7–2.3) | 1.2 | (0.7–2.1) | 0.9 | (0.4–2.4) | 0.9 | (0.4–2.3) | 0.8 | (0.1–6.2) | 0.6 | (0.1–5.6) |
Model 1: adjusted for length of follow-up and cohort;
Model 2: adjusted for length of follow-up, cohort, and all other MetS components. See Table 1 footnote for abbreviations
Comparison between high BMI and MetS definitions
The prevalence of modNCEP and modIDF MetS among youth with BMI ≥75th percentile was 49.3%; the prevalence of pedsNCEP and pedsIDF MetS among youth classified as overweight or obese12 was 14.8%. Data that compare high BMI with MetS definitions in youth in predicting adult outcomes are displayed in Table 5, and eTable 3. Prediction of adult outcomes by BMI in youth was either equal to or superior than the prediction provided by any of the youth MetS definitions. Substantial gains in sensitivity at relatively modest trade-offs in specificity were observed using high BMI or overweight or obesity in youth, which translated to improved discrimination (AUC). Evidenced by negative NRI, accuracy of classification reduced significantly (all P<0.03) by using either of the youth MetS definitions in place of high BMI.
Table 5.
Sensitivity, specificity, positive predictive value (PPV), negative predictive value (NPV), area under the curve (AUC), and net reclassification index (NRI) values for youth high BMI, MetS definitions in predicting adult MetS, high cIMT, and T2DM
| Adult outcome | Child MetS definition | N | Sensitivity, % | Specificity, % | PPV, % | NPV, % | AUC | (95%CI) | P-value | NRI, % | P-value |
|---|---|---|---|---|---|---|---|---|---|---|---|
| MetS | |||||||||||
| BMI ≥75th percentile | 1755 | 50.8 | 80.0 | 35.4 | 88.3 | 0.654 | (0.624–0.684) | - | - | - | |
| modNCEP | 1755 | 36.7 | 86.3 | 36.5 | 86.3 | 0.615 | (0.586–0.643) | 0.008 | −7.9 | <0.001 | |
| modIDF | 1755 | 30.9 | 91.4 | 43.6 | 86.0 | 0.611 | (0.585–0.638) | <0.001 | −8.9 | <0.001 | |
| High cIMT | |||||||||||
| BMI ≥75th percentile | 1743 | 43.1 | 76.6 | 17.6 | 92.1 | 0.599 | (0.561–0.636) | - | - | - | |
| modNCEP | 1743 | 29.3 | 83.6 | 17.2 | 91.1 | 0.565 | (0.530–0.599) | 0.07 | −7.2 | 0.03 | |
| modIDF | 1743 | 23.8 | 88.8 | 19.7 | 91.0 | 0.563 | (0.531–0.595) | 0.02 | −7.2 | 0.02 | |
| T2DM | |||||||||||
| BMI ≥75th percentile | 1767 | 52.8 | 75.1 | 4.2 | 98.7 | 0.639 | (0.556–0.723) | - | - | - | |
| modNCEP | 1767 | 33.3 | 82.6 | 3.8 | 98.3 | 0.580 | (0.501–0.658) | 0.08 | −20.8 | 0.004 | |
| modIDF | 1767 | 33.3 | 87.9 | 5.4 | 98.5 | 0.606 | (0.528–0.685) | 0.33 | −14.5 | 0.02 | |
See Table 1 footnote for abbreviations. N refers to the total number of participants in the sample with eligible outcome data.
DISCUSSION
This study addresses two important areas regarding MetS in youth outlined in the recent scientific statement from the AHA, namely: (1) the long-term stability of MetS definitions from youth to adulthood, and (2) whether MetS definitions are able to predict future disease.1 We found that despite instability in the diagnosis of youth MetS over a mean 24-year period, dichotomous definitions of MetS in youth predict important disease outcomes, such as adult MetS, high cIMT, and T2DM in early to middle adulthood. Our analyses also revealed that high BMI alone was as good and in some cases superior to dichotomous pediatric MetS definitions in predicting adult MetS, high cIMT and T2DM. These findings have important clinical implications.
MetS is a subject of controversy in both adult23 and pediatric settings.1 From a pediatric perspective, the AHA has declined provision of a consensus definition on MetS partly due to unclear potential of youth with MetS to maintain the diagnosis even over relatively short periods.1–3 Using three different definitions to diagnose MetS in 15-year olds from a population-based sample, Goodman et al.2 showed that despite consistent risk factor clustering, the diagnosis of MetS was stable in only 50% of cases over a 3-year period. Among obese youth aged 6–17 years, Gustafson et al.3 found that only 30% and 45% of those with baseline MetS were confirmed after 60-day and 1.5-year follow-ups, which is striking considering the short duration of follow-up but also because it is obese youth whom we would expect MetS to be maintained at a comparatively high level. Although MetS definitions used in this study can not be directly compared with those used in these previous reports, our estimates of mean 24-year stability were in the same order of magnitude ranging from 40–60% depending on the youth MetS definition employed. This suggests that while long-term stability is low, it does not appear to be substantially worse than short-term stability. This finding is not surprising given the known influence of pubertal stage on a number of MetS components24 that may have contributed to the low short-term stability observed in both prior studies. In addition, while tracking of risk factor levels is known to decrease as the interval between measurements becomes longer,25, 26 the ability to predict future values from baseline levels tends to decrease substantially in the first days to weeks followed by a more modest decline over several years.26
Although stability of dichotomous MetS definitions may not be substantially worse over a longer follow-up, the clinical utility of categorical MetS definitions is limited, especially given that about 40%, 20%, and 5% of youth identified as having MetS would have MetS, high cIMT, or T2DM in adulthood at age 24–41. These data are consistent with recent reports on longitudinal data.27, 28 Although these studies were primarily concerned with testing different risk thresholds and combinations of risk factors for categorizing youth MetS, an interesting finding in both studies was that while sensitivity and positive predictive values were low, specificity and negative predictive values were consistently high across the criteria examined. Our findings are in line with these results. Rather than considering identification of youth with MetS as a means of identifying those who will develop important outcomes in adulthood, it may be more apt to use these definitions, should they be adopted in a clinical setting, as a basis for identifying those not at risk so that further attention could be focused on those with unclear potential for developing MetS, high cIMT, or T2DM at early-middle adulthood.28 This interpretation appears relevant given our findings that those with youth MetS, irrespective of instability in the categorical diagnosis and poor clinical prediction, were at significantly increased risk of MetS, high cIMT, and T2DM in adulthood. However, we acknowledge that a substantially longer follow-up period is needed to judge the clinical utility with respect to T2DM given that the increase in T2DM incidence begins to rise only after age 50-years.
Perhaps the most important finding from this study was that high BMI predicts each outcome as well as, or better than the categorical MetS definitions considered in this study. This finding has clinical relevance. At pediatric visits for health care, BMI can easily and accurately be determined using minimum equipment, which would allow the immediate identification of youth at heightened risk (using Coles’ international tables) that might benefit from therapeutic lifestyle intervention aimed at weight control. Other benefits include the need not to subject a child to a blood draw, and aversion of costs and time associated with laboratory analysis. A caveat to the clinical application of these findings is that a substantial number of contemporary youth will be identified as at-risk.
One explanation for why the additional measures incorporated into MetS did not improve prediction may be because one measurement of BMI is more accurate than one measurement of the laboratory components of MetS. Pediatric guidelines concerning blood pressure13 and lipids29 require multiple measurements before elevated levels are diagnosed owing to laboratory and biologic variation. It is possible that multiple laboratory-based and blood pressure measures collected over a period of weeks/months may improve the observed estimates for pediatric MetS, and is a limitation of this study. In line with this hypothesis, Gaziano and colleagues have recently shown a non-laboratory-based risk score (including BMI, blood pressure, smoking status, and reported diabetes status) to predict CVD events as accurately as a risk score that additionally included laboratory-based methods.30
Another explanation may be that overweight and obesity precedes the clustering of MetS components such that it may be a more sensitive marker in the pediatric setting. While the specific etiology of MetS is unknown, potential mechanisms posit obesity and insulin resistance as initiating factors.31, 32 We found overweight and obesity to remain an independent predictor of adult outcomes in multivariable models but the corresponding association with insulin disappeared. While our study cannot establish causality, these data are consistent with reports from the BHS showing a temporal association between degree of baseline adiposity and incidence of hyperinsulinemia in youth and young adults independent of baseline insulin levels;33 and independence of childhood obesity, but not insulin or insulin resistance, in predicting adult MetS.34
Limitations
Several limitations need to be considered. First, because a substantial proportion of participants at baseline did not attend follow-up, bias due to differential loss to follow-up is possible. However, while we have previously shown that non-participants at follow-up were more likely to be younger, males, and blacks (BHS), baseline risk factor levels were similar between those who did, and those who did not, attend follow-up suggesting that a major bias is unlikely.19, 35 A second limitation is missing data on baseline waist circumference in both cohorts. The baseline surveys were performed in the 1980s before the importance of abdominal adiposity to clustering of metabolic-related risk factors was known. While BMI is considered a reasonable alternative to waist circumference,36 it may be a less sensitive measure in the context of this report. Third, the low numbers with T2DM in both cohorts and use of fasting glucose levels and self-report data to indicate adult T2DM mean that associations with T2DM should be interpreted cautiously. Fourth, while our data suggest that the identification of meaningful outcomes in adulthood might be accomplished by screening for only youth BMI, we are unable to discount that other elements of youth metabolic syndrome may be useful in identifying and possibly treating cardiometabolic disorders, and future research should seek to address this gap.
Conclusions
Accumulating evidence is increasingly coming to light on the limitations of using a dichotomous definition of MetS in the pediatric setting that incorporate rudimentary elements shown to have clinical utility in adult settings. While our data demonstrate that multiple pediatric definitions predict clinically meaningful outcomes, these definitions do so at a level equivalent or inferior to predictions obtained from the status of high BMI in youth. The benefits of screening for only high BMI or overweight and obesity in the pediatric setting are obvious. These data thus contribute to the ongoing debate concerning the clinical utility of applying dichotomous MetS definitions adapted from the adult literature to the pediatric setting.
Clinical Perspective.
In a recent Scientific Statement from the American Heart Association (AHA) on metabolic syndrome (MetS) in children and adolescents the need for additional research examining the efficacy of pediatric MetS to predict adult health was highlighted. In the present analyses based on two population-based prospective cohorts, the Bogalusa Heart Study and the Cardiovascular Risk in Young Finns Study, we examined the utility of youth MetS and its components in predicting adult high carotid intima-media thickness (cIMT), and type 2 diabetes mellitus (T2DM) amongst 1781 participants aged 9–18 years at baseline who were re-examined 14–27 years later. We observed that youth with MetS were at 2–3 times the risk of having high cIMT, and T2DM as adults compared with those free of MetS. However, the prediction of adult high cIMT, and T2DM using youth body mass index (BMI) was either equivalent or superior to classification based on pediatric MetS. Our findings have direct clinical relevance as they suggest that in the clinical setting, efforts to identify youth with heightened future risk of meaningful outcomes can be minimally achieved using BMI only, thus avoiding cost and other barriers associated with testing and classification of youth MetS. However, clinicians who use high BMI to identify youth at increased future risk need to keep in mind that a large proportion of contemporary youth will be classified as at-risk, and, that our analyses are unable to discount that youth MetS may be useful in identifying and possibly treating other cardiometabolic disorders.
Supplementary Material
Acknowledgements
We thank Pronabesh Das Mahapatra (MD) from the BHS group and Ville Aalto (MSSc) from the Young Finns group for assistance in compiling these data.
Funding Sources
The Bogalusa Heart Study was financially supported by NIH Grants AG-16592 from the National Institute of Aging, HL-38844 from the National Heart, Lung, and Blood Institute. The Cardiovascular Risk in Young Finns study was financially supported by the Academy of Finland (grants 117797, 126925, and 121584), the Social Insurance Institution of Finland, the Turku University Foundation, Special Federal Grants for the Turku University Central Hospital, the Juho Vainio Foundation, the Finnish Foundation of Cardiovascular Research, the Finnish Cultural Foundation, and the Orion Farmos Research Foundation.
CGM’s contribution to this paper was supported in part by the Emil and Blida Maunulan fund. MKiv is supported by the National Heart, Lung, and Blood Institute (R01HL036310-20A2), NIH, USA and the BUPA Foundation Specialist Research Grant. MKäh is supported by the Tampere University Hospital Medical Fund.
Footnotes
Publisher's Disclaimer: This is a PDF file of an unedited manuscript that has been accepted for publication. As a service to our customers we are providing this early version of the manuscript. The manuscript will undergo copyediting, typesetting, and review of the resulting proof before it is published in its final citable form. Please note that during the production process errors may be discovered which could affect the content, and all legal disclaimers that apply to the journal pertain.
Disclosures
None.
REFERENCES
- 1.Steinberger J, Daniels SR, Eckel RH, Hayman L, Lustig RH, McCrindle B, Mietus-Snyder ML. Progress and challenges in metabolic syndrome in children and adolescents: a scientific statement from the American Heart Association Atherosclerosis, Hypertension, and Obesity in the Young Committee of the Council on Cardiovascular Disease in the Young; Council on Cardiovascular Nursing; and Council on Nutrition, Physical Activity, and Metabolism. Circulation. 2009;119:628–647. doi: 10.1161/CIRCULATIONAHA.108.191394. [DOI] [PubMed] [Google Scholar]
- 2.Goodman E, Daniels SR, Meigs JB, Dolan LM. Instability in the diagnosis of metabolic syndrome in adolescents. Circulation. 2007;115:2316–2322. doi: 10.1161/CIRCULATIONAHA.106.669994. [DOI] [PMC free article] [PubMed] [Google Scholar]
- 3.Gustafson JK, Yanoff LB, Easter BD, Brady SM, Keil MF, Roberts MD, Sebring NG, Han JC, Yanovski SZ, Hubbard VS, Yanovski JA. The Stability of Metabolic Syndrome in Children and Adolescents. J Clin Endocrinol Metab. 2009 doi: 10.1210/jc.2008-2665. [DOI] [PMC free article] [PubMed] [Google Scholar]
- 4.Wilson PW, D'Agostino RB, Parise H, Sullivan L, Meigs JB. Metabolic syndrome as a precursor of cardiovascular disease and type 2 diabetes mellitus. Circulation. 2005;112:3066–3072. doi: 10.1161/CIRCULATIONAHA.105.539528. [DOI] [PubMed] [Google Scholar]
- 5.Bao W, Srinivasan SR, Wattigney WA, Berenson GS. Persistence of multiple cardiovascular risk clustering related to syndrome X from childhood to young adulthood. The Bogalusa Heart Study. Arch Intern Med. 1994;154:1842–1847. [PubMed] [Google Scholar]
- 6.Chen W, Srinivasan SR, Li S, Xu J, Berenson GS. Metabolic syndrome variables at low levels in childhood are beneficially associated with adulthood cardiovascular risk: the Bogalusa Heart Study. Diabetes Care. 2005;28:126–131. doi: 10.2337/diacare.28.1.126. [DOI] [PubMed] [Google Scholar]
- 7.Morrison JA, Friedman LA, Wang P, Glueck CJ. Metabolic syndrome in childhood predicts adult metabolic syndrome and type 2 diabetes mellitus 25 to 30 years later. J Pediatr. 2008;152:201–206. doi: 10.1016/j.jpeds.2007.09.010. [DOI] [PubMed] [Google Scholar]
- 8.Morrison JA, Friedman LA, Gray-McGuire C. Metabolic syndrome in childhood predicts adult cardiovascular disease 25 years later: the Princeton Lipid Research Clinics Follow-up Study. Pediatrics. 2007;120:340–345. doi: 10.1542/peds.2006-1699. [DOI] [PubMed] [Google Scholar]
- 9.Brambilla P, Lissau I, Flodmark CE, Moreno LA, Widhalm K, Wabitsch M, Pietrobelli A. Metabolic risk-factor clustering estimation in children: to draw a line across pediatric metabolic syndrome. Int J Obes (Lond) 2007;31:591–600. doi: 10.1038/sj.ijo.0803581. [DOI] [PubMed] [Google Scholar]
- 10.Berenson GS, Srinivasan SR, Bao W, Newman WP, 3rd, Tracy RE, Wattigney WA. Association between multiple cardiovascular risk factors and atherosclerosis in children and young adults. The Bogalusa Heart Study. N Engl J Med. 1998;338:1650–1656. doi: 10.1056/NEJM199806043382302. [DOI] [PubMed] [Google Scholar]
- 11.Raitakari OT, Juonala M, Rönnemaa T, Keltikangas-Jarvinen L, Räsänen L, Pietikainen M, Hutri-Kahonen N, Taittonen L, Jokinen E, Marniemi J, Jula A, Telama R, Kähönen M, Lehtimäki T, Åkerblom HK, Viikari JS. Cohort profile: the cardiovascular risk in Young Finns Study. Int J Epidemiol. 2008;37:1220–1226. doi: 10.1093/ije/dym225. [DOI] [PubMed] [Google Scholar]
- 12.Cole TJ, Bellizzi MC, Flegal KM, Dietz WH. Establishing a standard definition for child overweight and obesity worldwide: international survey. BMJ. 2000;320:1240–1243. doi: 10.1136/bmj.320.7244.1240. [DOI] [PMC free article] [PubMed] [Google Scholar]
- 13.The fourth report on the diagnosis, evaluation, and treatment of high blood pressure in children and adolescents. Pediatrics. 2004;114:555–576. [PubMed] [Google Scholar]
- 14.Cook S, Auinger P, Huang TT. Growth curves for cardio-metabolic risk factors in children and adolescents. J Pediatr. 2009;155:S6, e15–e26. doi: 10.1016/j.jpeds.2009.04.051. [DOI] [PMC free article] [PubMed] [Google Scholar]
- 15.Jolliffe CJ, Janssen I. Development of age-specific adolescent metabolic syndrome criteria that are linked to the Adult Treatment Panel III and International Diabetes Federation criteria. J Am Coll Cardiol. 2007;49:891–898. doi: 10.1016/j.jacc.2006.08.065. [DOI] [PubMed] [Google Scholar]
- 16.Wijndaele K, Beunen G, Duvigneaud N, Matton L, Duquet W, Thomis M, Lefevre J, Philippaerts RM. A continuous metabolic syndrome risk score: utility for epidemiological analyses. Diabetes Care. 2006;29:2329. doi: 10.2337/dc06-1341. [DOI] [PubMed] [Google Scholar]
- 17.Chen W, Srinivasan SR, Elkasabany A, Berenson GS. Cardiovascular risk factors clustering features of insulin resistance syndrome (Syndrome X) in a biracial (Black-White) population of children, adolescents, and young adults: the Bogalusa Heart Study. Am J Epidemiol. 1999;150:667–674. doi: 10.1093/oxfordjournals.aje.a010069. [DOI] [PubMed] [Google Scholar]
- 18.Alberti KG, Eckel RH, Grundy SM, Zimmet PZ, Cleeman JI, Donato KA, Fruchart JC, James WP, Loria CM, Smith SC., Jr Harmonizing the Metabolic Syndrome. A Joint Interim Statement of the International Diabetes Federation Task Force on Epidemiology and Prevention; National Heart, Lung, and Blood Institute; American Heart Association; World Heart Federation; International Atherosclerosis Society; and International Association for the Study of Obesity. Circulation. 2009 doi: 10.1161/CIRCULATIONAHA.109.192644. [DOI] [PubMed] [Google Scholar]
- 19.Magnussen CG, Venn A, Thomson R, Juonala M, Srinivasan SR, Viikari JS, Berenson GS, Dwyer T, Raitakari OT. The association of pediatric low- and high-density lipoprotein cholesterol dyslipidemia classifications and change in dyslipidemia status with carotid intima-media thickness in adulthood evidence from the cardiovascular risk in Young Finns study, the Bogalusa Heart study, and the CDAH (Childhood Determinants of Adult Health) study. J Am Coll Cardiol. 2009;53:860–869. doi: 10.1016/j.jacc.2008.09.061. [DOI] [PMC free article] [PubMed] [Google Scholar]
- 20.World Health Organization: Definition, Diagnosis and Classification of Diabetes Mellitus and its Complications; Part 1: Diagnosis and Classification of Diabetes Mellitus. Geneva, Switzerland: World Health Organization: Department of Noncommunicable Disease Surveillance; 1999. (WHO/NCD/NCS/99.2). [Google Scholar]
- 21.DeLong ER, DeLong DM, Clarke-Pearson DL. Comparing the areas under two or more correlated receiver operating characteristic curves: a nonparametric approach. Biometrics. 1988;44:837–845. [PubMed] [Google Scholar]
- 22.Pencina MJ, D'Agostino RB, Sr, D'Agostino RB, Jr, Vasan RS. Evaluating the added predictive ability of a new marker: from area under the ROC curve to reclassification and beyond. Stat Med. 2008;27:157–172. doi: 10.1002/sim.2929. discussion 207–112. [DOI] [PubMed] [Google Scholar]
- 23.Despres JP, Lemieux I. Abdominal obesity and metabolic syndrome. Nature. 2006;444:881–887. doi: 10.1038/nature05488. [DOI] [PubMed] [Google Scholar]
- 24.Frontini MG, Srinivasan SR, Berenson GS. Longitudinal changes in risk variables underlying metabolic Syndrome X from childhood to young adulthood in female subjects with a history of early menarche: the Bogalusa Heart Study. Int J Obes Relat Metab Disord. 2003;27:1398–1404. doi: 10.1038/sj.ijo.0802422. [DOI] [PubMed] [Google Scholar]
- 25.Chen X, Wang Y. Tracking of blood pressure from childhood to adulthood: a systematic review and meta-regression analysis. Circulation. 2008;117:3171–3180. doi: 10.1161/CIRCULATIONAHA.107.730366. [DOI] [PMC free article] [PubMed] [Google Scholar]
- 26.Porkka KV, Viikari JS, Åkerblom HK. Short-term intra-individual variation and long-term tracking of serum lipid levels in children: the Cardiovascular Risk in Young Finns Study. Atherosclerosis. 1994;105:63–69. doi: 10.1016/0021-9150(94)90008-6. [DOI] [PubMed] [Google Scholar]
- 27.Huang TT, Nansel TR, Belsheim AR, Morrison JA. Sensitivity, specificity, and predictive values of pediatric metabolic syndrome components in relation to adult metabolic syndrome: the Princeton LRC follow-up study. J Pediatr. 2008;152:185–190. doi: 10.1016/j.jpeds.2007.08.007. [DOI] [PMC free article] [PubMed] [Google Scholar]
- 28.Schubert CM, Sun SS, Burns TL, Morrison JA, Huang TT. Predictive ability of childhood metabolic components for adult metabolic syndrome and type 2 diabetes. J Pediatr. 2009;155:S6, e1–e7. doi: 10.1016/j.jpeds.2009.04.048. [DOI] [PMC free article] [PubMed] [Google Scholar]
- 29.Daniels SR, Greer FR. Lipid screening and cardiovascular health in childhood. Pediatrics. 2008;122:198–208. doi: 10.1542/peds.2008-1349. [DOI] [PubMed] [Google Scholar]
- 30.Gaziano TA, Young CR, Fitzmaurice G, Atwood S, Gaziano JM. Laboratory-based versus non-laboratory-based method for assessment of cardiovascular disease risk: the NHANES I Follow-up Study cohort. Lancet. 2008;371:923–931. doi: 10.1016/S0140-6736(08)60418-3. [DOI] [PMC free article] [PubMed] [Google Scholar]
- 31.Sims EAH. Insulin resistance is a result, not a cause of obesity. Socratic debate: the con side. In: Angel A, Anderson H, Bouchard C, editors. Progress in Obesity Research. Seventh International Congress on Obesity. London: Libby; 1996. pp. 587–592. [Google Scholar]
- 32.Ravussin E, Swinburn BA. Insulin resistance is a result, not a cause of obesity. Socratic debate: the pro side. In: Angel A, Anderson H, Bouchard C, editors. Progress in Obesity research. Seventh Internationa Congress on Obesity. London: Libby; 1996. pp. 173–178. [Google Scholar]
- 33.Srinivasan SR, Myers L, Berenson GS. Temporal association between obesity and hyperinsulinemia in children, adolescents, and young adults: the Bogalusa Heart Study. Metabolism. 1999;48:928–934. doi: 10.1016/s0026-0495(99)90231-7. [DOI] [PubMed] [Google Scholar]
- 34.Srinivasan SR, Myers L, Berenson GS. Predictability of childhood adiposity and insulin for developing insulin resistance syndrome (syndrome X) in young adulthood: the Bogalusa Heart Study. Diabetes. 2002;51:204–209. doi: 10.2337/diabetes.51.1.204. [DOI] [PubMed] [Google Scholar]
- 35.Magnussen CG, Raitakari OT, Thomson R, Juonala M, Patel DA, Viikari JS, Marniemi J, Srinivasan SR, Berenson GS, Dwyer T, Venn A. Utility of currently recommended pediatric dyslipidemia classifications in predicting dyslipidemia in adulthood: evidence from the Childhood Determinants of Adult Health (CDAH) study, Cardiovascular Risk in Young Finns Study, and Bogalusa Heart Study. Circulation. 2008;117:32–42. doi: 10.1161/CIRCULATIONAHA.107.718981. [DOI] [PubMed] [Google Scholar]
- 36.Eisenmann JC. On the use of a continuous metabolic syndrome score in pediatric research. Cardiovasc Diabetol. 2008;7:17. doi: 10.1186/1475-2840-7-17. [DOI] [PMC free article] [PubMed] [Google Scholar]
Associated Data
This section collects any data citations, data availability statements, or supplementary materials included in this article.