Abstract
Histopathology forms the gold standard for the diagnosis of breast cancer. Fourier Transform Infrared (FT-IR) spectroscopic imaging has been proposed to be a potentially powerful adjunct to current histopathological techniques. Most studies using FT-IR imaging for breast tissue analysis have been in the transmission or transmission-reflection mode, in which the wavelength and optics limit the data to a relatively coarse spatial resolution (typically, coarser than 5 μm × 5 μm per pixel). This resolution is insufficient to examine many histologic structures. Attenuated Total Reflectance (ATR) FT-IR imaging incorporating a Germanium optic can allow for a four-fold increase in spatial resolution due to the material's high refractive index in the mid-IR. Here, we employ ATR FT-IR imaging towards examining cellular and tissue structures that constitute and important component of breast cancer diagnosis. In particular, we resolve and chemically characterize endothelial cells, myoepithelial cells and terminal ductal lobular units. Further extending the ability of IR imaging to examine sub-cellular structures, we report the extraction of intact chromosomes from a breast cancer cells and their spatially localized analysis as a novel approach to understand changes associated with the molecular structure of DNA in breast cancer.
Keywords: Fourier-transform infrared spectroscopy, Attenuated total reflection, Breast cancer, Tissue imaging, DNA, cells
1. Introduction
Breast cancer is the most commonly diagnosed cancer, after skin cancers, in females in the US. It is estimated that there will be 230,480 new cases of breast cancer in the US in 2011, with an additional 57,650 new cases of in situ disease [1]. Earlier detection and improved treatment have led to a steady decrease in breast cancer death rates; the disease, however, remains the second leading cause of cancer related deaths of women in the US [1]. The functional parts of the breast are the glandular lobules and ductal structures which are lined with epithelial cells. The lobules are milk-producing glands and the ducts are tubular structures which carry milk from the ductal glands to the nipple. Most breast cancers typically arise from the epithelial cells lining either the ducts (ductal carcinoma) or the lobules (lobular carcinoma). In cases of suspected breast cancer, a biopsy is taken. To be of diagnostic value, the biopsy must sample tissue that includes both ducts and lobules. The visual examination Terminal Ductal Lobular Units (TDLUs) is especially critical for accurate diagnoses of invasive cancers. Approximately 85% of non-invasive or localized cancers are also ductal in origin and are termed ductal carcinoma in situ (DCIS). In both cases, recognition of epithelial cells and their patterns is important. To accurately differentiate between DCIS and an invasive breast cancer, an examination of the presence or absence of myoepithelial cells is required, which can be visualized by P63 staining [2].
Histopathology represents the gold standard for breast tissue diagnosis, however suffers from being subjective, time consuming, expensive and laborious. The process of histologic examinations involves fixing, embedding, sectioning and staining tissues with a panel of stains to allow for tissue visualization and cell type identification. Identification typically involves an experienced pathologist examining the stained tissues to identify cells types and tissue structures which may be indicative of breast cancer. FT-IR spectroscopic imaging has shown great potential at being a powerful adjunct to current histopathological approaches [3–5]. FT-IR imaging combines the spatial specificity of microscopy with the chemical selectivity of spectroscopy. Infrared spectral data acquisition in an imaging format provides a data cube with X and Y dimensions providing spatial information and the Z dimension providing spectral information. The spectral information, in turn, can be used to derive biomolecular information about the chemical composition of a tissue, such as levels and confirmations of proteins, DNA, RNA, collagen, glycogen and lipids. This molecular chemical information is then used to obtain images that provide contrast between different cell types or disease states. Following this process, FT-IR imaging can potentially allow for objective, quantitative and accurate diagnosis for a variety of tissue types and diseases. A number of recent reviews by us and other groups have discussed this process and a variety of applications in detail [6–8].
Transmission mode sampling is the most common experimental IR imaging configuration and is adequate for the correct classification of a majority of cell types and components in human tissues [4, 5, 9, 10]. In many cases, however, certain cell types and tissue structures that are critical to identify and chemically characterize breast cancers [10] cannot be recognized as they are smaller than the wavelength-limited resolution of transmission-mode IR imaging. As is well known, the spatial resolution of IR microscopy is limited by the diffraction limit of spectral wavelengths (λ=2.5–12.5μm). The Raleigh criterion governing spatial resolution states that object closer than a distance given by 1.22 λ / 2(NA) cannot be resolved, where NA is the numerical aperture. NA is determined by n sin θ, with n being the refractive index. In transmission-mode microscopy where NA are typically in the range of 0.4 to 0.8, a spatial resolution of approximately the wavelength can be achieved. As a compromise between the wavelength extremes determining resolution and to ensure high signal to noise ratio (SNR) data, commercial IR imaging instruments are designed with a sample pixel size of approximately 5 μm × 5 μm at best. It must be noted that the pixel spacing can be decreased to provide optimal sampling [11,12] (but the resolution cannot be increased) by using higher NA optics and a more powerful source. For example, the first diffraction limited imaging measurements of human breast and prostate tissue using a synchrotron source and IR microscope were demonstrated [10]. This approach incorporated a 74× objective with 12 high-flux IR beams from a synchrotron source to permit correct pixel size for true diffraction limited measurements using a very strict sampling criterion. This approach provides images of exceptional quality but is limited by the availability of synchrotron sources. The chemical specificity of information is also limited again by diffraction. A complete theoretical model of IR imaging explaining image formation and artifacts is available [13,14]. To summarize, many of the shortcomings of transmission mode sampling can be overcome by ATR imaging.
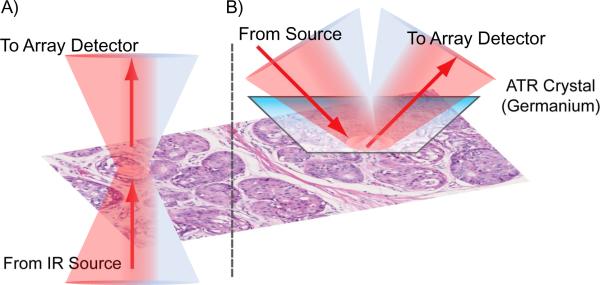
ATR FT-IR imaging principally represents an attractive approach for high resolution FTIR imaging. ATR FT-IR imaging incorporates a Solid Immersion Lens (SIL) (typically using a Germanium, ZnSe or diamond crystal) with a high refractive index which can allow for higher spatial resolution imaging due to a larger NA [15–17]. For example, the use of a Ge crystal can allow for imaging at a spatial resolution of 1.56 μm × 1.56 μm in ATR mode as opposed to 6.25 × 6.25 μm in transmission mode on one commercial system (Fig. 1). ATR imaging has been widely used by a number of groups, in particular by Kazarian et al. [7, 18–23]. Work by Sommer et al. also demonstrated that ATR imaging could allow for the analysis of kidney stones without being affected by strong scattering from specular reflection, Christiansen effect and restsrahlen effects which makes kidney stone analysis difficult in transflection mode [24, 25]. ATR FT-IR imaging has recently been shown by our group to allow for subcellular imaging in order to monitor chemical changes that occur in either the cytoplasm or the nucleus of fibroblast cells in response to exposure to growth factors [26]. Here, we apply ATR FT-IR imaging to examine whether the advantages associated with this technique, principally increased spatial resolution and reduced scattering artifacts, can allow for the identification and extraction of chemical information of these important cell types and structures in human breast tissues.
Fig. 1.
Schematic drawing of A) transmission-mode microscopy and B) ATR-mode microscopy for chemical imaging of breast tissue biopsies.
2. Materials and methods
2.1. Breast tissues
Breast tissue microarrays comprising of normal, hyperplasia, dysplasia and malignant breast tumors were obtained from the University of Illinois – Chicago and from Biomax (No. BR1003; US Biomax, Rockville, MD). These breast tissue microarrays are formalin-fixed and paraffin-embedded. One 5μm tissue section from each array was placed on a BaF2substrate for IR imaging and serial 5μm sections were placed on standard glass slides for hematoxylin and eosin (H&E) staining and immunohistochemical (IHC) staining. IHC staining was performed for CD31 and P63. Staining was performed using the Ventana Benchmark XT automated slide preparation system (Ventana Medical Systems, Tucson, AZ) and Ventana clinical protocols and reagents (XT UltraView DAB protocol; Ventana). Images of stained tissues were acquired using the Hamamatsu Nanozoomer microscope (Hamamatsu; Bridgewater, NJ).
2.2. Chromosomes extraction
MCF-7 cells were grown according to ATCC specifications as previously described [27]. At passage number 16, a 70% confluent T-75 flask of MCF-7 cells was treated with 0.5 μg/μl colcemid (Karyomax Colcemid solution, Invitrogen, Carlsbad CA) for 10 hours to arrest the cells during metaphase. The flask was tapped to remove mitotically active cells, which were centrifuged at low speed to gently pellet them before resuspending in a hypotonic solution of 0.4% KCl. This was incubated in a 37°C water bath for 25 minutes, which caused the cells to swell. The cells were then fixed in a 3:1 methanolacetic acid solution for 10 minutes and subsequently pelleted by centrifugation for 10 minutes at low speed. The fixation/centrifugation procedure was repeated 3 times, gently resuspending the cells in a new fixative solution each time. Fixation using 3:1 methanol-acetic acid solution does not cause protein cross-linking rather it removes lipids and dehydrates the cells.To fix the chromosomes to the slide, 10 μl of cell suspension was dropped from several inches onto a frozen aluminum slide. This causes the swollen nucleus to break and the chromosomes to spread out so that they can be analyzed individually. The aluminum slide was placed onto a warm heating plate until the slide was dry.
2.3. FT-IR imaging
IR spectroscopic imaging data were acquired using a Perkin Elmer Spotlight 400 imaging system (Perkin Elmer, Waltham, MA). FT-IR images were acquired in transmission and ATR imaging modes. ATR images were recorded with the Perkin Elmer Spotlight 400 ATR imaging adapter using a germanium crystal (Approx. 600 μm × 600μm). Data were collected over the nominal free-scanning spectral range and saved over 4000–750 cm−1, were recorded with an interferometer speed of 1.0 cm/s and collected using a linear MCT detector array. For transmission mode, spectral measurements were acquired with a pixel size of 6.25 × 6.25 μm at a spectral resolution of 4 cm−1. Background measurements were acquired on a region with no cells or tissue with 120 scans per pixel and 4 scans per pixel on the sample. In ATR mode, spectral images were acquired with a pixel size of 1.56 × 1.56 μm, with 4 scans per pixel at a spectral resolution of 8 cm−1. ATR images were acquired across a 400 × 400 μm region of the ATR crystal. The ATR crystal was gently placed in contact with the tissue using minimal pressure to ensure good contact and minimize tissue damage. In general, tissues were not damaged using this approach. Atmospheric correction was performed for all measurements and ATR and baseline offset correction algorithms were applied to the ATR data using the Perkin Elmer Spotlight software. All data was then exported to ENVI-IDL and all further computation was performed using in-house written programs.
2.4. FT-IR spectral data processing
All spectral data was baseline corrected by a multipoint linear baseline correction and normalized to the Amide I (1650 cm−1) absorbance peak. ATR data had noise and any crystal artifacts (such as dust and small scratches) removed by using Minimum Noise Fraction (MNF) using ENVI+IDL [28, 29]. Regions of Interest (ROI) are pixels which were marked manually using the ROI tool in ENVI+IDL and average absorbance ROI spectra were derived from identified pixels. Bayesian classification of breast tissue was performed as detailed previously [4, 9].
3. Results and discussion
3.1. Endothelial cells
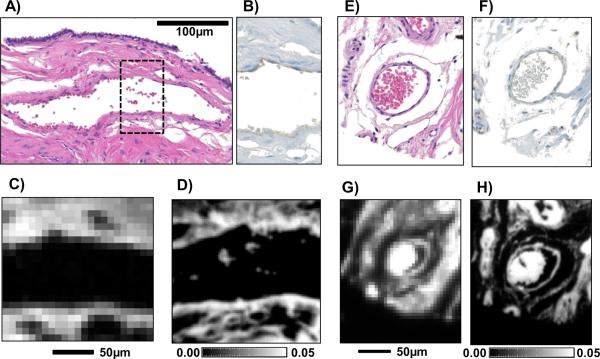
Blood vessels are lined by thin endothelial cells, which are the primary barrier between the blood and surrounding tissue. Growth of a breast tumor beyond a small localized lesion that requires an increase in blood supply which is provided by an increase in quantity of blood vessels in a tumor, in a process known as angiogenesis. The identification and quantification of blood vessels in cancers, hence, is an important metric for evaluating the growth rate of a breast tumor and its metastatic potential [30, 31]. Capillaries and small veins can often be too small (1 − 3μm) to be detected using transmission-mode IR imaging and previous work had demonstrated that small blood vessels could not be adequately classified due to the low spatial resolution. Changes in the chemical composition of endothelial cells has been a topic of interest due the importance of blood vessels involved in tumor growth and metastasis [32, 33]. Blood vessels from breast tissues were stained using H&E for visualization (Fig 2A,E) and the endothelial IHC marker CD31 (Fig 2B,F), with adjacent serial sections imaged using transmission (Fig 2C,G) and ATR modes (Fig 2D,H). Due to the stained tissue sections being from tissue sections adjacent to the IR images, the images may appear slightly different. Images of blood vessels from ATR data demonstrated that the improved spatial resolution permits a clear visualization of the endothelial cells as part of small blood vessels. The blood vessels imaged using ATR were, as expected, found to be chemically distinct from the surrounding stromal cells. This distinction is not apparent in transmission-mode data. Additionally, small red blood cells that were present in the lumen of the blood vessel (Fig 2D) could be resolved using absorbance images from ATR-mode data. This work demonstrates the potential for future work using ATR imaging for understanding the chemical changes that are associated with changes in small blood vessels during cancer angiogenesis.
Fig. 2.
Examples of two small blood vessels in breast tissue biopsies which have been stained for visualization in both visible microscopy and via IR absorption. A) and E) show the optical microscopic images of H&E-stained tissue. B) and F) show the presence of the antibody to CD31, an endothelial cell marker in which endothelial cells stain brown. C) and G) are the corresponding absorbance images obtained from data acquired in transmission mode while D) and H) are obtained from images acquired in ATR modefrom an adjacent tissue section. The absorbance of CH2 asymmetric vibrational mode at 2924cm−1 is employed to generate the IR images.
3.2. Myoepithelial cells
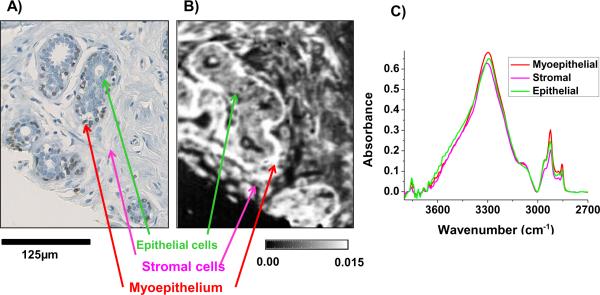
Myoepithelial cells are thin cells that surround epithelial cells in glandular tissue. In breast tissue, myoepithelial cells reside between epithelial cells and the surrounding stromal cells (Fig 3A). The presence or absence of these cells is a key determinant of whether a proliferation of epithelial cells in breast glands is benign or malignant. Myoepithelial cells are epithelial cells which stain for high molecular weight cytokeratins and alpha smooth muscle actin. Myoepithelial cells are routinely examined in breast histopathology using the IHC stain for P63 which is selective for myoepithelial cells as neither fibroblasts, myofibroblasts or epithelial cells are stained [2]. Myoepithelial cells are difficult to identify and chemically characterize in breast tissue using transmission-mode IR imaging as they are typically on the order of 2 to 4μm. In cases of high proliferation of epithelial cells in benign breast glands, the mass of epithelial cells within a gland can cause myoepithelial cells to be compressed and reduce their thickness even further down to 1 to 2μm. In transmission-mode data, it was not possible to classify myoepithelial cells accurately in breast tissue due to their small thickness. Thus, IR pixels assigned to these cells were dominated by a mix of epithelial and stromal spectral properties. This gave rise to a high number of false positives for the presence of myoepithelial cells when a myoepithelial class was included in the breast classification. Hence, the choice was to classify myoepithelial cells to either epithelial or stromal classes (ignoring the myoepithelial phenotype) or accept the misclassifications. ATR-mode imaging was applied to breast tissue biopsies which had serial sections stained with P63 (Fig 3A) to identify myoepithelial cells. Preliminary data demonstrate that myoepithelial cells can be visualized (Fig 3B) and were spectrally unique when compared to the surrounding epithelial and stromal cells (Fig 3C). The correct spectral recognition of myoepithelial cells enables accurate histology and is a crucial step in future classifiers focused on discrimination of benign and malignant breast lesions using myoepithelial cells' spectral properties or abundance.
Fig. 3.
A) IHC stain of P63 expression which identifies brown-stained myoepithelial cells residing between epithelial cells and stromal cells in a normal breast tissue gland. B) Absorbance image from an adjacent tissue section with cell type locations identified (CH2 asymmetric vibrational mode at 2924cm−1) obtained from ATR imaging data. C) Average spectra of the spectral region 3800 to 2700 cm−1 extracted from pixels associated with myoepithelial (463 pixels), stromal (6,000 pixels) and epithelial cells (987 pixels) demonstrate clear spectral differences between the cell types.
3.3. Terminal ductal lobular units
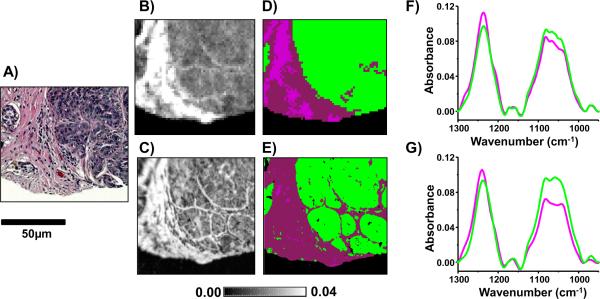
TDLUs are a key component of adequate biopsy sampling in breast tissues. TDLUs are the initial location of most breast cancers and these structures are critical to visualize and chemically characterize in the early events in breast cancer development. TDLUs in normal breast tissue are structured as small glands of ductal cells which are infiltrated by intralobular stroma (ILS). In normal or benign breast tissue these glands are discrete and can be clearly seen as individual units when stained by H&E (Fig 4A). In malignant breast cancer, these structures are lost and in its place is a mass of unstructured epithelial cells. To diagnose and understand the early events in breast cancer, it is thus critical to accurately image TDLUs and determine whether they are structured. Using transmission-mode imaging, due to the low spatial resolution, TDLUs units can frequently look unstructured and as a mass of epithelial cells (Fig 4B) and when classified using previous breast cell type classifiers are classified as a mass of epithelial cells (Fig 4D). The breast cell type classifier is an unpublished modified Bayesian classifier consisting of epithelial cells (green), myofibroblast rich stroma (wine) and fibroblast rich strong (magenta) built in a manner as previously described [4]. In this study we applied ATR-mode imaging to breast tissue biopsies; intralobular stroma could be clearly identified and TDLUs adequately visualized (Fig 4C). When the same breast cell type classifier was run, the intralobular stroma was accurately classified (Fig 4E). Furthermore, when spectra were extracted from the epithelial cells (green) and stromal cells (magenta), the ATR FT-IR images gave clearer spectral differences between these two cell types. The increased resolution afforded by ATR imaging can allow for the improved chemical contrast in particular with collagen absorbance peaks (between 1200 and 1300cm−1) between the epithelial cells which have low levels of collagen and the intralobular stroma which has increased levels of collagen.
Fig. 4.
A) Optical microscopy image of H&E-stained normal breast tissue terminal ductal lobular unit (TDLU). B) Transmission- and C) ATR imaging data were recorded on a serial section of the same TDLU from which the absorbance associated with collagen absorption at 1255cm−1 displays contrast. A cell type classifier was employed to D) transmission microscopy and E) ATR microscopy data in which epithelial cells are identified in green and stromal cells in magenta. Average spectra were extracted from the regions associated with the two cell types from the F) transmission (196 pixels for stroma and 260 pixels for epithelial cells) and G) ATR imaging data (1,271 pixels for stroma and 6,339 pixels for epithelial cells) to identify chemical differences between the cell types.
3.4. Breast cell chromosomes
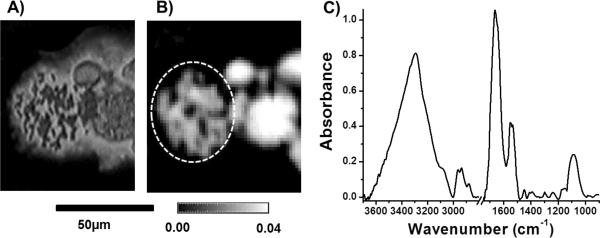
DNA is packaged within cells along with DNA bound proteins in structures called chromosomes. Epigenetic modifications to chromosomes and chromatin structures are becoming increasingly recognized as a key component of breast cancer development [34]. Much prior work has focused on using FT-IR to monitor changes in DNA in response to cancer and cell cycle changes but has focused on either DNA within intact cells or on extracted DNA [6, 8]. Measurements of DNA within cells may have contributions from other cellular components and thus observed chemical changes may not be due to DNA changes alone. There has also been a significant discussion about measuring DNA in intact cells using FT-IR and the role of hydration for detecting DNA absorbance [35, 36]. Alternatively, DNA can be extracted from cells; however, use of these extraction techniques may result in a loss of its chromatin structure. We sought to extract DNA in its native chromosomal structure and determine whether a spectrum could be recorded. Chromosomes were extracted from a breast cancer cell line (MCF-7) in a manner which allowed for them to remain in their native state. Visible images of the extract could allow for the visualization of the chromosomes (Fig. 5A). ATR FT-IR imaging allowed also for the identification of the chromosomal structure due to the increased resolution (Fig. 5B) and allowed for the extraction of spectra which had very little scattering artifacts due to using ATR sampling (Fig. 5C) [37]. Spectra extracted from the chromosomes (region highlighted by dotted white line, Fig. 5B) demonstrated the contribution of protein bound DNA by Amide I and Amide II absorbance as well as strong absorbance at the symmetric phosphate peak (1080 cm−1) which is associated with nucleic acids (Fig 5C). The twin spectral properties demonstrates that ATR imaging has the future potential to give chemical insight into chromosomes extracted from breast cells and may be very useful in examining the role of chromatin remodeling and epigenetic changes involved in breast carcinogenesis.
Fig. 5.
A) Visible images of chromosomes extracted from MCF-7 breast cancer cells. B) Absorbance image from ATR imaging data, plotted using the CH3asymmetric stretching vibrational mode at 2852cm−1, of the same chromosomes. C) An average spectrum of chromosomes extracted from dotted region of figure 5B (from 499 pixels).
4. Conclusions
ATR-mode IR imaging represents a useful approach that can allow for insight into morphologic and chemical changes that occur within breast tissue that would be unavailable using transmission-mode imaging. This paper demonstrates that the advantages of ATR FT-IR imaging, principally increased spatial resolution and reduction of scattering artifacts can be beneficial for breast tissue imaging. Whilst ATR has limited applications for clinical use due to requiring physical contact with tissues (which can result in tissue damage) and having a limited sampling area, it is a desirable approach for looking at breast tissue changes in appropriate detail, making it an excellent complement to other IR imaging approaches. This paper demonstrates that the use of ATR imaging can allow for the identification of three important components of breast tissue; endothelial cells, myoepithelial cells and TDLUs. Furthermore, ATR imaging permits the visualization of extracted chromosomes in their native state from breast cancer cell lines, demonstrating both protein and DNA contributions. Future work will involve applying ATR FT-IR imaging to tissues to gain new insight into cancer progression.
Acknowledgements
This study was supported by the Komen for the Cure (KG081426) and the National Institutes of Health (R01CA138882 and R01EB009745). S.E.H. received support from the Midwest Cancer Nano-technology Training Center, NIH National Cancer Institute Alliance for Nanotechnology in Cancer (grant R25 CA154015A).
Footnotes
Publisher's Disclaimer: This is a PDF file of an unedited manuscript that has been accepted for publication. As a service to our customers we are providing this early version of the manuscript. The manuscript will undergo copyediting, typesetting, and review of the resulting proof before it is published in its final citable form. Please note that during the production process errors may be discovered which could affect the content, and all legal disclaimers that apply to the journal pertain.
References
- [1].American Cancer Society . Cancer facts & figures 201. American Cancer Society; Atlanta: 2011. [Google Scholar]
- [2].Barbareschi M, Pecciarini L, Cangi M, Macri E, Rizzo A, Viale G, Doglioni C. Am. J. Surg. Pathol. 2001;25:1054–1060. doi: 10.1097/00000478-200108000-00010. [DOI] [PubMed] [Google Scholar]
- [3].Kwak JT, Hewitt SM, Sinha S, Bhargava R. BMC Cancer. 2011;11:62. doi: 10.1186/1471-2407-11-62. [DOI] [PMC free article] [PubMed] [Google Scholar]
- [4].Fernandez DC, Bhargava R, Hewitt SM, Levin IW. Nat. Biotechnol. 2005;23:469–474. doi: 10.1038/nbt1080. [DOI] [PubMed] [Google Scholar]
- [5].Bhargava R, Fernandez DC, Hewitt SM, Levin IW. Biochim. Biophys. Acta – Biomembranes. 2006;1758:830–845. doi: 10.1016/j.bbamem.2006.05.007. [DOI] [PubMed] [Google Scholar]
- [6].Walsh M, Bhargava R. NanoBiophotonics. McGraw-Hill; 2010. Infrared spectroscopic imaging: An integrative approach to pathology; p. 201. [Google Scholar]
- [7].Kazarian SG, Chan KLA. Appl. Spectrosc. 2010;64:135A–152A. doi: 10.1366/000370210791211673. [DOI] [PubMed] [Google Scholar]
- [8].Matthaus C, Bird B, Miljkovic M, Chernenko T, Romeo M, Diem M. Methods Cell Biol. 2008;89:275–308. doi: 10.1016/S0091-679X(08)00610-9. [DOI] [PMC free article] [PubMed] [Google Scholar]
- [9].Bhargava R. Anal. Bioanal. Chem. 2007;389:1155–1169. doi: 10.1007/s00216-007-1511-9. [DOI] [PubMed] [Google Scholar]
- [10].Nasse MJ, Walsh MJ, Mattson EC, Reininger R, Kajdacsy-Balla A, Macias V, Bhargava R, Hirschmugl CJ. Nat. Methods. 2011;8:413–416. doi: 10.1038/nmeth.1585. [DOI] [PMC free article] [PubMed] [Google Scholar]
- [11].Reddy RK, Walsh MJ, Schulmerich MV, Carney PS, Bhargava R. Under review. Appl. Spectrosc. 2011 doi: 10.1366/11-06568. [DOI] [PMC free article] [PubMed] [Google Scholar]
- [12].Stelzer EHK. J. Microsc. 1998;189:15–24. [Google Scholar]
- [13].Davis BJ, Carney PS, Bhargava R. Anal. Chem. 2010;82:3474–3486. doi: 10.1021/ac902067p. [DOI] [PubMed] [Google Scholar]
- [14].Davis BJ, Carney PS, Bhargava R. Anal. Chem. 2010;82:3487–3489. doi: 10.1021/ac902068e. [DOI] [PubMed] [Google Scholar]
- [15].Sommer AJ, Tisinger LG, Marcott C, Story GM. Appl. Spectrosc. 2001;55:252–256. [Google Scholar]
- [16].Patterson BM, Havrilla GJ, Marcott C, Story GM. Appl. Spectrosc. 2007;61:1147–1152. doi: 10.1366/000370207782596969. [DOI] [PubMed] [Google Scholar]
- [17].Ippolito SB, Goldberg BB, Ünlü MS. Appl. Phys. Lett. 2001;78:4071–4073. [Google Scholar]
- [18].Kazarian SG, Chan KL. Biochim. Biophys. Acta. 2006;1758:858–67. doi: 10.1016/j.bbamem.2006.02.011. [DOI] [PubMed] [Google Scholar]
- [19].Andrew Chan KL, Kazarian SG. J. Biomed. Opt. 2007;12:044010. doi: 10.1117/1.2754686. [DOI] [PubMed] [Google Scholar]
- [20].Boncheva M, Tay FH, Kazarian SG. J. Biomed. Opt. 2008;13:064009. doi: 10.1117/1.3006072. [DOI] [PubMed] [Google Scholar]
- [21].Kuimova MK, Chan KL, Kazarian SG. Appl. Spectrosc. 2009;63:164–171. doi: 10.1366/000370209787391969. [DOI] [PubMed] [Google Scholar]
- [22].Andanson JM, Hadgraft J, Kazarian SG. J. Biomed. Opt. 2009;14:034011. doi: 10.1117/1.3130324. [DOI] [PubMed] [Google Scholar]
- [23].Andanson JM, Chan KL, Kazarian SG. Appl. Spectrosc. 2009;63:512–517. doi: 10.1366/000370209788347011. [DOI] [PubMed] [Google Scholar]
- [24].Gulley-Stahl HJ, Bledsoe SB, Evan AP, Sommer AJ. Appl. Spectrosc. 2010;64:15–22. doi: 10.1366/000370210792966161. [DOI] [PMC free article] [PubMed] [Google Scholar]
- [25].Gulley-Stahl HJ, Haas JA, Schmidt KA, Evan AP, Sommer AJ. Appl. Spectrosc. 2009;63:759–766. doi: 10.1366/000370209788701044. [DOI] [PMC free article] [PubMed] [Google Scholar]
- [26].Holton SE, Walsh MJ, Bhargava R. Analyst. 2011;136:2953–2958. doi: 10.1039/c1an15112f. [DOI] [PMC free article] [PubMed] [Google Scholar]
- [27].Holton SE, Walsh MJ, Kajdacsy-Balla A, Bhargava R. Biophys. J. 2011;101:1513–1521. doi: 10.1016/j.bpj.2011.07.055. [DOI] [PMC free article] [PubMed] [Google Scholar]
- [28].Bhargava R, Wang SQ, Koenig JL. Appl. Spectrosc. 2000;54:486–495. [Google Scholar]
- [29].Reddy RK, Bhargava R. Analyst. 2010;135:2818–2825. doi: 10.1039/c0an00350f. [DOI] [PubMed] [Google Scholar]
- [30].Weidner N, Semple JP, Welch WR, Folkman J. N. Engl. J. Med. 1991;324:1–8. doi: 10.1056/NEJM199101033240101. [DOI] [PubMed] [Google Scholar]
- [31].Folkman J. Nat. Med. 1995;1:27–31. doi: 10.1038/nm0195-27. [DOI] [PubMed] [Google Scholar]
- [32].Carmeliet P, Jain R. Nature. 2000;407:249–257. doi: 10.1038/35025220. [DOI] [PubMed] [Google Scholar]
- [33].Wehbe K, Pinneau R, Moenner M, Deleris G, Petibois C. Anal. Bioanal. Chem. 2007;392:129–135. doi: 10.1007/s00216-008-2230-6. [DOI] [PubMed] [Google Scholar]
- [34].Kouzarides T. Cell. 2007;128:693–705. doi: 10.1016/j.cell.2007.02.005. [DOI] [PubMed] [Google Scholar]
- [35].Whelan DR, Bambery KR, Heraud P, Tobin MJ, Diem M, McNaughton D, Wood BR. Nucleic Acids Res. 2011;39:5439–5448. doi: 10.1093/nar/gkr175. [DOI] [PMC free article] [PubMed] [Google Scholar]
- [36].Mohlenhoff B, Romeo M, Diem M, Wood BR. Biophys. J. 2005;88:3635–3640. doi: 10.1529/biophysj.104.057950. [DOI] [PMC free article] [PubMed] [Google Scholar]
- [37].Davis BJ, Carney PS, Bhargava R. Anal. Chem. 2011;83:525–532. doi: 10.1021/ac102239b. [DOI] [PubMed] [Google Scholar]


