

Abstract
Non-invasive detection of transplanted cells in damaged organs and longitudinal follow up of cell fate and graft size is important for evaluation of cell therapy. We previously showed that overexpression of the natural iron storage protein, ferritin, permitted detection of engrafted cells in the mouse heart by MRI, but further imaging optimization is required. Here, we report a systematic evaluation of ferritin-based stem cell imaging in infarcted mouse hearts in vivo using three cardiac-gated pulse sequences in a 3T scanner: black-blood proton density weighted turbo spin echo (PD TSE BB), bright-blood T2* weighted gradient echo (GRE), and black-blood T2* weighted GRE with improved motion-sensitized driven equilibrium (iMSDE) preparation. Transgenic C2C12 myoblast grafts overexpressing ferritin did not change MRI contrast in the PD TSE BB images, but they showed a 20% reduction in signal intensity ratio in T2*-weighted black-blood iMSDE (p<0.05) and a 30% reduction in T2*-weighted bright-blood GRE (p<0.0001). Graft size measurements by T2* iMSDE and T2* GRE were highly correlated with histological assessments (r=0.79 and r=0.89, correspondingly). Unlabeled wild-type C2C12 cells transplanted to the mouse heart did not change MRI signal intensity, although endogenous hemosiderin was seen in some infarcts. These data support the use of ferritin for tracking survival, growth and migration of stem cells transplanted into the injured heart.
Keywords: Cellular and molecular cardiovascular imaging, cell tracking, animal model study
INTRODUCTION
Cardiovascular diseases take more lives every year than any other major cause of death, including cancer and HIV. Extensive loss of cardiomyocytes due to infarction, as well as the extremely low regenerative capability of the heart, are the main causes of heart failure. Cardiac regeneration based on transplantation of stem cell derivates is a rapidly developing area of research with high potential for clinical applications (1). Noninvasive imaging technology is a key component for accurate localization of transplanted cells and tracking graft changes over time.
Until recently, histology was the only reliable method to detect transplanted cells. Among non-invasive imaging modalities, MRI provides the highest spatial resolution and the most anatomic and physiologic information on deep tissue. However, visualization of transplanted tissues remains challenging, because the new tissue has insufficient endogenous contrast relative to the host tissue. To date, grafted cells can be distinguished from the host tissue by MRI only by introduction of a magnetic label to cells prior transplantation. Cell labeling by superparamagnetic iron oxide particles is a robust method providing strong signal-void effect on MRI (2–4), but this technique does not reflect live, proliferating grafts, but rather detects particles themselves, even if those particles were released from dead cells into surrounding tissues (5, 6).
A novel approach for transplanted cell imaging is genetic modification of cells in vitro to induce expression of reporter gene coding for MRI detectable probes. The use of the endogenous iron storage protein, ferritin, as a tool to visualize gene expression was described in 2003 by Dr. Ahrens (7). Ferritin is a globular protein that can be considered an “endogenous nanoparticle”. It is a ubiquitous intracellular protein that stores iron in a non-toxic form and releases it in a controlled fashion, thereby maintaining iron homeostasis and preventing free radical formation by the Fenton reaction (8). If the intracellular level of ferritin is genetically altered, the higher number of ferritin complexes per cell cause higher iron accumulation, thus directly affecting MRI contrast (7). Overexpression of ferritin for MRI visualization of transplanted cells has been proposed by Neeman et al. (9) and Ahrens et al. in 2005 (10). Several studies have shown that ferritin overexpression increases intracellular iron content and transverse relaxation rates of tumor cells in vitro and in vivo (9, 11, 12). Ferritin overexpression was detected in utero in transgenic mice (13) and liver hepatocytes (14). A ferritin shell was used in materials science as a precursor for making nano-composite particles as an effective MRI contrast agent for macrophage tracking (15) and for non-invasive imaging of atherosclerosis (16).
We recently demonstrated the feasibility of MRI detection of cardiac grafts overexpressing ferritin (17). The next step in preclinical testing of this promising approach is the design of an optimal imaging protocol and evaluation of different MRI sequences as tools for detection and morphological measurements of ferritin-labeled grafts in vivo. Toward this overall goal, this study aimed to investigate contrast properties of grafts overexpressing ferritin in bright- and black-blood cardiac imaging sequences similar to those used in human cardiac MRI. Further aims of this study were to quantify MRI signal intensity changes in transgenic grafts overexpressing ferritin in the infarcted mouse heart for the above sequences and to identify an optimal MRI sequence for visualization of ferritin-labeled cardiac grafts.
More specifically, we have chosen three imaging techniques to compare. The first is the standard bright-blood cine gradient-echo (GRE) imaging sequence, which is an essential technique in the majority of cardiac imaging protocols. Based on the choice of the echo time (TE), this technique can enable T2*-weighted contrast, which is beneficial for graft detection. The second technique is a widely used black-blood sequence based on the double inversion-recovery (DIR) magnetization preparation (18) combined with fast spin-echo (FSE) signal readout (19). The DIR blood suppression method achieves effective elimination of the blood signal by applying two consecutive inversion pulses (non-selective and slice-selective) followed by the delay corresponding to the zero-crossing point on the curve of blood magnetization recovery (18). The DIR-FSE sequence (19) is currently recognized as an essential approach for accurate evaluation of cardiac morphology. The third sequence is a new black-blood imaging method based on the motion-sensitized driven equilibrium (MSDE) preparation, which has been recently improved (iMSDE) (20). In the iMSDE technique, the blood suppression effect is achieved via generating two consecutive spin echoes in the presence of flow-dephasing gradients, followed by restoring magnetization with a flip-back pulse (20).The key advantage of the iMSDE technique is its time efficiency, since the preparation period in MSDE requires much shorter time than that in the DIR sequence. It also has been demonstrated that MSDE blood suppression is more effective than DIR for elimination of slow-flow artifacts (21). For the purposes of this study, the iMSDE technique is of particular interest, since it allows combination with a fast cardiac-gated cine GRE sequence, thus enabling black-blood imaging with T2*-weighted contrast.
MATERIALS AND METHODS
Ferritin overexpression
The murine ferritin heavy-chain cDNA was ligated into the pcDNA3 vector plasmid downstream of the cytomegalus virus (CMV) promoter. Mouse skeletal myoblasts (C2C12 cells) were transduced with pcDNA3-ferritin cDNA using FuGENE6 transfection reagent (Roche Applient Science, Indianapolis, IN). Transduced C2C12 cells were cultured on gelatin-coated 150 mm tissue culture dishes in growth medium (DMEM, Invitrogen) supplemented with 20% fetal bovine serum (HyClone, Logan, UT), 2 mM L-glutamine (Invitrogen) and penicillin/streptomycin. Neomycin (G418) was added to the cell culture media at 1.2 mg/mL to select for stably transduced cells.
Expression of ferritin was detected by Western blot analysis with rabbit monoclonal antibody to ferritin, 1:2000 dilutions (cat# ab75973, Abcam Inc, Cambridge, MA) and by immunohistochemical staining of C2C12 cells embedded in Histogel using rabbit polyclonal antibody to ferritin (cat#71562, Abcam, Cambridge, MA). Histogel sections were developed with 3,3-diaminobenzidine (DAB; Sigma), and counterstained with hematoxylin (Sigma). Prussian blue staining (20% aqueous solution of HCl and 10% of aqueous solution of Potassium Ferrocyanide, 1:1) was used to detect iron accumulation in cytoplasm. Due to low iron content in the standard cell growth media (DMEM) ferric citrate water solution (0.5 mM) was added to cell media 48 hours before Prussian blue staining to both wild type and ferritin-tagged cells.
Cell transplantation
All animal procedures were approved by the University of Washington (Seattle, WA) Institutional Animal Care and Use Committee and performed in accordance with federal guidelines. To minimize immunological rejection of engrafted cells we chose C3H mice as recipients for cell transplantation, since the C2C12 myoblast line was originally derived from this mouse strain (22). Mice were anesthetized by intraperitoneal injection of 2.5% Avertin (Phoenix Pharmaceuticals; 0.02–0.026ml/g), intubated and mechanically ventilated with supplemental oxygen and 3 cm H2O of positive end-expiratory pressure (PEEP). The heart was exposed via an open thoracotomy and subjected to myocardial injury by permanent ligation of the left anterior descending artery by 8-0 Prolene suture. After verification that coronary occlusion had occurred (blanching of the tissue distal to the suture), 5×10⁵ C2C12 cells suspended in 7 µl of serum/antibiotics-free medium were injected into the border of infarcted region of the left ventricle in two injection sites using a 30-gauge needle. Thirteen syngeneic C3H mice received 5×10⁵ C2C12 cells overexpressing ferritin and six animals received wild type unlabeled C2C12 cells (control). The mouse chest was then closed aseptically. Animals recovered from surgery in a heated chamber.
MRI protocol
One month after surgery, all animals were imaged in vivo on a 3T Philips Achieva 3T MRI scanner (42 cm horizontal bore, gradient strength 80 mT/m) using a single-channel solenoid mouse coil (Philips Research Laboratories, Hamburg, Germany) with a built-in heating system maintaining physiological body temperature. Animal sedation was induced by the inhalation agent isoflurane (3% in oxygen) in an induction chamber; anesthesia was maintained during imaging session by 1% isoflurane in oxygen (flow rate 1 liter/min) delivered through a nose cone. The Small Animal Monitoring and Gating System (SA Instrument Inc., Stony Brook, NY) was used for physiological monitoring of heart rate, respiration and body temperature. The electrocardiogram (ECG) of the mouse heart was recorded using needle electrodes attached to the animals’ extremities subcutaneously. MRI acquisitions were triggered by R-peaks of ECG.
The imaging protocol included three ECG-gated sequences applied in the short-axis plane with 1 mm slice thickness providing whole-heart coverage. To obtain high resolution in vivo MR images of the mouse heart, we used ECG-gated proton-density weighted black-blood double inversion-recovery turbo spin echo (PD TSE BB) multislice sequence (TE 10 ms; TR ~ 1100–1200 ms dependent of the heart rate, matrix 248×245; flip angle 90°; field of view 50×50 mm; 4 signal averages, image resolution 202×204 µm). The PD TSE BB sequence allowed clear delineation of the left ventricle borders in the mouse heart and excellent blood suppression.
To detect iron accumulated in the overexpressed ferritin complexes bright- and black-blood T2*-weighted sequences were tested. Bright-blood imaging was performed using used T2* weighted cine gradient echo (GRE) multislice sequence (TR/TE = 14/9 ms; slice thickness 1mm; flip angle 15°; echo train length 1; field of view 50×50 mm, matrix 200×198; 6 signal averages, image resolution 250×250 µm).
For black-blood imaging of transgenic grafts a recently introduced (20) improved motion sensitized driven equilibrium (iMSDE) preparative sequence was executed prior to the GRE imaging sequence. The advantage of this MRI sequence for visualization of iron accumulation is the presence of a T2*-prepulse along with a good suppression of blood flow and improved soft-tissue signal-to-noise and contrast-to-noise ratio values. iMSDE preparation parameters: gradient amplitude 12 mT/m, first gradient moment 500 mT.ms2/m and slew rate 100 mT/(m.ms). The imaging parameters were as follows: TR/TE=16/8ms; flip angle 13°; slice thickness 1 mm, field of view 50×50 mm, 8 signal averages, image resolution 298×303 µm.
Image analysis
The following formulas were used to quantify MRI signal intensity changes in the transgenic grafts. Graft-to-myocardium signal intensity ratio (SIR) was calculated as the ratio of signal intensities (SI) from in vivo MRI using regions of interest centered in the middle of the graft and in the non-infarcted area of the left ventricle (LV).
Signal-to-noise ratio (SNR) was calculated as the ratio of SI of the region of interest centered in the left ventricle wall (SILV) of the mouse heart, or at the area of graft (SIgraft), and a standard deviation of noise in background air.
Contrast-to-noise ratio (CNR) was calculated as the difference between SNR of the non-infarcted area of the left ventricle and SNR of the graft area.
The area of signal hypointensity was manually delineated in each MR image at the short-axis plane of the heart using the image analysis software NIH ImageJ 1.43u. Graft size was expressed as a ratio of graft area to the total left ventricle (LV) area in each slice of the mouse heart.
Histological Analysis
Animals were euthanized by a lethal dose of pentobarbital. Hearts were fixed in methyl Carnoy’s solution and processed for histological analysis. The whole mouse heart was sectioned in the short-axis for histological staining: eight tissue sections (five-micrometers thick) were cut at each millimeter of the heart to match MRI short-axis images of the mouse heart. Established histological and immunohistochemical methods were used to validate MRI assessment of infarct size, graft location and ferritin accumulation at the cardiac tissue. Picrosirius red (collagen-specific)/fast green staining was used to define the infarct zone. Skeletal muscle grafts in mouse hearts were identified using a mouse monoclonal antibody against embryonic skeletal myosin heavy chain (hybridoma supernatant, 1:100, Developmental Studies Hybridoma Bank, University of Iowa). Sections were blocked with 1.5% normal goat serum in PBS and incubated for 1 hr at room temperature with the biotinylated primary antibody (Animal Research Kit, Dako). Sections were then incubated for 30 min at room temperature with HRP-conjugated streptavidin (Dako), developed with 3,3-diaminobenzidine (DAB; Sigma), and counterstained with hematoxylin (Sigma). Prussian Blue staining (20% aqueous solution of HCl and 10% of aqueous solution of Potassium Ferrocyanide,1:1) was used for detection of iron deposition in cardiac tissue.
Immunohistochemical staining with a rabbit polyclonal antibody to ferritin (cat#71562, Abcam, Cambridge, MA) was used to detect ferritin accumulation in the MC-fixed and paraffin-embedded mouse hearts. Primary ferritin antibody was used at the manufacturer-recommended concentration of 1 µg/µl; secondary biotinylated goat anti-rabbit antibody was used at 1:500 dilutions (Animal Research Kit, Dako). Sections were developed with 3,3-diaminobenzidine (DAB; Sigma), and counterstained with hematoxylin (Sigma). Photographs of heart sections were taken with a QColor 3 Olympus digital camera and a Nikon Eclipse 80i microscope.
Statistical Analysis
Microsoft Excel and SPSS 12.0 statistical software were used for statistical analysis. Normality of distribution for each variable was assessed using one-sample Kolmogorov-Smirnov test (K–S test) and the sample frequency distribution was compared with a reference probability distribution. Group comparisons between ferritin-tagged and unlabeled wild type grafts were assessed by independent t-test for variables with unequal variances. Measurements obtained using different MRI sequences for the same group of animals were compared by paired t-test. Agreement between graft size measurements by MRI and histology (embryonic skeletal myosin staining) was assessed using Pearson’s correlation coefficient and Bland-Altman plots. The bias between two measurements was examined using the one-sample t-test for the differences between paired measurements. The limits of agreement were calculated as the mean difference ±1.96 standard deviations (SD) of the mean difference. Significance level was defined as p<0.05. Data in the text and table are presented as mean ± SD.
RESULTS
Confirmation of Ferritin Overexpression
We used several methods to confirm ferritin overexpression in transduced C2C12 cells. Western Blot analysis with a rabbit monoclonal antibody specific to ferritin detected high levels of ferritin in transduced cells (data not shown). Immunohistochemical staining with a ferritin antibody also detected a high level of ferritin overexpression, identified as brown areas of cytoplasm in transduced cells, but not in wild-type control (Figure 1). Prussian blue staining detected higher accumulations of iron in the cytoplasm of ferritin-tagged cells than in wild type control cells (Figure 1).
Figure 1. Confirmation of ferritin overexpression in transgenic C2C12 cells.
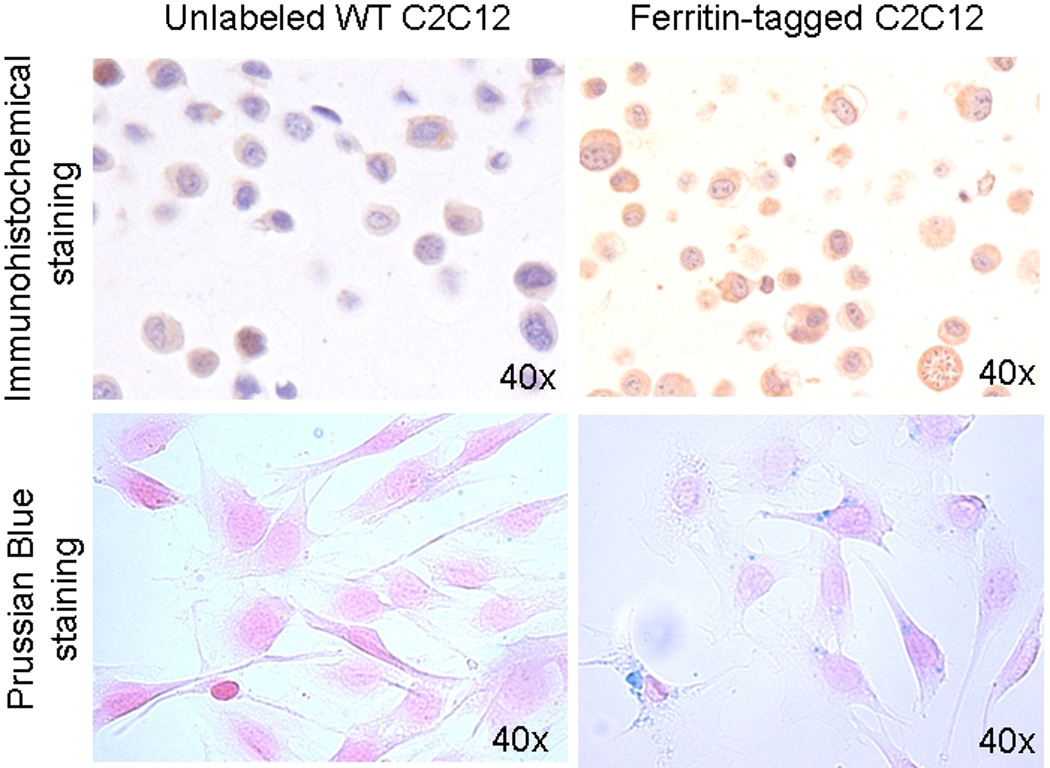
Immunohistochemical staining (top row) of the wild type C2C12 cells (left column) and transduced cells overexpressing ferritin (right column) embedded in histogel. Ferritin accumulation is detected as brown areas of cytoplasm (DAB development and hematoxylin counterstaining).
Prussian blue staining (bottom row) confirmed iron accumulation in cells overexpressing ferritin (blue areas in cytoplams), but not in wild-type unlabeled cells. To facilitate iron accumulation ferric citrate (0.5 mM) was added to both wild type and ferritin-tagged C2C12 media for 48 hours.
Histological Characterization of C2C12 Grafts in the Mouse Heart
Unlabeled wild-type C2C12 cells as well as transgenic C2C12 cells overexpressing ferritin formed large skeletal muscle grafts in the mouse heart. The presence of the grafts was confirmed by immunostaining for embryonic skeletal muscle myosin heavy chain (Figure 2: A4, B4). Both WT and ferritin-tagged mouse skeletal myoblasts were well differentiated into multinucleated myotubes that contained sarcomeres. There was no difference in size of the skeletal muscle grafts after transplantation of wild type C2C12 cells and ferritin-tagged cells to the mouse heart. Wild type graft size averaged in 21±12 % of the left ventricle; C2C12 grafts overexpressing ferritin composed 18±7 % of the left ventricle of the mouse heart. Both WT and ferritin-expressing graft regions showed dystrophic calcification and macrophage accumulation in the graft areas (data not shown). The calcification exceeded levels typically seen in non-engrafted hearts and likely resulted from acute death of the graft cells.
Figure 2. MRI detection of ferritin-tagged graft in the infarcted mouse heart.
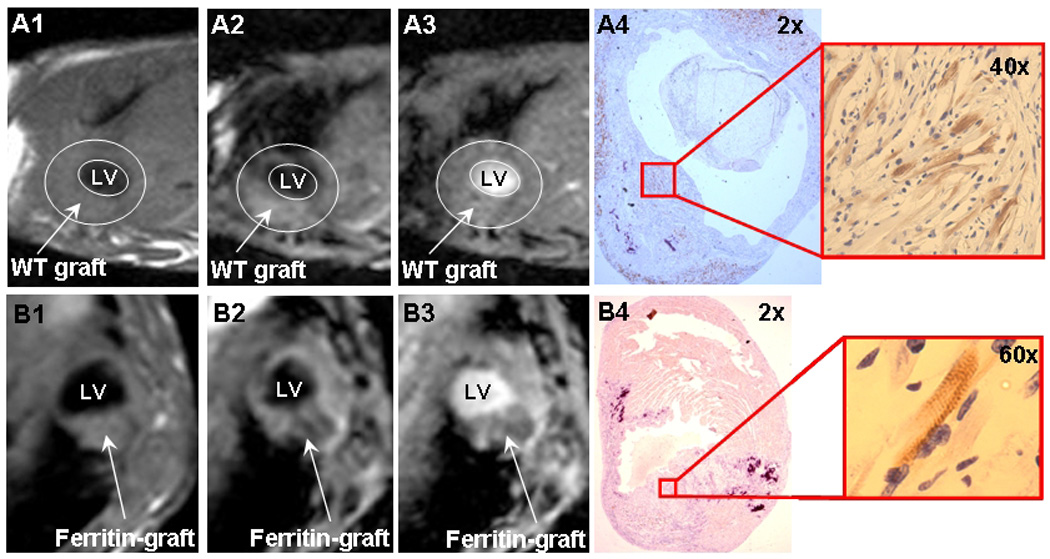
A1-4, unlabeled wild-type C2C12 graft.
B1-4, transgenic C2C12 graft overexpressing ferritin.
A1, B1, PD TSE black-blood sequence
A2, B2, T2* iMSDE black-blood sequence
A3, B3, T2* GRE bright-blood sequence
A4, B4, embryonic myosin immunostaining for graft detection.
LV: left ventricle.
MRI Detection of Ferritin-Tagged Graft in the Mouse Heart
Wild-type C2C12 grafts did not change MRI contrast in any of the MRI sequences used in this study (Figure 2); SIR of the wild-type C2C12 grafts was about 1, i.e., showing no difference from the surrounding myocardium (Table 1). Unlabeled skeletal muscle grafts in the mouse heart could only be detected by MRI as a considerable thickening of the left ventricle wall. No contractile activity was detected in areas of skeletal muscle graft by cine MRI, consistent with previous observations by echocardiography (23).
Table 1.
Quantification of signal intensity changes in transgenic C2C12 grafts overexpressing ferritin and in unlabeled wild-type grafts.
| WT graft (n=6) | Ferritin-tagged graft (n=13) | |||||
|---|---|---|---|---|---|---|
| SIR | SNRgraft | CNRgraft | SIR | SNRgraft | CNRgraft | |
| PD TSE BB | 1.0 ± 0.1 | 59.5±7.4 | −2.1±5.3 | 1.0 ± 0.1 | 46.1±21.1 | −1.3±6.6 |
| T2* iMSDE | 1.2 ± 0.4# | 33.2±6.6 | −1.8±6.7 | 0.8 ± 0.2#** | 19.7± 9.9 | 4.9±4.3 |
| T2* GRE | 1.0 ± 0.1## | 36.0±4.4 | 1.5±2.3 | 0.7 ± 0.1##** | 29.6±11.5 | 11.5±5.7## |
All values shown as mean ± standard deviation.
Statistically significant difference between ferritin-tagged and control groups in SIR measured using the same pulse sequence (independent t-test, unequal variances) is shown as # for p < 0.05, and ## for p < 0.0001.
Statistically significant difference from PD TSE BB in SIR measured in the same animal group (paired t-test) is shown as ** for p < 0.0001.
C2C12 grafts overexpressing ferritin also did not change tissue contrast in the PD TSE BB sequence (SIR=1.02). However, MRI signal intensity of ferritin-tagged grafts was significantly reduced when T2*-weighted GRE and T2*-weighted iMSDE sequences were used for graft detection (Figure 2B). Specifically, transgenic C2C12 grafts overexpressing ferritin reduced SIR by 30% in bright-blood GRE (mean SIR=0.7) and by 20% in black-blood iMSDE sequences (mean SIR=0.8). The SIR of transgenic grafts was significantly different from SIR of unlabeled control grafts (p<0.0001). All acquired MRI images were characterized by high signal-to-noise ratio, SNR (Table 1). T2*-weighted GRE images had the highest contrast-to-noise ratio (CNR) among all used sequences (p<0.0001).
Graft size evaluation by MRI and histology
To determine the optimal method of imaging the ferritin-overexpressing grafts, we compared graft size measurements using different MRI pulse sequences to the histological graft size as a gold standard. Only T2*-weighted iMSDE and T2*-weighted GRE MRI sequences were used for graft size measurements, since the PD TSE BB sequence did not provide sufficient contrast between graft and cardiac tissues.
The T2* bright-blood GRE and T2* black-blood iMSDE sequences provided similar graft size measurements, with no statistically significant difference detected (21.23±7.81 and 21.85±7.64 %, correspondingly, p=0.84). Both measurements were significantly correlated with histology, but a significantly stronger correlation was observed for the bright-blood GRE sequence (r=0.79 for T2*-weighted iMSDE, figure 3A and r=0.89 for T2*-weighted GRE, Figure 3B). Bland-Altman analysis indicated significant bias similar for both sequences (3.3±4.9, p= 0.01 for T2*-weighted iMSDE, figure 3C; and 3.0±3.6, p=0.04 for T2*-weighted GRE, figure 3D). This bias corresponds to approximately 10–15% overestimation of the graft size by MRI and may be explained by mild (20–30%) changes in contrast of ferritin-tagged grafts or by a slight extension of the region of signal attenuation beyond the anatomical boundaries of the ferritin-tagged grafts.
Figure 3. Correlation of the graft size measurements by MRI and histology.
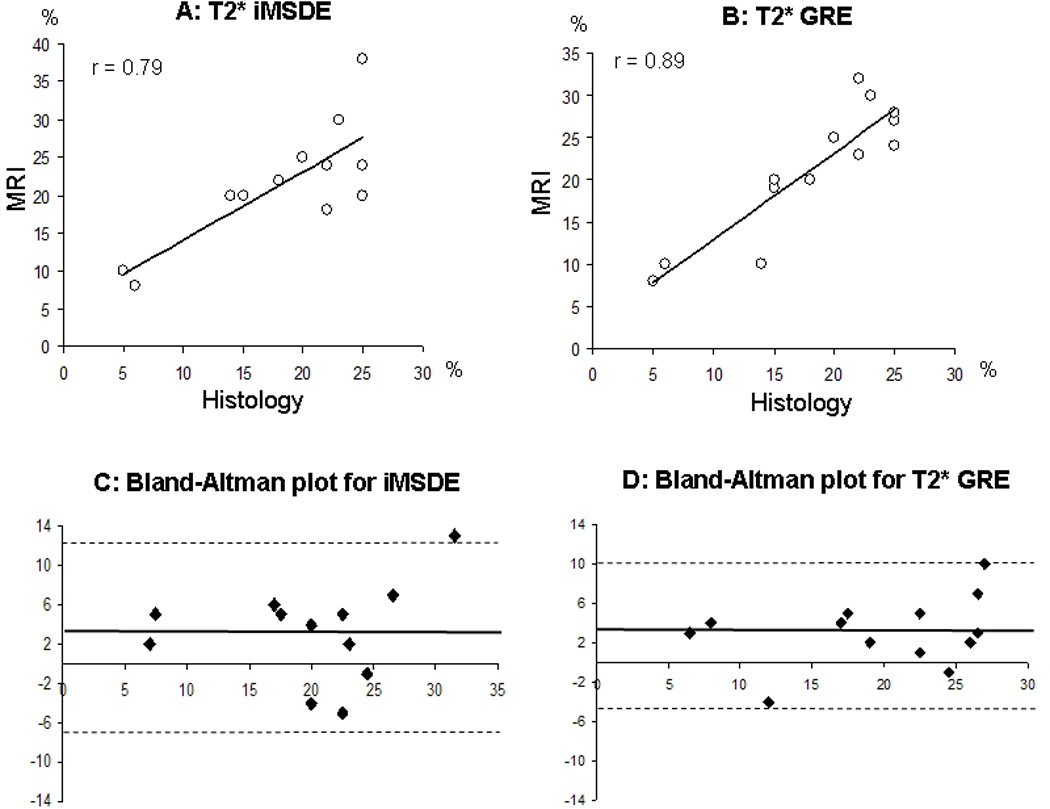
A, Correlation between measurements by T2* iMSDE and histology.
B, Correlation between measurements by T2* GRE and histology.
C, Bland-Altman plot for T2* iMSDE vs. histology measurements.
D, Bland-Altman plot for T2* GRE vs. histology measurements.
r, correlation coefficient.
Solid line on Bland-Altman plots is representing a mean difference of graft size estimated by MRI and histology.
Dashed lines represent 1.96% SD of mean differences in measurements.
DISCUSSION
Non-invasive detection of transplanted cells in the damaged organ and longitudinal follow up of cell fate and graft size is important for evaluation of cell therapy. Genetically overexpressed cell labels have significant advantages over standard particle-based approaches, because they permit longitudinal tracking of live dividing cells without dilution of the label. We recently demonstrated the feasibility of using ferritin overexpression for non-invasive MRI detection of cellular grafts in the infarcted heart (17). In this study we provide quantitative assessment of in vivo MRI signal properties of cardiac grafts overexpressing ferritin using a 3T clinical scanner.
The optimal MRI protocol for visualization and quantification of ferritin-tagged grafts in the mouse heart should include multiple sequences. The proton density weighted turbo-spin echo black blood (PD TSE BB) sequence provided the highest SNR and excellent blood suppression and was used for high resolution assessment of the mouse heart morphology. However, this sequence was not sensitive for detection of iron accumulation in overexpressed ferritin complexes, and signal intensities of ferritin-tagged grafts and unlabeled wild-type C2C12 grafts were essentially the same. Therefore, the PD TSE BB pulse sequence can only be used for evaluation of heart morphology, not for detection of ferritin-tagged grafts.
Black-blood and bright-blood T2* weighted MRI sequences were sensitive for detection of transgenic C2C12 grafts overexpressing ferritin. Quantification of MRI signal intensity changes showed 30% reduction of signal intensity in ferritin-tagged areas in T2* bright-blood GRE images and 20% in T2* black-blood iMSDE images. Furthermore, MRI allowed morphological graft size measurements with reasonable accuracy and precision, taking into account limitations of the histological approach itself, which may be subject to tissue deformation, shrinkage, and subsequent registration difficulties between imaging and histological sectioning planes.
It is important to note that the bright-blood T2* GRE images provided the highest CNR among all used sequences (Table 1) and enabled more precise graft size measurements. However, this sequence frequently suffers from signal non-uniformity and voids in the ventricles caused by complex flow patterns. It is advisable therefore to use bright-blood T2*-weighted GRE images in combination with black-blood images, allowing reliable localization of the cardiac wall. The use of a black-blood T2*-weighted technique could potentially provide an all-in-one solution, enabling both morphological information and the capability of graft measurements based on tissue contrast properties. However, graft contrast and precision of graft size measurements by the iMSDE black-blood sequence appeared inferior to those from the bright-blood sequence. This might be associated with a lower SNR for this sequence (Table 1). An iMSDE preparative sequence has been recently proposed for highly efficient blood signal suppression (20). This method has been shown to considerably improve the quality of blood suppression as compared to the standard double inversion-recovery technique, while enabling much better time-efficiency. However, iMSDE produces a rather strong effect on the static tissue signal, mainly due to the T2-weighting effect introduced by this preparative sequence (20, 24). While SNR loss in the iMSDE sequence appeared critical for morphological measurements in the current experimental setup (mouse imaging on a human whole-body scanner), this sequence also showed a good potential for graft imaging as evidenced by a significant signal decrease caused by ferritin (Table 1) and the clear visibility of grafts (Figure 3).
To date, several molecular biology approaches and different vectors have been used to overexpress ferritin: adenoviral (10, 25), retroviral (9), lentiviral (11, 26, 27) and adeno-associated virus gene delivery (27); different plasmid vectors have also been used (12, 28, 29). Our approach of ferritin overexpression employing pcDNA3 plasmid vector and FuGENE6 transfection reagent combines experimental simplicity and stable gene overexpression (17). It is worth emphasizing the fact that C2C12 cells overexpressing ferritin were not supplemented by iron before transplantation into the mouse heart, nor did the animal’s diet contain iron supplements. The fact that ferritin-tagged C2C12 grafts caused strong signal intensity loss one month after transplantation can be explained only by redistribution of endogenous iron and its accumulation from the host tissue in the overexpressed ferritin complexes of C2C12 grafts.
One limitation of ferritin-based imaging of tissue grafts, which generally pertains to any cell labeling strategies based on negative contrast, is that the signal void caused by iron accumulation is almost indistinguishable from that caused by hemosiderin. In normal conditions, ferritin provides a natural rapid mechanism to sequester excess iron intracellularly in a dispersed soluble form preventing elevation of hydroxyl-radical formation (8, 30, 31). With further increases in cytosolic iron, ferritin is collected in lysosomes (32, 33), where the ferritin shell denatures (34) and the iron core aggregates in insoluble masses of hemosiderin for long-term storage (33, 34). Under pathological conditions, the total amount of tissue iron can increase, and the proportion stored as hemosiderin rises, while the capacity of ferritin to store iron is overwhelmed (30, 31, 35). Therefore, overexpression of ferritin in transplanted cells might have a protective effect as a quick mechanism to prevent toxic effects of free iron in damaged tissues. However, the challenge for imaging of ferritin-tagged grafts is to distinguish their MRI signal changes from iron deposited in hemosiderin.
In this study, we occasionally observed hemosiderin deposition in the infarcted myocardial tissue of animals receiving WT cells; those areas were distinguishable by MRI as areas of hypointensity (Figure 4). This effect might be caused by enhanced ferritin content (36) or by hemosiderin deposition in damaged tissue (35, 37, 38). We compared localization and size of the signal void areas in MRI with histological data determining localization of C2C12 graft (embryonic myosin staining) and hemosiderin deposition (Prussian blue staining). In most of the studied cases large morphologically distinct skeletal muscle grafts were spatially isolated from areas of hemosiderin deposition; therefore signal void caused by hemosiderin did not affect SIR measured in C2C12 graft.
Figure 4. Iron deposition in hemosiderin in damaged tissues is causing signal void effect in T2*W GRE images.
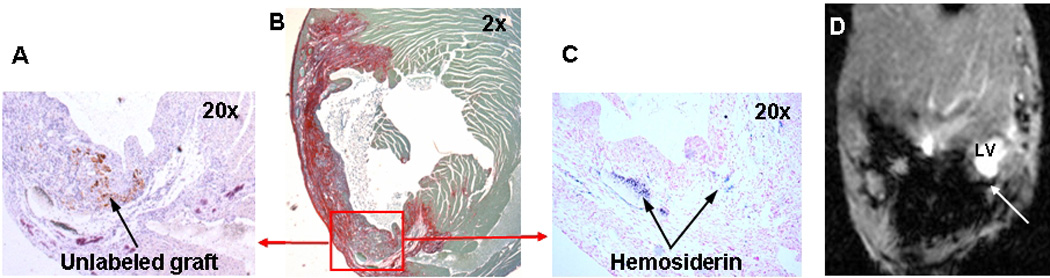
A, Embryonic myosin staining identifying area of unlabeled wild-type C2C12 graft (arrow).
B, Picrosirius red staining to identify infarcted areas
C, Prussian blue staining to detect iron accumulation in hemosiderin.
D, Hemosiderin (arrow) detected by T2*-weighted GRE of the mouse heart in vivo.
In future studies, however, careful interpretation of the areas of signal void must be provided, especially for small grafts that cannot be precisely identified by a known anatomical location. New technical approaches, such as analysis of non-monoexponential signal decay (39, 40) or phase-contrast imaging (41) might be helpful to distinguish different sources of signal void, though more research is necessary to identify the possibility of their applications in vivo.
CONCLUSION
Ferritin overexpression provides sufficient MRI contrast for detection of transduced cells in vivo in infarcted mouse hearts at 3T magnetic field strength. Ferritin-tagged grafts significantly decrease MRI signal intensity, creating areas of hypointensity in T2*-weighted MRI. The T2* bright-blood GRE sequence was most sensitive for imaging of transgenic grafts, capturing a 30% change in MRI signal intensity. Precise evaluation of the transgenic graft size in the mouse heart is possible using T2* black-blood and bright-blood sequences, those measurements are highly correlated with histology (r=0.79 for T2* iMSDE and r=0.89 for T2* GRE). We would expect even more effective visualization of ferritin-tagged grafts in higher magnetic field strengths, because transverse relaxivity (1/T2) linearly increases with increases in field strength (42, 43). One potential future application of this study is to use ferritin tagging to study graft survival and growth under conditions designed to prevent cell death and drive proliferation. A future challenge will be to distinguish iron accumulated in ferritin (dispersed, soluble iron) from iron deposited in hemosiderin (aggregated, insoluble iron) in damaged tissues.
ACKNOWLEDGEMENTS
We would like to thank Michal Neeman and Batya Cohen (Weizmann Institute, Israel) for providing HA-ferritin cDNA; Jennifer Deem for performing mouse surgery and cell transplantation; Merry Toh and Brian Johnson for valuable technical assistance with histological staining; Dan Hippe for statistical consultation; and Zach Miller for manuscript editing.
This work was supported by National Institutes of Health grants RC1 HL099230 (to CY and CEM), R01 HL64387 (to CEM), P01 HL094374 (to CEM), R01 HL084642 (to CEM), and the University of Washington Mouse Metabolic Phenotyping Center Grant U54 DK076126.
Abbreviations used
- GRE
gradient echo
- iMSDE
improved motion sensitized driven equilibrium
- PD TSE BB
proton density weighted turbo spin echo black-blood
- cDNA
complementary deoxyribonucleic acid
- CMV
cytomegalus virus
- HCl
hydrogen chloride
- DMEM
Dulbecco’s modified Eagle's medium
- DAB
3,3-diaminobenzidine
- PEEP
positive end-expiratory pressure
- ECG
electrocardiogram
- TR
repetition time
- TE
echo time
- SI
signal intensity
- SIR
signal intensity ratio
- LV
left ventricle
- SD
Standard Deviation
- r
correlation coefficient
- SNR
signal-to-noise ratio
- CNR
contrast-to-noise ratio
- PBS
phosphate buffered saline
- HRP
horseradish peroxidase
- WT
wild type.
REFERENCES
- 1.Laflamme MA, Murry CE. Heart regeneration. Nature. 2011;473(7347):326–335. doi: 10.1038/nature10147. [DOI] [PMC free article] [PubMed] [Google Scholar]
- 2.Bulte JW, Arbab AS, Douglas T, Frank JA. Preparation of magnetically labeled cells for cell tracking by magnetic resonance imaging. Methods Enzymol. 2004;386:275–299. doi: 10.1016/S0076-6879(04)86013-0. [DOI] [PubMed] [Google Scholar]
- 3.Bulte JW, Kraitchman DL. Monitoring cell therapy using iron oxide MR contrast agents. Curr Pharm Biotechnol. 2004;5:567–584. doi: 10.2174/1389201043376526. [DOI] [PubMed] [Google Scholar]
- 4.Shapiro EM, Sharer K, Skrtic S, Koretsky AP. In vivo detection of single cells by MRI. Magn Reson Med. 2006;55(2):242–249. doi: 10.1002/mrm.20718. [DOI] [PubMed] [Google Scholar]
- 5.Amsalem Y, Mardor Y, Feinberg MS, Landa N, Miller L, Daniels D, Ocherashvilli A, Holbova R, Yosef O, Barbash IM, Leor J. Iron-oxide labeling and outcome of transplanted mesenchymal stem cells in the infarcted myocardium. Circulation. 2007;116:I38–I45. doi: 10.1161/CIRCULATIONAHA.106.680231. [DOI] [PubMed] [Google Scholar]
- 6.Terrovitis J, Stuber M, Youssef A, Preece S, Leppo M, Kizana E, Schär M, Gerstenblith G, Weiss RG, Marbán E, Abraham MR. Magnetic resonance imaging overestimates ferumoxide-labeled stem cell survival after transplantation in the heart. Circulation. 2008;117(12):1555–1562. doi: 10.1161/CIRCULATIONAHA.107.732073. [DOI] [PubMed] [Google Scholar]
- 7.Ahrens E. Contrast agents for magnetic resonance imaging and methods related thereto. 0219385. Patent application: USPTO US. 2003
- 8.Crichton RR, Wilmet S, Legssyer R, Ward RJ. Molecular and cellular mechanisms of iron homeostasis and toxicity in mammalian cells. J Inorg Biochem. 2002;91:9–18. doi: 10.1016/s0162-0134(02)00461-0. [DOI] [PubMed] [Google Scholar]
- 9.Cohen B, Dafni H, Meir G, Harmelin A, Neeman M. Ferritin as an Endogenous MRI Reporter for Noninvasive Imaging of Gene Expression in C6 Glioma Tumors. Neoplasia. 2005;7(2):109–117. doi: 10.1593/neo.04436. [DOI] [PMC free article] [PubMed] [Google Scholar]
- 10.Genove G, DeMarco U, Xu H, Goins WF, Ahrens ET. A new transgene reporter for in vivo magnetic resonance imaging. Nature Med. 2005;11(4):450–454. doi: 10.1038/nm1208. [DOI] [PubMed] [Google Scholar]
- 11.Kim HS, Cho HR, Choi SH, Woo JS, Moon WK. In vivo imaging of tumor transduced with bimodal lentiviral vector encoding human ferritin and green fluorescent protein on a 1.5t clinical magnetic resonance scanner. Cancer Res. 2010;70:7315–7324. doi: 10.1158/0008-5472.CAN-10-0241. [DOI] [PubMed] [Google Scholar]
- 12.Ono K, Fuma K, Tabata K, Sawada M. Ferritin reporter used for gene expression imaging by magnetic resonance. Biochem Biophys Res Commun. 2009;388(3):589–594. doi: 10.1016/j.bbrc.2009.08.055. [DOI] [PubMed] [Google Scholar]
- 13.Cohen B, Ziv K, Plaks V, Israely T, Kalchenko V, Harmelin A, Benjamin LE, Neeman M. MRI detection of transcriptional regulation of gene expression in transgenic mice. Nature Med. 2007;13(4):498–503. doi: 10.1038/nm1497. [DOI] [PubMed] [Google Scholar]
- 14.Ziv K, Meir G, Harmelin A, Shimoni E, Klein E, Neeman M. Ferritin as a reporter gene for MRI: chronic liver over expression of h-ferritin during dietary iron supplementation and aging. NMR Biomed. 2010;23:523–531. doi: 10.1002/nbm.1491. [DOI] [PMC free article] [PubMed] [Google Scholar]
- 15.Uchida M, Terashima M, Cunningham CH, 4, Suzuki Y, Willits DA, Willis AF, Yang PC, Tsao PS, McConnell MV, Young MJ, Douglas T. A Human Ferritin Iron Oxide Nano-composite Magnetic Resonance Contrast Agent. MRM. 2008;60:1073–1081. doi: 10.1002/mrm.21761. [DOI] [PubMed] [Google Scholar]
- 16.Terashima M, Uchida M, Kosuge H, Tsao PS, Young MJ, Conolly SM, Douglas T, McConnell MV. Human ferritin cages for imaging vascular macrophages. Biomaterials. 2011;32:1430–1437. doi: 10.1016/j.biomaterials.2010.09.029. [DOI] [PMC free article] [PubMed] [Google Scholar]
- 17.Naumova AV, Reinecke H, Yarnykh V, Deem J, Yuan C, Murry CE. Ferritin Overexpression for Noninvasive MRI-Based Tracking of Stem Cells Transplanted into the Heart. Mol Imaging. 2010;9:201–210. [PMC free article] [PubMed] [Google Scholar]
- 18.Edelman RR, Chien D, Kim D. Fast selective black blood MR imaging. Radiology. 1991;181:655–660. doi: 10.1148/radiology.181.3.1947077. [DOI] [PubMed] [Google Scholar]
- 19.Simonetti OP, Finn JP, White RD, Laub G, Henry DA. “Black blood” T2-weighted inversion-recovery MR imaging of the heart. Radiology. 1996;199:49–57. doi: 10.1148/radiology.199.1.8633172. [DOI] [PubMed] [Google Scholar]
- 20.Wang J, Yarnykh VL, Yuan C. Enhanced image quality in black-blood MRI using the improved motion-sensitized driven-equilibrium (iMSDE) sequence. J Magn Res Imaging. 2010;31(5):1256–1263. doi: 10.1002/jmri.22149. [DOI] [PMC free article] [PubMed] [Google Scholar]
- 21.Wang J, Yarnykh VL, Hatsukami T, Chu B, Balu N, Yuan C. Improved suppression of plaque-mimicking artifacts in black-blood carotid atherosclerosis imaging using a multislice motion-sensitized driven-equilibrium (MSDE) turbo spin-echo (TSE) sequence. Magn Reson Med. 2007;58:973–981. doi: 10.1002/mrm.21385. [DOI] [PubMed] [Google Scholar]
- 22.Silberstein L, Webster SG, Travis M, Blau HM. Developmental progression of myosin gene expression in cultured muscle cells. Cell. 1986;46(7):1075–1081. doi: 10.1016/0092-8674(86)90707-5. [DOI] [PubMed] [Google Scholar]
- 23.Stevens KR, Rolle MW, Minami E, Ueno S, Nourse MB, Virag JI, Reinecke H, Murry CE. Chemical dimerization of fibroblast growth factor receptor-1 induces myoblast proliferation, increases intracardiac graft size, and reduces ventricular dilation in infarcted hearts. Hum Gene Therapy. 2007;18(5):401–212. doi: 10.1089/hum.2006.161. [DOI] [PubMed] [Google Scholar]
- 24.Balu N, Yarnykh VL, Chu B, Wang J, Hatsukami T, Yuan C. Carotid plaque assessment using fast 3D isotropic resolution black-blood MRI. Magn Reson Med. 2011;65(3):627–637. doi: 10.1002/mrm.22642. [DOI] [PMC free article] [PubMed] [Google Scholar]
- 25.Iordanova B, Robison CS, Ahrens ET. Design and characterization of a chimeric ferritin with enhanced iron loading and transverse NMR relaxation rate. J Biol Inorg Chem. 2010;15:957–965. doi: 10.1007/s00775-010-0657-7. [DOI] [PMC free article] [PubMed] [Google Scholar]
- 26.Liu J, Cheng EC, Long RC, Jr, Yang SH, Wang L, Cheng PH, Yang JJ, Wu D, Mao H, Chan AW. Noninvasive Monitoring of Embryonic Stem Cells in vivo with MRI Transgene Reporter. Tissue Eng. 2009;15(4):739–747. doi: 10.1089/ten.tec.2008.0678. [DOI] [PMC free article] [PubMed] [Google Scholar]
- 27.Vande Velde G, Rangarajan JR, Toelen J, Dresselaers T, Ibrahimi A, Krylychkina O, Very R, der Linden AV, Maes F, Debyser Z, Himmelreich U, Baekelandt V. Evaluation of the specificity and sensitivity of ferritin as an MRI reporter gene in the mouse brain using lentiviral and adeno-associated viral vectors. Gene Therapy. 2011:1–12. doi: 10.1038/gt.2011.2. [DOI] [PubMed] [Google Scholar]
- 28.Deans AE, Wadghiri YZ, Bernas LM, Yu X, Rutt BK, Turnbull DH. Cellular MRI contrast via coexpression of transferrin receptor and ferritin. Magn Reson Med. 2006;56(1):51–59. doi: 10.1002/mrm.20914. [DOI] [PMC free article] [PubMed] [Google Scholar]
- 29.Aung W, Hasegawa S, Koshikawa-Yano M, Obata T, Ikehira H, Furukawa T, Aoki I, Saga T. Visualization of in vivo electroporation-mediated transgene expression in experimental tumors by optical and magnetic resonance imaging. Gene Therapy. 2009;16:830–839. doi: 10.1038/gt.2009.55. [DOI] [PubMed] [Google Scholar]
- 30.Arosio P, Levi S. Cytosolic and mitochondrial ferritins in the regulation of cellular iron homeostasis and oxidative damage. Biochim Biophys Acta. 2010;1800(8):783–792. doi: 10.1016/j.bbagen.2010.02.005. [DOI] [PubMed] [Google Scholar]
- 31.Arosio P, Levi S. Ferritin, iron homeostasis, and oxidative damage. Free Radical Biol Med. 2002;33(4):457–463. doi: 10.1016/s0891-5849(02)00842-0. [DOI] [PubMed] [Google Scholar]
- 32.De Domenico I, Ward DM, Kaplan J. Specific iron chelators determine the route of ferritin degradation. Blood. 2009;114:4546–4551. doi: 10.1182/blood-2009-05-224188. [DOI] [PMC free article] [PubMed] [Google Scholar]
- 33.Iancu TC. Ferritin and hemosiderin in pathological tissues. Electron Microsc Rev. 1992;5:209–229. doi: 10.1016/0892-0354(92)90011-e. [DOI] [PubMed] [Google Scholar]
- 34.Miyazaki E, Kato J, Kobune M, Okumura K, Sasaki K, Shintani N, Arosio P, Niitsu Y. Denatured Hferritin subunit is a major constituent of haemosiderin in the liver of patients with iron overload. Gut. 2002;50:413–419. doi: 10.1136/gut.50.3.413. [DOI] [PMC free article] [PubMed] [Google Scholar]
- 35.Harrison PM, Arosio P. The ferritins: molecular properties, iron storage function and cellular regulation. Biochim Biophys Acta. 1996;1275(3):161–203. doi: 10.1016/0005-2728(96)00022-9. [DOI] [PubMed] [Google Scholar]
- 36.Loncar R, Flesche CW, Deussen A. Ischemia results in an enhanced ferritin content in relation to the degree of ischemia. Acta Physiol Scand. 2004;180:21–28. doi: 10.1046/j.0001-6772.2003.01213.x. [DOI] [PubMed] [Google Scholar]
- 37.Adams CW. Perivascular iron deposition and other vascular damage in multiple sclerosis. J Neurol Neurosurg Psychiatry. 1988;51(2):260–265. doi: 10.1136/jnnp.51.2.260. [DOI] [PMC free article] [PubMed] [Google Scholar]
- 38.Rigol M, Solanes N, Roqué M, Farré J, Batlle M, Roura S, Bellera N, Prat-Vidal C, Sionis A, Ramírez J, Sitges M, Sanz G, Bayés-Genís A, Heras M. Hemosiderin deposits confounds tracking of iron-oxide-labeled stem cells: an experimental study. Transplant Proc. 2008;40(10):3619–3622. doi: 10.1016/j.transproceed.2008.05.084. [DOI] [PubMed] [Google Scholar]
- 39.Jensen JH, Chandra R. Theory of nonexponential NMR signal decay in liver with iron overload or superparamagnetic iron oxide particles. Magn Reson Med. 2002;47:1131–1138. doi: 10.1002/mrm.10170. [DOI] [PubMed] [Google Scholar]
- 40.Wu EX, Kim D, Tosti CL, Tang H, Jensen JH, Cheung JS, Feng L, Au W-Y, Ha S-Y, Sheth SS, Brown TR, Brittenham GM. Magnetic resonance assessment of iron overload by separate measurement of tissue ferritin and hemosiderin iron. Ann. N.Y. Acad. Sci. 2010;1202:115–122. doi: 10.1111/j.1749-6632.2010.05587.x. [DOI] [PMC free article] [PubMed] [Google Scholar]
- 41.Mills PH, Ahrens ET. Enhanced positive-contrast visualization of paramagnetic contrast agents using phase images. Magn Reson Med. 2009;62:1349–1355. doi: 10.1002/mrm.22127. [DOI] [PMC free article] [PubMed] [Google Scholar]
- 42.Gossuin Y, Muller RN, Gillis P. Relaxation induced by ferritin: a better understanding for an improved MRI iron quantification. NMR Biomed. 2004;17(7):427–432. doi: 10.1002/nbm.903. [DOI] [PubMed] [Google Scholar]
- 43.Vymazal J, Brooks RA, Zak O, McRill C, Shen C, Di Chiro G. T1 and T2 of ferritin at different field strengths: effect on MRI. Magn Reson Med. 1992;27:368–374. doi: 10.1002/mrm.1910270218. [DOI] [PubMed] [Google Scholar]