

Abstract
Numerous studies suggest that interhemispheric inhibition—relayed via the corpus callosum—plays an important role in unilateral hand motions. Interestingly, transcallosal inhibition appears to be indicative of a strong laterality effect, where generally the dominant hemisphere exerts inhibition on the nondominant one. These effects have been largely identified through functional studies in adult populations, but links between motor performance and callosal structure (especially during sensitive periods of neurodevelopment) remain largely unknown. We therefore investigated correlations between Purdue Pegboard performance (a test of motor function) and local callosal thickness in 170 right‐handed children and adolescents (mean age: 11.5 ± 3.4 years; range, 6–17 years). Better task performance with the right (dominant) hand was associated with greater callosal thickness in isthmus and posterior midbody. Task performance using both hands yielded smaller and less significant correlations in the same regions, while task performance using the left (nondominant) hand showed no significant correlations with callosal thickness. There were no significant interactions with age and sex. These links between motor performance and callosal structure may constitute the neural correlate of interhemispheric inhibition, which is thought to be necessary for fast and complex unilateral motions and to be biased towards the dominant hand. Hum Brain Mapp 34:2259–2265, 2013. © 2012 Wiley Periodicals, Inc.
Keywords: age, gender, interhemispheric inhibition, motor, Pegboard, sex
INTRODUCTION
Over the last decades, there has been accumulating evidence that unilateral hand movements are accompanied by an inhibition of the ipsilateral hemisphere [Ferbert et al., 1992; Liepert et al., 2001; Meyer et al., 1998; Newton et al., 2005]. For example, applying Transcranial Magnetic Stimulation (TMS) to the motor cortex in the right hemisphere generates motor‐evoked potentials and triggers movement of the left hand. Interestingly though, when the right hand is active in addition, the TMS‐evoked amplitudes for the left hand are diminished [Ferbert et al., 1992; Liepert et al., 2001]. This effect has been interpreted as interhemispheric inhibition [Ferbert et al., 1992; Liepert et al., 2001; Meyer et al., 1998; Newton et al., 2005]. The magnitude of interhemispheric inhibition, however, seems to differ between dominant and nondominant hand, with stronger inhibition when subjects use the dominant rather than the nondominant hand [Netz et al., 1995; Newton et al., 2005; Vines et al., 2008].
Interhemispheric inhibition appears to be relayed via the corpus callosum, as demonstrated in a callosal lesion study [Meyer et al., 1998]. In this study Meyer et al. instructed subjects to maximally contract their hand and measured the electromyography (EMG) activity. When, at the same time, TMS was applied to the ipsilateral motor cortex of the contracted hand, EMG activity was decreased. This effect, however, was only evident in healthy controls but not in patients with callosal lesions. With respect to the location of callosal fibers carrying hand motor information, Meyer's lesion study points to regions in the middle and posterior part of the callosum (i.e., the regions where patients had the callosal lesions). Consistent with this, recent DTI tractography studies located fibers interconnecting the primary motor cortices within the posterior half of the corpus callosum, in the isthmus and posterior midbody [Hofer and Frahm, 2006; Zarei et al., 2006].
In general, interhemispheric inhibition is interpreted as suppressing potential influences from mirror movements mainly in the unused nondominant hand, which seems necessary to facilitate fast and complex unilateral motions of the dominant hand [Muller et al., 1997; Newton et al., 2005]. In support with this assumption, 71% of the patients with callosal lesions in the aforementioned lesion study by Meyer et al. 1998 showed abnormalities in fast and complex unilateral movements. Therefore, if ipsilateral inhibition is relayed via the corpus callosum, and if greater numbers of inhibitory fibers facilitate fast and complex unilateral motions, we may expect that unilateral hand motor performance (especially performance of the dominant hand) is positively correlated with the dimensions of the corpus callosum, at least in adults. Children and teenagers, however, may lack such a relationship as mirror movements still exist possibly due to the immaturity of transcallosal inhibitory fibers [Connolly and Stratton, 1968; Heinen et al., 1998; Muller et al., 1997].
Here we aimed to investigate the link between callosal morphology and hand motor performance in the developing brain (i.e., in individuals between 6 and 17 years old). For this purpose, we used advanced surface‐based mesh‐modeling methods to indicate the exact location of possible correlations between Purdue Pegboard performance scores and callosal thickness measures with an extremely high spatial resolution. To uncover possible differential effects in younger (≤11 years) and older cohorts (>11 years), we also separated the overall sample (n = 170) into two subgroups (n 1 = 85, n 2 = 85) and tested for significant interactions with age. Last but not least, as callosal development seems to follow different trajectories and patterns in boys and girls [Luders et al., 2010a], we also tested for sex effects and interactions, using a balanced design of 85 boys and 85 girls.
MATERIALS AND METHODS
Subjects
The study included 170 subjects (85 males; 85 females) aged between 6 and 17 years (mean ± SD: 11.5 ± 3.4 years). All subjects were selected from a database compiled by the NIH MRI Study of Normal Brain Development [Evans, 2006]. To determine handedness (or hand preference), subjects were asked to perform eight different activities, modified from the Edinburgh Handedness Inventory [EHI; Oldfield, 1971]. Right‐handed activities were rated with 1, left‐handed activities were rated with 0. Subjects with total scores of <7 were classified as nonright‐handed and excluded from the current sample. That is, our study deliberately assessed only strongly right‐handed subjects.
For all of the 170 right‐handed subjects, hand performance measures had been established using the Purdue Pegboard [Gardner and Broman, 1979], where children were asked to place as many pegs as possible into the board within 30 s. This assessment yielded individual hand performance measures when using (a) the dominant hand (i.e., right hand; RH), (b) the nondominant hand (i.e., left hand; LH), and (c) both hands (BH) simultaneously. In addition, intelligence measures had been obtained using the Wechsler Abbreviated Scale of Intelligence [Wechsler, 1999] yielding full‐scale intelligence (FS‐IQ), performance intelligence (P‐IQ), and verbal intelligence (V‐IQ) scores as previously detailed [Luders et al., 2011]. Informed consent was obtained from parents and adolescents, and assents were obtained from the children. All protocols and procedures were approved by the relevant Institutional Review Board at each pediatric study center (Boston, Cincinnati, Houston, Los Angeles, Philadelphia, and St. Louis) and at each coordinating center [Evans, 2006].
Image Acquisition
Images were obtained on 1.5 T systems from General Electric (GE) or Siemens Medical Systems (Siemens) using a 3D T1‐weighted spoiled gradient recalled (SPGR) echo sequence with the following parameters: TR = 22–25 ms, TE = 10–11 ms, excitation pulse = 30°, refocusing pulse = 180°, orientation: sagittal; field of view: AP = 256 mm; LR = 160–180 mm (whole head coverage). The voxel size was set to 1 mm3, except on GE scanners, where the maximum number of slices was 124, and hence the slice thickness was increased to 1.5 mm in the sagittal plane [Evans, 2006]. Imaging data from study participants was obtained on six different scanners (for details see Evans, 2006), where each scanner contributed between 13 and 21% of the subjects (scanner information for three subjects was missing).
Preprocessing
We applied automated radio‐frequency bias field corrections to correct image volumes for intensity drifts caused by magnetic field inhomogeneities [Shattuck et al., 2001]. In addition, we placed all image volumes into the same standard space by co‐registering them to the ICBM‐152 template using automated 6‐parameter rigid‐body transformations [Woods et al., 1998]. That is, images were corrected for differences in brain position and orientation while preserving their native dimensions. The corpus callosum was then outlined automatically based on the Chan‐Vese model for active contours [Chan and Vese, 2001] using the LONI pipeline processing environment [Dinov et al., 2009; Rex et al., 2003]. This resulted in two midsagittal callosal segments (i.e., the upper and lower callosal boundary) for each subject, as detailed elsewhere [Luders et al., 2006]. Subsequently, each callosal segment was overlaid onto the MR image from which it had been extracted and visually inspected to ensure that automatically generated callosal outlines precisely followed the natural course and boundaries of the corpus callosum. Contours that did not match this criterion were corrected manually by one rater (E.L.).
Callosal Thickness Measurements
To obtain highly localized measures of callosal thickness, anatomical surface‐based mesh modeling methods were employed [Thompson et al., 2010b, 1996a]. That is, the upper and lower callosal boundaries were re‐sampled at regular intervals to render the discrete points comprising the boundaries spatially uniform. Then, a new segment (i.e., the medial core) was automatically created by calculating a spatial average 2D curve from 100 equidistant surface points representing the upper and lower callosal boundaries. Finally, the distances between 100 surface points of the medial core and the 100 corresponding surface points of both the upper and the lower callosal boundaries were computed. These regional distances indicate callosal thickness with a high spatial resolution (i.e., at 100 locations distributed evenly over the callosal surface).
Statistical Analyses
First, we investigated whether there is a link between hand performance and callosal size within the overall sample (n = 170). For this purpose, we mapped the Pearson correlations at 100 equidistant surface points between callosal thickness and hand performance measures for the dominant hand, for the nondominant hand, and for both hands. In addition, we tested whether links between hand performance measures and callosal size were different between children and teenagers (Age Interaction) and between boys and girls (Sex interaction). For this purpose, we divided the overall sample (n = 170) into two equally sized subgroups (n 1 = 85; n 2 = 85) each spanning six consecutive years of age. Subgroup 1 (children) contained subjects aged 6–11 years (41 boys; 44 girls) and subgroup 2 (teenagers) contained subjects aged 12–17 years (44 boys; 41 girls).1 Subsequently, we analyzed whether callosal regions showed significant differences in the slopes of the regression lines pertaining to children and teenagers (Age Interaction) and pertaining to boys and girls (Sex Interaction). For all analyses, significance values and correlation coefficients were projected onto the group‐averaged callosal surface models. Significance values were corrected for multiple comparisons using False Discovery Rate (FDR) thresholded at q = 0.05 (Benjamini and Hochberg, 1995). Correlation coefficients were color‐coded according to Cohen (1992) with respect to effect sizes: small (r ≥ 0.1), medium (r ≥ 0.3), and large (r ≥ 0.5).
RESULTS
As shown in Figure 1 (top panel), we revealed significant positive correlations between callosal thickness and hand performance measures. These associations were most pronounced within the callosal isthmus. More specifically, when exploring relationships with respect to the dominant hand (left panel), we detected significant and spatially extended positive correlations at the tip of the splenium, within the isthmus, and within the callosal posterior and anterior midbody (P = 0.0193). Significant positive correlations with respect to both hands (right panel) were spatially more restricted but confined to similar regions within isthmus and posterior midbody (P = 0.0089).
Figure 1.
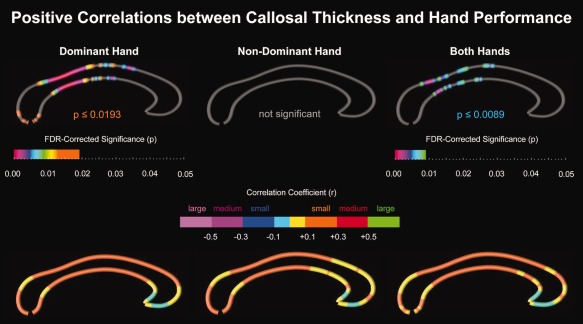
Positive correlations between callosal thickness and hand performance. Top Panel: Illustrated are FDR‐corrected significance values (p‐maps). Gray indicates where no significant correlations were detected. Bottom Panel: Illustrated are correlation coefficients (r‐maps) color‐coded with respect to effect sizes: small (r ≥ 0.1), medium (r ≥ 0.3), and large (r ≥ 0.5). Cyan and yellow indicate where negative and positive correlations remained below the threshold for relevant effect sizes. The callosal posterior section is located on the left; the callosal anterior section points to the right. [Color figure can be viewed in the online issue, which is available at http://wileyonlinelibrary.com.]
In contrast, significant positive correlations with respect to the non‐dominant hand (middle panel) were not detected. Even so, as shown in Figure 1 (bottom panel), correlation profiles (r‐maps) for the dominant hand, nondominant hand, and both hands looked strikingly similar. Effect sizes were small (r < 0.3); there were no medium to large effects. Correlations were almost exclusively positive, with the exception of the rostrum, which showed negative correlation (albeit below the threshold for relevant effect sizes). Finally, no significant interactions were detected with respect to Age and Sex (maps not shown).
DISCUSSION
Positive Associations Between Hand Motor Performance and Callosal Size
We found significant positive correlations between hand motor performance and callosal thickness in right‐handed children and adolescents. A thicker corpus callosum might imply more axons, thicker axons, greater myelination, or a combination of these [Aboitiz et al., 1992]. A greater number of axons may indicate a better anatomical connectivity between the hemispheres, but thicker axons as well as a greater degree of myelination might be associated with higher velocities of signal conduction. Thus, regardless of the exact micro‐anatomical nature, positive correlations between callosal thickness and task performance seem plausible. However, it is interesting that the most pronounced effects occurred with respect to the right (dominant) hand only. Correlations between bimanual performance and callosal thickness showed a less pronounced and widespread significance, while performance with the left (nondominant) hand showed no detectable correlations with callosal thickness at all. Altogether, this implicates a strong (and perhaps exclusive) effect of the dominant hemisphere on interhemispheric information transfer in motor tasks.
Strong Effects Within Callosal Regions Relaying Motor Information
The observed positive correlations were located within the isthmus and posterior midbody of the corpus callosum (slightly extending into the anterior midbody). This regional specificity of correlations between callosal structure and motor function agrees well with effects of handedness located within isthmus and posterior/anterior midbody when comparing groups of consistent and nonconsistent right handers [Witelson, 1989] or when mapping correlations between callosal thickness and the degree of handedness lateralization [Luders et al., 2010a]. These prior observations were either based on autopsy material [Witelson, 1989] or traditional MRI data [Luders et al., 2010a] but seem to indicate, at least, some degree of motor relevance in these regions. However, more direct evidence of sensory/(pre)motor fibers traveling through the isthmus, posterior, and anterior midbody comes from DTI studies mapping the course of fibers originating from primary sensory and motor cortices [Hofer and Frahm, 2006; Zarei et al., 2006]. As demonstrated in Figure 2, there is a striking spatial correspondence between callosal regions housing motor fibers [Hofer and Frahm, 2006] and areas showing strong positive correlations with hand performance (in this study). Finally, the assumption that motor fibers travel through the isthmus and posterior midbody is further supported by previous TMS studies [Meyer et al., 1998]. As noted earlier, when applying TMS to the motor cortices in patients with circumscribed lesions in posterior and mid callosal regions, the decrease of EMG activity in the motor cortex of the ipsilateral hand (as observed in healthy controls) was missing.
Figure 2.
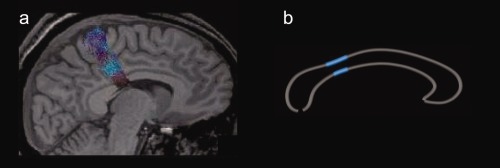
Spatial correspondence between callosal regions (a) housing motor fibers and (b) showing strong correlations with hand performance. Left panel: Diffusion Tensor Tractography of callosal fibers connecting the primary motor cortices (figure adapted with permission [Hofer and Frahm, 2006]). Right panel: Location of highly significant correlations (P ≤ 0.001) between callosal thickness and dominant hand performance. [Color figure can be viewed in the online issue, which is available at http://wileyonlinelibrary.com.]
Possible Effects of Interhemispheric Inhibition
The observed location and positive correlation between task performance and callosal thickness implies that interhemispheric connectivity between primary motor regions affects task performance. Effects of interhemispheric inhibition between motor areas have been previously reported. For example, it was shown that a conditioning stimulus via TMS in one hemisphere reduced the effect of a TMS impulse in the other hemisphere [Ferbert et al., 1992; Netz et al., 1995]. The same effect was observed when subjects applied low grip force with one hand. This low grip force consequently reduced the effects of a TMS impulse on the ipsilateral hemisphere as measured on the contralateral hand [Liepert et al., 2001]. Similar effects were also observed using functional MRI (fMRI), where motor performance of one hand led to increased activity in the motor cortex of the contralateral hemisphere, but to a decrease in the ipsilateral hemisphere [Newton et al., 2005]. In line with these prior findings and the results of the current study, interhemispheric inhibition may facilitate fast and complex unilateral motions [Meyer et al., 1998; Newton et al., 2005].
The interpretation of interhemispheric inhibition as a functional correlate of our present findings is further supported by studies revealing that interhemispheric inhibition primarily occurs as an effect of the dominant hemisphere on the nondominant one [Ghacibeh et al., 2007; Newton et al., 2005; Vines et al., 2008]. For example, an fMRI study [Newton et al., 2005] measured cortical activity during finger tapping in right handers and revealed activity decreases of the ipsilateral motor cortex. These deactivations, however, were more pronounced in the right hemisphere (i.e., when subjects used their dominant hand). Another study of right handers used transcranial direct current stimulation (tDCS) and modulated excitation and inhibition of the motor cortex to focus on differences in interhemispheric inhibition between dominant and nondominant hemispheres [Vines et al., 2008]. This study showed that the excitation of the dominant motor cortex induced higher performance in the contralateral hand (and lower performance in the ipsilateral hand). Inhibition of the dominant motor cortex had the opposite effect. In contrast, excitation and inhibition of the non‐dominant motor cortex only showed the respective effects on the contralateral hand, but not on the ipsilateral hand. This depicts an asymmetry in interhemispheric inhibition, with less influence of the non‐dominant hemisphere on the dominant one. The present results, with strongest correlation between callosal thickness and dominant hand performance, less correlation using both hands and no correlation between callosal thickness and nondominant hand performance, closely match these observations by Vines et al. 2008.
Effects of Age and Sex
Motor abilities develop during childhood and adolescence [Connolly and Stratton, 1968; Heinen et al., 1998; Muller et al., 1997], where girls are known to acquire a range of motor skills earlier than boys [Connolly and Stratton, 1968]. Moreover, the corpus callosum continues to mature during childhood and adolescence [Ghacibeh et al., 2007; Heinen et al., 1998; Muller et al., 1997] with different maturation levels and regional growth spurts in boys and girls [Luders et al., 2010b]. Thus, our study also addressed possible effects of age and sex. Older subjects performed better than younger ones, and girls performed better than boys, consistent with prior findings regarding motor development and sex differences [Connolly and Stratton, 1968; Heinen et al., 1998; Muller et al., 1997]. However, we did not find a significant interaction with respect to age and sex when examining correlations between motor performance and callosal size. Interestingly, a previous study [Luders et al., 2010b] reported significant correlations between age and callosal thickness in the posterior midbody and isthmus of the corpus callosum with constant growth of these regions between the age of 9 and 18 (at least, in girls). Such evidence of increasing thickness of the callosal isthmus during late childhood was also obtained using a tensor‐based longitudinal mapping approach [Thompson et al., 2000]. We did not observe an interaction with age, so the detected relationship between local callosal thickness and task performance may exist early on. Thus, interhemispheric inhibition may not necessarily be an effect of callosal maturation in late childhood.
SUMMARY AND OUTLOOK
In a large sample of 170 children, we observed positive correlations between motor performance of the dominant hand and callosal thickness in an area that was reported to relay information between the primary motor cortices. This correlation was less pronounced using both hands and completely absent using the nondominant hand. Our findings are likely to constitute a key neural correlate of interhemispheric inhibition, a phenomenon discussed as necessary for fast and complex unilateral motions [Meyer et al., 1998] and known to be biased towards the dominant hand [Newton et al., 2005; Vines et al., 2008]. Clearly, these results require replication, optimally in an extended study comprising not just right‐handed but also left‐handed and ambidextrous subjects. This would illuminate possible effects of handedness, as the current conclusions might not necessarily apply to nonright‐handed populations. Furthermore it may be useful to extend the age range to even younger cohorts as well as to analyze DTI data (perhaps in addition to traditional structural MRI data). This will help to establish if interhemipsheric inhibition already occurs below the age of 6 years, and if interhemispheric inhibition is mediated by sprouting or maturation of axons in early childhood.
There were no significant differences between children and teenagers (and none between boys and girls, either) with respect to intelligence measures (FS‐IQ, P‐IQ, and V‐IQ). However, there were significant differences with respect to hand performance measures with children performing more poorly than teenagers (Table 1) and boys performing more poorly than girls (Table 2).
Table 1.
Age effects (number of pegs placed within 30 s)
| Group | N | Mean | Std. deviation | Significance (P) | |
|---|---|---|---|---|---|
| RH | Children | 85 | 12.29 | 2.37 | 0.001* |
| Teenagers | 85 | 13.51 | 2.10 | ||
| LH | Children | 85 | 11.36 | 2.34 | 0.002* |
| Teenagers | 85 | 12.47 | 2.18 | ||
| BH | Children | 85 | 9.47 | 1.94 | <0.001* |
| Teenagers | 85 | 10.69 | 1.88 |
RH, pegs placed with right hand; LH, pegs placed with left hand; BH, pegs placed with both hands.
Table 2.
Sex effects (number of pegs placed within 30 s)
| Group | N | Mean | Std. deviation | Significance (P) | |
|---|---|---|---|---|---|
| RH | Boys | 85 | 12.47 | 2.34 | 0.015* |
| Girls | 85 | 13.33 | 2.21 | ||
| LH | Boys | 85 | 11.87 | 2.13 | 0.793 |
| Girls | 85 | 11.96 | 2.51 | ||
| BH | Boys | 85 | 9.98 | 1.91 | 0.492 |
| Girls | 85 | 10.19 | 2.10 |
RH, pegs placed with right hand; LH, pegs placed with left hand; BH, pegs placed with both hands.
Acknowledgments
Data used in the preparation of this article were obtained from the Pediatric MRI Data Repository created by the NIH MRI Study of Normal Brain Development. This is a multi‐site, longitudinal study of typically developing children, from ages newborn through young adulthood, conducted by the Brain Development Cooperative Group.
This manuscript reflects the views of the authors and may not reflect the opinions or views of the NIH.
REFERENCES
- Aboitiz F, Scheibel AB, Fisher RS, Zaidel E (1992): Fiber composition of the human corpus callosum. Brain Res 598( 1–2):143–153. [DOI] [PubMed] [Google Scholar]
- Benjamini Y, Hochberg Y (1995): Controlling the false discovery rate—A practical and powerful approach to multiple testing. J Roy Stat Soc Series B‐Methodological 57:289–300. [Google Scholar]
- Chan TF, Vese LA (2001): Active contours without edges. IEEE Trans Image Proc 10:266–277. [DOI] [PubMed] [Google Scholar]
- Cohen J (1992): A power primer. Psychol Bull 112:155–159. [DOI] [PubMed] [Google Scholar]
- Connolly K, Stratton P (1968): Developmental changes in associated movements. Dev Med Child Neurol 10:49–56. [DOI] [PubMed] [Google Scholar]
- Dinov ID, Van Horn JD, Lozev KM, Magsipoc R, Petrosyan P, Liu Z, Mackenzie‐Graham A, Eggert P, Parker DS, Toga AW (2009): Efficient, distributed and interactive neuroimaging data analysis using the LONI pipeline. Front Neuroinform 3:22. [DOI] [PMC free article] [PubMed] [Google Scholar]
- Evans AC (2006): The NIH MRI study of normal brain development. Neuroimage 30:184–202. [DOI] [PubMed] [Google Scholar]
- Ferbert A, Priori A, Rothwell JC, Day BL, Colebatch JG, Marsden CD (1992): Interhemispheric inhibition of the human motor cortex. J Physiol 453:525–546. [DOI] [PMC free article] [PubMed] [Google Scholar]
- Gardner RA, Broman M (1979): Purdue Pegboard—Normative Data on 1334 School‐Children. J Clin Child Psychol 8:156–162. [Google Scholar]
- Ghacibeh GA, Mirpuri R, Drago V, Jeong Y, Heilman KM, Triggs WJ (2007): Ipsilateral motor activation during unimanual and bimanual motor tasks. Clin Neurophysiol 118:325–332. [DOI] [PubMed] [Google Scholar]
- Heinen F, Glocker FX, Fietzek U, Meyer BU, Lucking CH, Korinthenberg R (1998): Absence of transcallosal inhibition following focal magnetic stimulation in preschool children. Ann Neurol 43:608–612. [DOI] [PubMed] [Google Scholar]
- Hofer S, Frahm J (2006): Topography of the human corpus callosum revisited—Comprehensive fiber tractography using diffusion tensor magnetic resonance imaging. Neuroimage 32:989–994. [DOI] [PubMed] [Google Scholar]
- Liepert J, Dettmers C, Terborg C, Weiller C (2001): Inhibition of ipsilateral motor cortex during phasic generation of low force. Clin Neurophysiol 112:114–121. [DOI] [PubMed] [Google Scholar]
- Luders E, Narr KL, Zaidel E, Thompson PM, Jancke L, Toga AW (2006): Parasagittal asymmetries of the corpus callosum. Cereb Cortex 16:346–354. [DOI] [PubMed] [Google Scholar]
- Luders E, Cherbuin N, Thompson PM, Gutman B, Anstey KJ, Sachdev P, Toga AW (2010a) When more is less: Associations between corpus callosum size and handedness lateralization. Neuroimage 52:43–9. [DOI] [PMC free article] [PubMed] [Google Scholar]
- Luders E, Thompson PM, Toga AW (2010b) The development of the corpus callosum in the healthy human brain. J Neurosci 30:10985–10990. [DOI] [PMC free article] [PubMed] [Google Scholar]
- Luders E, Thompson PM, Narr KL, Zamanyan A, Chou YY, Gutman B, Dinov ID, Toga AW (2011): The link between callosal thickness and intelligence in healthy children and adolescents. Neuroimage 54:1823–1830. [DOI] [PMC free article] [PubMed] [Google Scholar]
- Meyer BU, Roricht S, Woiciechowsky C (1998): Topography of fibers in the human corpus callosum mediating interhemispheric inhibition between the motor cortices. Ann Neurol 43:360–369. [DOI] [PubMed] [Google Scholar]
- Muller K, Kass‐Iliyya F, Reitz M (1997): Ontogeny of ipsilateral corticospinal projections: A developmental study with transcranial magnetic stimulation. Ann Neurol 42:705–711. [DOI] [PubMed] [Google Scholar]
- Netz J, Ziemann U, Homberg V (1995): Hemispheric asymmetry of transcallosal inhibition in man. Exp Brain Res 104:527–533. [DOI] [PubMed] [Google Scholar]
- Newton JM, Sunderland A, Gowland PA (2005): fMRI signal decreases in ipsilateral primary motor cortex during unilateral hand movements are related to duration and side of movement. Neuroimage 24:1080–1087. [DOI] [PubMed] [Google Scholar]
- Oldfield RC (1971): The assessment and analysis of handedness: The Edinburgh inventory. Neuropsychologia 9:97–113. [DOI] [PubMed] [Google Scholar]
- Rex DE, Ma JQ, Toga AW (2003): The LONI Pipeline Processing Environment. Neuroimage 19:1033–1048. [DOI] [PubMed] [Google Scholar]
- Shattuck DW, Sandor‐Leahy SR, Schaper KA, Rottenberg DA, Leahy RM (2001): Magnetic resonance image tissue classification using a partial volume model. Neuroimage 13:856–876. [DOI] [PubMed] [Google Scholar]
- Thompson PM, Schwartz C, Lin RT, Khan AA, Toga AW (1996a) Three‐dimensional statistical analysis of sulcal variability in the human brain. J Neurosci 16:4261–4274. [DOI] [PMC free article] [PubMed] [Google Scholar]
- Thompson PM, Schwartz C, Toga AW (1996b) High‐resolution random mesh algorithms for creating a probabilistic 3D surface atlas of the human brain. Neuroimage 3:19–34. [DOI] [PubMed] [Google Scholar]
- Thompson PM, Giedd JN, Woods RP, MacDonald D, Evans AC, Toga AW (2000): Growth patterns in the developing brain detected by using continuum mechanical tensor maps. Nature 404:190–193. [DOI] [PubMed] [Google Scholar]
- Vines BW, Nair D, Schlaug G (2008): Modulating activity in the motor cortex affects performance for the two hands differently depending upon which hemisphere is stimulated. Eur J Neurosci 28:1667–1673. [DOI] [PubMed] [Google Scholar]
- Wechsler D (1999): Wechsler Abbreviated Scale of Intelligence. San Antonio, TX. [Google Scholar]
- Witelson SF (1989): Hand and sex differences in the isthmus and genu of the human corpus callosum. A postmortem morphological study. Brain 112 ( Part 3):799–835. [DOI] [PubMed] [Google Scholar]
- Woods RP, Grafton ST, Watson JD, Sicotte NL, Mazziotta JC (1998): Automated image registration. II. Intersubject validation of linear and nonlinear models. J Comput Assist Tomogr 22:153–165. [DOI] [PubMed] [Google Scholar]
- Zarei M, Johansen‐Berg H, Smith S, Ciccarelli O, Thompson AJ, Matthews PM (2006): Functional anatomy of interhemispheric cortical connections in the human brain. J Anat 209:311–320. [DOI] [PMC free article] [PubMed] [Google Scholar]