Abstract
Amide proton transfer (APT) imaging, a specific form of chemical exchange saturation transfer (CEST) imaging, has previously been applied to studies of acute ischemic acidosis, stroke, and cancer. However, interpreting the resulting contrast is complicated by its dependence on the exchange rate between amides and water, the amide concentration, amide and water relaxation, and macromolecular magnetization transfer. Hence, conventional CEST contrast is not specific to changes such as reductions in pH due to tissue acidosis. In this paper, a multi-angle ratiometric approach based on several pulsed-CEST scans at different irradiation flip angles is proposed to specifically reflect exchange rates only. This separation of exchange effects in pulsed-CEST experiments is based on isolating rotation vs. saturation contributions, and such methods form a new subclass of chemical exchange rotation transfer (CERT) experiments. Simulations and measurements of creatine/agar phantoms indicate that a newly proposed imaging metric isolates the effects of exchange rate changes, independent of other sample parameters.
Keywords: Chemical exchange magnetization transfer (CEST), Amide proton transfer (APT), pH
INTRODUCTION
Chemical exchange rates between labile protons and bulk water have a strong pH dependence (1–4). Therefore, chemical exchange saturation transfer (CEST) imaging can in principle be used to produce pH-sensitive magnetic resonance imaging (MRI) contrast by exploiting the chemical exchange effect. For example, amide proton transfer (APT) imaging, a variant of CEST MRI, has been used to study acute ischemic acidosis. However, in addition to the exchange rate (ksw), the conventional CEST contrast (which is the normalized difference between the label scan and the reference scan) also depends on the amide concentration (fs), amide relaxation (T1s, T2s), free water relaxation (T1w, T2w), and macromolecular magnetization transfer (MT) and asymmetry (5–8). Hence, it remains difficult to obtain a specific measure of exchange.
There have been previous attempts to isolate effects of ksw. Ward et al. (3) developed a ratiometric technique to exclude the effects of solute pool concentration and free water relaxation. This technique requires multiple chemical exchange sites on the same molecule with different frequency offset and pH dependencies. MacMahon et al. (9) quantified the underlying sample parameters by modeling the CEST contrast dependence on the saturation time and saturation power (QUEST and QUESP). However, MT and direct saturation effects are ignored in these quantification methods. Dixon et al.’s omega plot method (10) is based on fitting CEST contrast vs. RF power, to indirectly measure the exchange rate without considering the solute pool concentration. This method is similar to QUESP, and does not consider the MT and direct saturation effects. Sun et al. (6) modeled the optimal RF power, which is strongly dependent on the exchange rate but not the solute concentration, to obtain a concentration-independent contrast. However, MT effects are not considered. In addition, all these methods are based on the continuous-wave (CW) CEST sequence, which has limitations on human scanners. Pulsed-CEST bypasses some of these limitations, and, has been exploited to create CEST contrast (11–19) and used to quantify CEST acquisitions (20,21).
While several papers have recognized the benefits of using repeated 180° pulses to saturate the amide magnetization (e.g. (13)), recent work has clarified the unique separation of rotation and saturation effects (22) possible in the pulsed CEST sequence (figure 1). In this paper, we exploit this effect in order to isolate the contribution of chemical exchange. We find that the pulsed CEST contrast vs. irradiation flip angle θ has a functional form that depends on ksw. Like Ward’s method, which uses the ratio of contrasts from multiple exchange sites to eliminate fs, we propose to use the ratio of contrasts at multiple θ values to eliminate fs. In addition, by keeping Bavg power (defined to be the square root of the mean square irradiation field over the entire pulse train period) constant at different θ, MT and direct saturation effects can be cancelled. Exchange-rate specific weighted imaging can be obtained based on the ratio of CEST effects at different θ but constant Bavg power. This multi-angle ratiometric approach was verified through numerical simulations and experiments. Sensitivity, dynamic range, and limitations of this method were also evaluated.
FIG. 1.
Diagram of pulsed-CEST imaging sequence. The irradiation pulse train lasts 8 seconds before the 90° excitation pulse.
THEORY
Our previous work (22) demonstrated that the pulsed-CEST contrast has an oscillating [~cos(θ)] component due to rotation effects (in addition to saturation effects) in the metabolite spin system. The repeated rotation of the metabolite magnetization has a corresponding effect on the water signal after chemical exchange. When the period of RF irradiations (τpd in figure 1) is comparable to the inverse of ksw, this rotation effect is greatly affected by spin exchange between metabolite and water, resulting in a normalized CEST contrast dependence on both ksw and θ. As the exchange rate between amide protons and water is less than 100 1/s in the physiological environment, the pulsed-CEST APT functional dependence on θ varies as τpd goes from millisecond to tens of milliseconds.
Conventional CEST contrast in pulsed CEST imaging depends on several acquisition parameters (θ, Bavg power, duty cycle) and sample parameters (ksw, fs, T1s, T2s, T1w, T2w, B0, exchange rate from the macromolecule to the water (kmw), and macromolecular pool concentration (fm)). The CEST contrast is defined as the normalized difference between the signals when applying positive (S+) and negative (S−) offset irradiations (see Eq. [1]), where (−) represents the offset of the exchanging metabolite, (+) is the offset on the symmetrically opposite side of the water peak, and S0 is the non-irradiated control signal.
| (1) |
The large number of contributing parameters is what makes exchange specific CEST difficult. Our approach is to simplify the parameter dependence by taking the ratio of CEST contrasts at two different θ values.
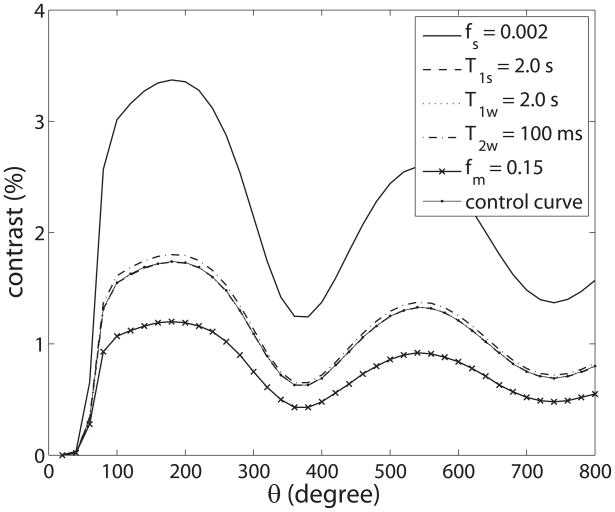
This theory section is based on a series of simulations as described in the appendix. Figure 2 plots the simulated pulsed-CEST contrast for amide exchange as a function of θ while varying fs, T1s, T1w, T2w, and fm, but keeping duty cycle and Bavg power constant. (θ was increased by changing the pulse duration (τp) and τpd in order to keep Bavg power and duty cycle constant.) By keeping Bavg power constant, MT and direct saturation effects do not change with θ, thus isolating amide rotation effects. (There is only saturation and no rotation of the macromolecular protons due to their very short T2 (~10 μs)). Likewise, there is no direct rotation of the water protons so long as the RF pulses are far enough off-resonance to remain adiabatic, which is the case at the amide resonance 3.5 ppm from water.) Figure 2 indicates that the magnitude of the resulting oscillation in the measured water signal depends on many sample parameters, including parameters such as fm, the effects of which are often (mistakenly) assumed to cancel out in the CEST contrast.
FIG. 2.
Plot of simulated CEST contrast as a function of θ for different fs, T1s, T1w, T2w, and fm. Unless otherwise specified, the parameters driving the simulation are 0.001, 1.5 s, 1.5 s, 60 ms, and 0.1 (which are also the parameters for the control curve), respectively. This figure illustrates how the contrast dependence on θ scales with the sample parameters. The control curve nearly coincides with the curves varying T1s and T1w, since variations in these parameters have little effect on the measured water signal contrast.
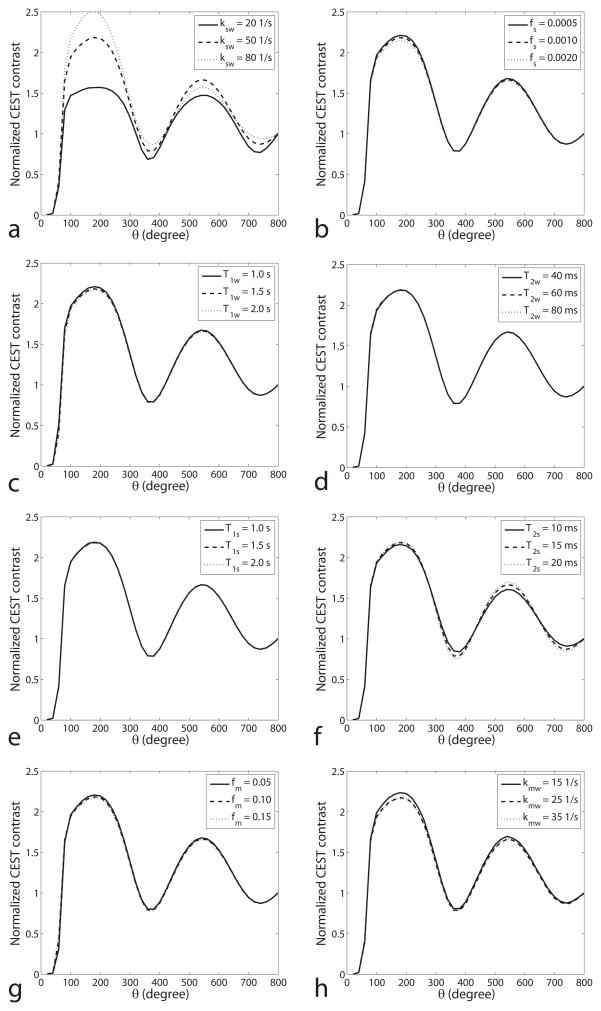
However, figure 3 illustrates that the shape of the oscillation depends on only ksw and T2s. By plotting contrast normalized by the results at θ = 800°, the functional form (rather than scaling) is clear. The functional dependence of this rotation effect on θ is not affected by changes in fs, T1w, T2w, T1s, fm and kmw, but the curve shape does change with variations in ksw, and, to a lesser degree, T2s. This differential dependence of rotation effects on exchange (vs. concentration, relaxation, and solid pool effects) underlies our approach to ksw specific imaging.
FIG. 3.
Simulated normalized CEST contrasts (defined in Eq. (2)) as a function of θ for different ksw (a), fs (b), T1w (c), T2w (d), T1s (e), T2s (f), fm (g) and kmw (h). The normalized CEST contrast is the ratio of CEST contrast at two θ values. Note that the oscillation is dependent on ksw and slightly on T2s, but not fs, T1s, T1w, T2w, fm and kmw. Simulations were performed by using a three-pool model with a symmetric MT effect. Control θ was set to be 800°. Bavg power and duty cycle were set to be 2.0 μT and 30%, respectively.
The result in figure 3 can be described by the empirical equation:
| (2) |
Combining Eqs. (1) and (2), gives
| (3) |
with Φ1 characterizing the oscillation of the CEST contrast with θ, while Φ2 is related to the magnitude of the CEST contrast. Therefore, the ratio image at two different θ values can remove the effect of amide concentration, relaxation, and MT.
Three feature points at θ = 180°, 360°, and 540° best characterize the oscillations in figure 3. Figure 3f indicates that the normalized CEST contrasts at 360° and 540° are sensitive to T2s. However the average of normalized CEST contrast at these two θ values is independent of T2s. Hence, a CEST contrast ratio (CCR) likely to be specifically sensitive to ksw is:
| (4) |
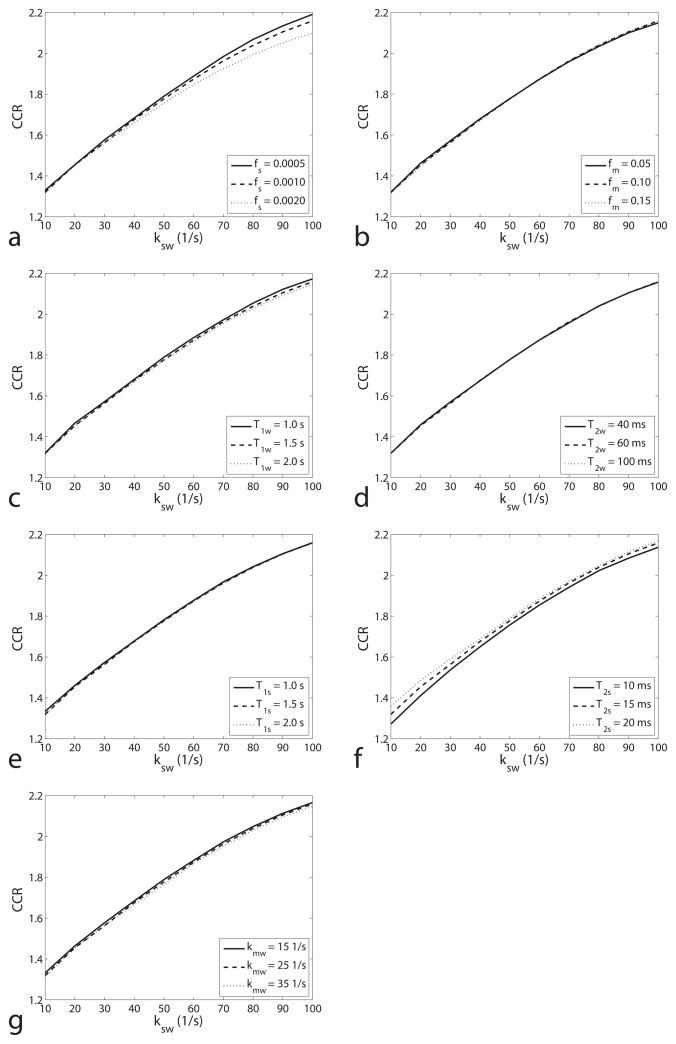
Figure 4 illustrates the dependence of CCR on ksw, while varying fs, fm, T1w, T2w, T1s, T2s and kmw. Note that CCR is a monotonic function of ksw in the range from 10 1/s to 100 1/s, and is largely independent of fs, fm, T1w, T2w, T1s, T2s, and kmw. The small dependencies on fs and T2s visible in figures 4a and 4f, respectively, cause only a roughly 5% change in CCR when doubling fs or T2s.
FIG. 4.
Simulated CEST ratio vs. ksw for different fs (a), fm (b), T1w (c), T2w (d), T1s (e) T2s (f) and kmw (g). Note that the CEST ratio is a monotonic function of ksw (10 – 100 1/s), and is roughly independent on all the other parameters in our simulation range. Although the CEST ratio changes with fs (a roughly 1% change as fs varies from 0.001 to 0.002 at ksw of 50 1/s), it is negligible compared with the changes in traditional CEST contrast (100% for the same fs variation). Simulations were performed by using a three-pool model with a symmetric MT effect.
METHOD
Phantom Preparation
A series of creatine/agar samples served as test phantoms for the proposed multi-angle pulsed-CEST pH imaging method. Creatine was added to boiled agarose solution (3% (w/w)) to reach a concentration of 40 mM. The solution was then transferred into three tubes and pH was titrated to 5.6, 6.0 and 6.4 at 46°C. Three additional samples (pH = 6.0) were made of 80 mM creatine and 3% (w/w) agarose, 40 mM creatine and 1% (w/w) agarose, 40 mM creatine with 0.05mM MnCl2 and 3% (w/w) agarose. These samples served as phantoms with different fs, fm, and relaxation rates, respectively. All chemicals were purchased from Sigma-Aldrich (St. Louis, MO, USA).
MRI and Experiment
CW and Pulsed-CEST experiments were performed on a 9.4 T Varian small animal scanner at room temperature (~25°C). The phantom was positioned coaxially within a 38 mm ID volume coil. The main magnetic field (B0) was shimmed and the RF field (B1) was calibrated before CEST experiments.
The CW-CEST experiments used an 8.0 s irradiation pulse (long compared to the measured T1 of 2.8 s) followed by a 90° single slice excitation and a free-induction decay (FID) acquisition. Scans used a recovery time of 5 s, slice thickness of 2 mm, RF pulse offsets from −4 ppm to 4 ppm, 2 averages, and an RF field strength (Bcw) of 1.0 and 1.5 μT.
The pulsed-CEST sequence used a series of Gaussian RF irradiation pulses followed by single-shot spin-echo echo planar imaging (EPI) readout and a recovery time of 5 s. After each pulse, a crusher gradient (with alternating sign) was applied to spoil residual transverse magnetizations. Images had a field of view (FOV) of 50 mm × 50 mm, matrix size of 64 × 64, echo time (TE) of 50 ms, 4 averages, and slice thickness of 2 mm.
Pulsed-CEST imaging was performed with θ of 180°, 360°, and 540° for all phantoms, and, to test the predicted angular dependence, at 12 values between 135° and 630° for a single phantom. Bavg power and duty cycle were set to be 2 μT and 30%, respectively. The corresponding τpd and τp were 14.0 ms and 4.2 ms, 28.0 ms and 8.4 ms, 42.0 ms and 12.6 ms, respectively, for the three angles. The CCR was calculated according to Eq. (4) by using the six acquired CEST signals (three angles at plus and minus offsets).
The Z-spectra obtained from the CW-CEST experiments were numerically fitted to a three-pool model, similar to the simulation equations described in the appendix, in which exchange only between water and solute, and between water and macromolecule were considered. The longitudinal relaxation time for bulk water (T1w) was separately determined by an inversion recovery experiment to be approximately 1.4 s for phantoms with MnCl2 and approximately 2.8 s for all other phantoms. Longitudinal relaxation times for solute protons and semisolid macromolecular protons (T1s, T1m) were set to 1 s for fitting the CW-CEST data (12); The transverse relaxation time (T2m) for the semisolid protons was set to be 15 μs and a Gaussian lineshape was assumed. The simulated solute proton frequency offset from water is 750 Hz to match the 1.9 ppm offset of the exchanging amine protons in the creatine phantoms. The exchange rate between macromolecular pool and water pool (kmw) was set to 170 1/s (23). The resulting ksw fitted from the CW-CEST data was used for comparison with the multi-angle metric.
RESULTS
Z-spectra were acquired with CW-CEST imaging on 40 mM creatine samples with pH 5.6, 6.0, and 6.4 and fit to the three-pool exchange model, giving parameter fits of ksw = 32 ± 7, 57 ± 5, and 84 ± 4 1/s; fs = 0.0011 ± 0.0002, 0.00090 ± 0.0002, and 0.00090 ± 0.0001; and fm = 0.016± 0.001, 0.016 ± 0.001, and 0.015 ± 0.001, respectively.
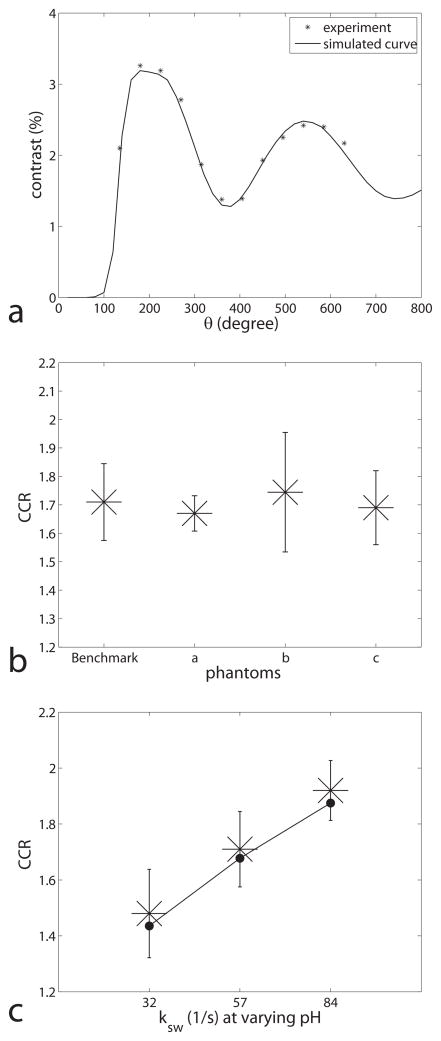
Figure 5a gives the experimental CEST contrast vs. θ on a sample with creatine concentration of 40 mM, agar concentration 3 % (w/w), and pH of 6.0. A simulation curve with parameters from the fitting results on the same sample is also given. The results are shifted to slightly higher angles compared to the amide simulations in figure 2 due to the smaller frequency offset of amines, but otherwise validate the expected angular signal dependence underlying CEST imaging. Figure 5b plots the experimental CCR (calculated using equation 4) for samples with constant pH but varying fs, T1w, and fm. Note the independence of CCR from the varied sample parameters (including solute concentration). Figure 5c plots the experimental CCR at three different pH values (and with exchange rates quantified by independent continuous wave CEST experiments), but constant fs, T1w, and fm. Note the monotonic relationship between CCR and the exchange rate when ksw is in the physiological range expected for amides.
FIG. 5.
(a) Experimental (star) and simulated (solid line) CEST contrasts for a creatine/agar sample vs. θ. The simulation parameters were from the fitting results from a CW-CEST experiment on the same sample. (b) Experimental CEST contrast ratios for creatine/agar samples with benchmark, a, b, and c on the x-axis representing three samples with approximately the same ksw (57± 5, 55 ± 4, 59 ± 6, and 56 ± 4 1/s, respectively), but high fs = 0.0019 ± 0.0002 for sample ‘a’(vs. 0.0009 for ‘benchmark’, ‘b’ and ‘c’), short T1w = 1.42 ± 0.06 s for sample ‘b’(vs. 2.80 s for ‘benchmark’, ‘a’ and ‘c’), and low fm = 0.005 ± 0.001 for sample ‘c’ (vs. 0.016 for ‘benchmark’, ‘a’ and ‘b’). (c) Experimental CEST contrast ratio vs. the titrated pH. The fitted ksw are 32 1/s, 57 1/s, and 84 1/s for pH of 5.6, 6.0, and 6.4, respectively. Note that the ratio changes with ksw in figure 5c, but not other parameters in figure 5b. Also note that the experimental results (star) are close to our simulation results (dot) with fitted parameters.
DISCUSSION
In this study, we successfully separate ksw from fs, T1w, T2w and MT based on a ratiometric approach. The pulsed-CEST contrast has an oscillating [~cos(θ)] component. By normalizing the pulsed CEST contrast with the contrast at a control θ under the same Bavg power, we found through numerical simulations that the oscillation is dependent on ksw and T2s, but not fs, fm, T1w, T2w, T1s or kmw. Therefore, ksw specific imaging can be acquired by using feature points on the curve to recognize the oscillations.
The differential dependence of the oscillation on ksw, T2s, fs, T1w, T2w, fm and kmw can be explained by the effect of the rotation of the solute pool magnetization on the measured water pool magnetization. Our simulations indicate that there are no direct oscillatory effects on the water or macromolecular pools (not shown). Instead, the oscillation in the CEST signal is due to the transfer of the oscillation of the solute magnetization.
FLEX (24) is another method based on the transfer of solute oscillation to the measured water signal. In FLEX, it is the degree of solute precession about B0 as a function of the evolution time that exchanges with water. Hence the name is frequency-labeled exchange (FLEX). In distinction, in our method we isolate the exchange effects of solute magnetization rotation about B1 as a function of the integrated B1 strength. Hence, an apt name i chemical exchange rotation transfer (CERT). While rotation effects have previously been incorporated into CEST methods (22,25), the proposed multi-angle ratiometric approach is the first to isolate rotation effects as a function of the RF induced turn angle.
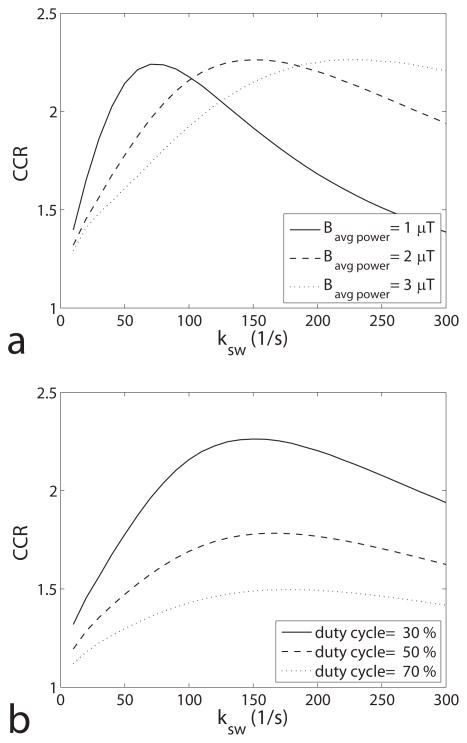
In addition to ksw and T2s, the oscillation is also dependent on Bavg power and duty cycle. Figure 6a and b give CCR as a function of ksw for different Bavg power and duty cycle, respectively. It was found that lower Bavg power (with constant duty cycle and increased τpd) or lower duty cycle (with constant Bavg power and increased τpd) increase the sensitivity of the ratiometric (i.e. slope of CCR vs. ksw in the monotonic range), and therefore Bavg power and duty cycle can be used as additional control parameters. It was also found that CCR is not a monotonic function of ksw in the relatively faster exchange regime. Monotonic relationships were found in the exchange range below 70 1/s, 150 1/s, and 220 1/s with Bavg power of 1.0 μT, 2.0μT, and 3.0 μT, respectively, which roughly corresponds to a monotonic function below γBavg power/π. However, this monotonic range is independent of duty cycle. Therefore, sensitivity and monotonic range should be considered together when choosing Bavg power and duty cycle. In this paper, Bavg power of 2 μT and duty cycle of 30% were chosen, which give good monotonic range below 100 1/s and relatively good sensitivity.
FIG. 6.
(a) Simulated CEST contrast ratio vs. ksw for Bavg power of 1.0, 2.0 and 3.0 μT and duty cycle of 30%. Note that the monotonic range of CCR on ksw changes with Bavg power. (b) Simulated CEST contrast ratio vs. ksw for duty cycle of 30%, 50% and 70% and Bavg power of 2.0 μT. Note that the monotonic range does not change with duty cycle. Simulations were performed by using a three-pool model with symmetric MT effects.
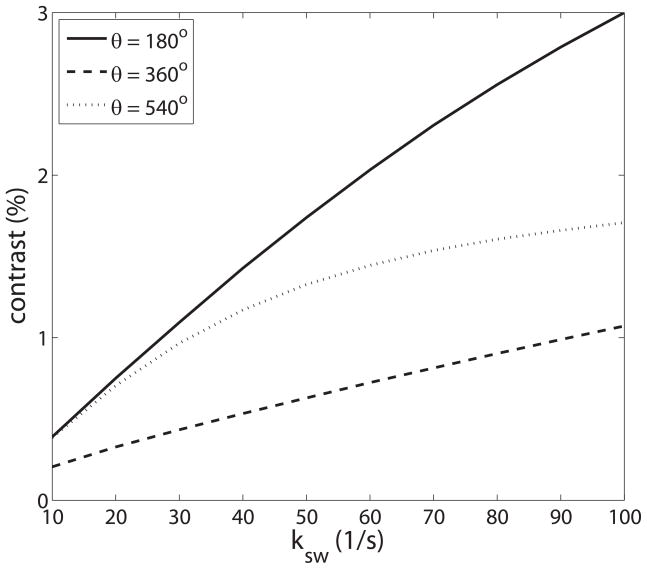
The proposed multi-angle ratiometric approach has similarities to previous pH detection methods. In this study, we found that pulsed-CEST contrast at each θ has distinct ksw-dependent CEST properties (see figure 7), which accounts for the dependence of the oscillation on ksw. Ward et al. (3) have described a similar ratiometric approach to obtain pH maps which are independent of fs. In Ward’s ratiometric approach, a particular agent with at least two exchange sites was used. Each exchange site has different pH-dependent CEST properties. The ratio of the signal acquired at these two exchange sites can eliminate fs. While Ward’s approach requires exogenous CEST agents with particular multi-site and well characterized exchange, our method is focused on endogenous amide and amine exchange. A second method was proposed by Sun et al. (6) by using the optimal RF power to simultaneously acquire labile proton concentration and exchange rate. This method is based on the ksw dependence of the CEST contrast vs. power, as opposed to our investigation of CEST contrast vs. θ.
FIG. 7.
CEST contrast vs. ksw for θ of 180°, 360° and 540°. Note that the CEST contrast at different θ has different ksw-dependent CEST properties. Simulations were performed using a three-pool model with a symmetric MT effect.
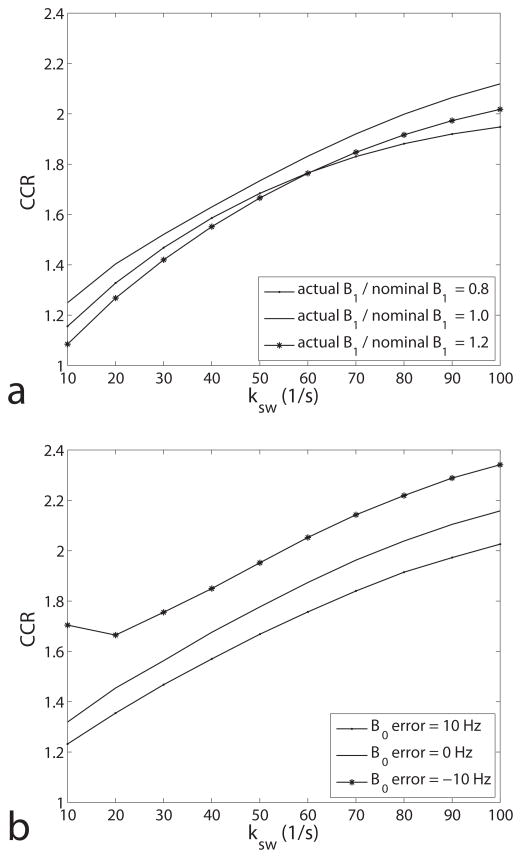
All currently proposed quantitative CEST imaging methods (including the new ratiometric approach) need further development to be accurate in vivo, including corrections for B0 and B1 inhomogeneities and any possible macromolecular asymmetry (26,27). One possible approach to correcting the field inhomogeneities is to acquire over a range of offsets/powers (28,29) along with RF and static field mapping. Without correction, figure 8 indicates much smaller effects from typical B1 vs. B0 inhomogeneities. The macromolecular proton resonance was assumed in our simulations to be symmetric about the water proton resonance. Macromolecular asymmetry, when it occurs in, for example, white matter (8,30), is more problematic and may require a correction term in Eq. 4. In addition, changes in T2s also affect the calculated CCR, with decreases in T2s creating similar effects as decreases in the exchange rate ksw, as seen in figure 4f.
FIG. 8.
Plot of CEST contrast ratio as a function of ksw with B1 error (a) and B0 error (b). Note that the ratiometric is relatively robust to B1 error, but sensitive to B0 error.
Figure 4 shows that the curve of CCR vs. ksw is roughly linear at slow exchange rates and figure 6a shows that the linear range increases with power. We also found that this curve is roughly independent of sample parameters (in our simulation range). Therefore, the curves given in figure 4 can be used as calibration curve to quantify ksw in APT imaging. As an example, the amide exchange simulated by the middle curves in figure 4 can be fit (between ksw = 30 to 80 1/s) to a linear calibration curve of CCR = 0.0095ksw+1.3 (R2 = 0.974), while CCR = 0.0084ksw+1.2 (R2 = 0.975) fits the corresponding amine simulation (not shown). This calibration curve can be used to determine ksw from the CCR value, giving ksw = 33, 61, and 86 1/s for the pH = 5.6, 6.0, and 6.4 phantom, respectively, plotted in figure 5c. While these results agree well with the values from CW-CEST fittings (32, 57, and 84 1/s), in general, biases from B1 and, more significantly, B0 inhomogeneities (figure 8) are likely to make exchange rate weighted CCR images more useful than uncorrected quantitative ksw maps.
CONCLUSION
In this study, we provide quantitative exchange rate and exchange rate weighed imaging methods which are not affected by the solute and macromolecular concentration and water relaxation. To perform the ratio imaging, Bavg power should be kept constant at different θ, and sensitivity and monotonic range should be also considered together when adjusting the Bavg power and duty cycle.
Acknowledgments
Grant Sponsor: Vanderbilt Bridge Funding and NIH EB001744
We thank Jared Cobb, Adrienne Dula, Bruce M. Damon, Martin Lepage, Seth A Smith, and Thedore Towse for helpful discussions, and Vanderbilt Bridge Funding (Gochberg) and NIH grant EB001744 (Does) for funding.
APPENDIX: Numerical Simulation and Data Processing
CEST contrast was numerically simulated using a three-pool (solute/macromolecular/water) exchange model in Matlab. The model contains seven coupled Bloch equations,
| (A1) |
| (A2) |
| (A3) |
| (A4) |
| (A5) |
| (A6) |
| (A7) |
where the subscripts w, s and m denote the water, solute, macromolecular pools. The water and solute pools each has three coupled equations representing their x, y, and z components. The macromolecular pool has a single coupled equation representing the z component, with an additional term for saturation effects (31). ω1 is the angular precession frequency induced by the pulse, ωrf is the frequency offset of the applied saturation pulse compared to that of the water, ωs is the frequency offset of the solute compared to that of the water, and ωw is 0. W is the saturation rate of the macromolecular pool,
| (A8) |
All numerical calculations of the pulsed-CEST signal integrated the differential equations through the pulse sequence using the ordinary differential equation (ODE) solver in Matlab. The simulation assumed the steady-state had been reached when the difference in magnetization differed by less than 0.001% from that of the previous repetition. Spoiling was modeled by nulling the transverse components of the magnetization before and after the irradiation pulse.
CEST contrast was numerically simulated for a range of acquisition and sample parameters. Dependence on θ (20° – 800° with step of 20°) was examined for different ksw, fs, T1w, T2w, T1s, T2s, fm and kmw in a three-pool model with symmetric macromolecular lineshape. We varied ksw (20, 50, 80 1/s), fs (0.0005, 0.001, 0.002), T1w (1.0, 1.5, 2.0 s), T2w (40, 60, 100 ms), T1s (1.0, 1.5, 2.0 s), T2s (10, 15, 20 ms), fm (0.05, 0.10, 0.15) and kmw (15, 25, 35 1/s). Each parameter was varied individually, with all other parameters remaining at the value in bold. Other simulation parameters include: T1m of 1 s, T2m of 15 μs, and, in order to match the expected parameters of amide exchange in tissue, a frequency offset of 3.5 ppm, and a super-Lorentzian macromolecular absorption lineshape (8,32–34). Bavg power and duty cycle were set to be 2.0 μT and 30%, respectively.
In order to specifically determine the detailed dependencies of CCR (Eq. 4), we expanded the simulations for θ equal to 180°, 360°, and 540°. Dependence on exchange was simulated for ksw between 10 and 100 1/s (step of 10 1/s) and all other parameters varied as listed above. Dependence on Bavg power (1, 2, 3 μT) and duty cycle (30%, 50%, 70%) was simulated with only the parameter values in bold above and ksw between 10 and 300 1/s (step of 10 1/s). Dependence on B0 (± 10 Hz) and B1 (± 20%) inhomogeneities was simulated with the parameter values in bold above and ksw between 10 and 100 1/s (step of 10 1/s).
References
- 1.Ward KM, Aletras AH, Balaban RS. A new class of contrast agents for MRI based on proton chemical exchange dependent saturation transfer (CEST) Journal of Magnetic Resonance. 2000;143(1):79–87. doi: 10.1006/jmre.1999.1956. [DOI] [PubMed] [Google Scholar]
- 2.Aime S, Barge A, Castelli DD, Fedeli F, Mortillaro A, Nielsen FU, Terreno E. Paramagnetic lanthanide(III) complexes as pH-sensitive chemical exchange saturation transfer (CEST) contrast agents for MRI applications. Magnetic Resonance in Medicine. 2002;47(4):639–648. doi: 10.1002/mrm.10106. [DOI] [PubMed] [Google Scholar]
- 3.Ward KM, Balaban RS. Determination of pH using water protons and chemical exchange dependent saturation transfer (CEST) Magnetic Resonance in Medicine. 2000;44(5):799–802. doi: 10.1002/1522-2594(200011)44:5<799::aid-mrm18>3.0.co;2-s. [DOI] [PubMed] [Google Scholar]
- 4.Zhou JY, Payen JF, Wilson DA, Traystman RJ, van Zijl PCM. Using the amide proton signals of intracellular proteins and peptides to detect pH effects in MRI. Nature Medicine. 2003;9(8):1085–1090. doi: 10.1038/nm907. [DOI] [PubMed] [Google Scholar]
- 5.Sun PZ, Zhou JY, Huang J, van Zijl P. Simplified quantitative description of amide proton transfer (APT) imaging during acute ischemia. Magnetic Resonance in Medicine. 2007;57(2):405–410. doi: 10.1002/mrm.21151. [DOI] [PubMed] [Google Scholar]
- 6.Sun PZ. Simultaneous determination of labile proton concentration and exchange rate utilizing optimal RF power: Radio frequency power (RFP) dependence of chemical exchange saturation transfer (CEST) MRI. Journal of Magnetic Resonance. 2010;202(2):155–161. doi: 10.1016/j.jmr.2009.10.012. [DOI] [PMC free article] [PubMed] [Google Scholar]
- 7.Sun PZ, Sorensen AG. Compensatory Amide Proton Transfer Ratio (CAPTOR) Imaging to Improve the Specificity of Tissue Acidosis MRI. Proceedings of the 17th Annual Meeting of ISMRM; Honolulu, Hawaii, USA. 2009. p. 4480. [Google Scholar]
- 8.Hua J, Jones CK, Blakeley J, Smith SA, van Zijl PCM, Zhou JY. Quantitative description of the asymmetry in magnetization transfer effects around the water resonance in the human brain. Magnetic Resonance in Medicine. 2007;58(4):786–793. doi: 10.1002/mrm.21387. [DOI] [PMC free article] [PubMed] [Google Scholar]
- 9.McMahon MT, Gilad AA, Zhou JY, Sun PZ, Bulte JWM, van Zijl PCM. Quantifying exchange rates in chemical exchange saturation transfer agents using the saturation time and saturation power dependencies of the magnetization transfer effect on the magnetic resonance imaging signal (QUEST and QUESP): pH calibration for poly-L-lysine and a starburst dendrimer. Magnetic Resonance in Medicine. 2006;55(4):836–847. doi: 10.1002/mrm.20818. [DOI] [PMC free article] [PubMed] [Google Scholar]
- 10.Dixon WT, Ren JM, Lubag AJM, Ratnakar J, Vinogradov E, Hancu I, Lenkinski RE, Sherry AD. A Concentration-Independent Method to Measure Exchange Rates in PARACEST Agents. Magnetic Resonance in Medicine. 2010;63(3):625–632. doi: 10.1002/mrm.22242. [DOI] [PMC free article] [PubMed] [Google Scholar]
- 11.Dixon WT, Hancu I, Ratnakar SJ, Sherry AD, Lenkinski RE, Alsop DC. A Multislice Gradient Echo Pulse Sequence for CEST Imaging. Magnetic Resonance in Medicine. 2010;63(1):253–256. doi: 10.1002/mrm.22193. [DOI] [PMC free article] [PubMed] [Google Scholar]
- 12.Sun PZ, Benner T, Kumar A, Sorensen AG. Investigation of optimizing and translating pH-sensitive pulsed-chemical exchange saturation transfer (CEST) imaging to a 3T clinical scanner. Magnetic Resonance in Medicine. 2008;60(4):834–841. doi: 10.1002/mrm.21714. [DOI] [PMC free article] [PubMed] [Google Scholar]
- 13.Zhou JY, Lal B, Wilson DA, Laterra J, van Zijl PCM. Amide proton transfer (APT) contrast for imaging of brain tumors. Magnetic Resonance in Medicine. 2003;50(6):1120–1126. doi: 10.1002/mrm.10651. [DOI] [PubMed] [Google Scholar]
- 14.Gowland PA, Mougin OE, Coxon RC, Pitiot A. Magnetization transfer phenomenon in the human brain at 7 T. Neuroimage. 2010;49(1):272–281. doi: 10.1016/j.neuroimage.2009.08.022. [DOI] [PubMed] [Google Scholar]
- 15.Sun PZ, Benner T, Copen WA, Sorensen AG. Early Experience of Translating pH-Weighted MRI to Image Human Subjects at 3 Tesla. Stroke. 2010;41(10):S147–S151. doi: 10.1161/STROKEAHA.110.595777. [DOI] [PMC free article] [PubMed] [Google Scholar]
- 16.Flask CA, Shah T, Lu L, Dell KM, Pagel MD, Griswold MA. CEST-FISP: A Novel Technique for Rapid Chemical Exchange Saturation Transfer MRI at 7 T. Magnetic Resonance in Medicine. 2011;65(2):432–437. doi: 10.1002/mrm.22637. [DOI] [PMC free article] [PubMed] [Google Scholar]
- 17.Zhou JY, Zhu H, Jones CK, van Zijl PCM, Barker PB. Fast 3D Chemical Exchange Saturation Transfer (CEST) Imaging of the Human Brain. Magnetic Resonance in Medicine. 2010;64(3):638–644. doi: 10.1002/mrm.22546. [DOI] [PMC free article] [PubMed] [Google Scholar]
- 18.Schmitt B, Zaiss M, Zhou JY, Bachert P. Optimization of Pulse Train Presaturation for CEST Imaging in Clinical Scanners. Magnetic Resonance in Medicine. 2011;65(6):1620–1629. doi: 10.1002/mrm.22750. [DOI] [PubMed] [Google Scholar]
- 19.Reddy R, Haris M, Cai KJ, Singh A, Hariharan H. In vivo mapping of brain myo-inositol. Neuroimage. 2011;54(3):2079–2085. doi: 10.1016/j.neuroimage.2010.10.017. [DOI] [PMC free article] [PubMed] [Google Scholar]
- 20.Lepage M, Gochberg DF, Gore JC. Towards quantitative CEST imaging. Proceedings of the 11th Annual Meeting of ISMRM; Toronto, Ontario, Canada. 2003. p. 224. [Google Scholar]
- 21.Desmond KL, Stanisz GJ. Quantitative Pulsed CEST. Proceedings of the 17th Annual Meeting of ISMRM; Honolulu, Hawaii, USA. 2009. p. 4479. [Google Scholar]
- 22.Zu Z, Li K, Janve VA, Does MD, Gochberg DF. Optimizing pulsed-chemical exchange saturation transfer imaging sequences. Magnetic Resonance in Medicine. 2011;66(4):1100–1108. doi: 10.1002/mrm.22884. [DOI] [PMC free article] [PubMed] [Google Scholar]
- 23.Henkelman RM, Huang XM, Xiang QS, Stanisz GJ, Swanson SD, Bronskill MJ. Quantitative Interpretation of Magnetization-Transfer. Magnetic Resonance in Medicine. 1993;29(6):759–766. doi: 10.1002/mrm.1910290607. [DOI] [PubMed] [Google Scholar]
- 24.Friedman JI, McMahon MT, Stivers JT, Van Zijl PCM. Indirect Detection of Labile Solute Proton Spectra via the Water Signal Using Frequency-Labeled Exchange (FLEX) Transfer. Journal of the American Chemical Society. 2010;132(6):1813. doi: 10.1021/ja909001q. [DOI] [PMC free article] [PubMed] [Google Scholar]
- 25.van Zijl PCM, Yadav NN. Chemical Exchange Saturation Transfer (CEST): What is in a Name and What Isn’t? Magnetic Resonance in Medicine. 2011;65(4):927–948. doi: 10.1002/mrm.22761. [DOI] [PMC free article] [PubMed] [Google Scholar]
- 26.Scheidegger R, vinogradov E, Alsop DC. Amide Proton Transfer Imaging With Improved Robustness to Magnetic Field Inhomogeneity and Magneization Transfer Asymmetry Using Saturation With Frequency Alternating RF Irradiation. Magnetic Resonance in Medicine. doi: 10.1002/mrm.22912. (in press) [DOI] [PMC free article] [PubMed] [Google Scholar]
- 27.Sun PZ, Farrar CT, Sorensen AG. Correction for artifacts induced by B-0 and B-1 field inhomogeneities in pH-Sensitive chemical exchange saturation transfer (CEST) Imaging. Magnetic Resonance in Medicine. 2007;58(6):1207–1215. doi: 10.1002/mrm.21398. [DOI] [PubMed] [Google Scholar]
- 28.Kim M, Gillen J, Landman BA, Zhou JY, van Zijl PCM. Water Saturation Shift Referencing (WASSR) for Chemical Exchange Saturation Transfer (CEST) Experiments. Magnetic Resonance in Medicine. 2009;61(6):1441–1450. doi: 10.1002/mrm.21873. [DOI] [PMC free article] [PubMed] [Google Scholar]
- 29.Wei W, Jia G, Sammet S, Wassenaar P, Zhou JY, Knopp M. Improving Amide Proton Transfer Imaging with Dual Echo B0 Mapping for Field Inhomogeneity Correction at 3T. Proceedings of the 18th Annual Meeting of ISMRM; Toronto, Ontario, Canada. 2010. p. 2986. [Google Scholar]
- 30.Pekar J, Jezzard P, Roberts DA, Leigh JS, Frank JA, McLaughlin AC. Perfusion imaging with compensation for asymmetric magnetization transfer effects. Magnetic Resonance in Medicine. 1996;35(1):70–79. doi: 10.1002/mrm.1910350110. [DOI] [PubMed] [Google Scholar]
- 31.Sled JG, Pike GB. Quantitative interpretation of magnetization transfer in spoiled gradient echo MRI sequences. Journal of Magnetic Resonance. 2000;145(1):24–36. doi: 10.1006/jmre.2000.2059. [DOI] [PubMed] [Google Scholar]
- 32.Tozer D, Ramani A, Barker GJ, Davies GR, Miller DH, Tofts PS. Quantitative magnetization transfer mapping of bound protons in multiple sclerosis. Magnetic Resonance in Medicine. 2003;50(1):83–91. doi: 10.1002/mrm.10514. [DOI] [PubMed] [Google Scholar]
- 33.Morrison C, Henkelman RM. A Model for Magnetization-Transfer in Tissues. Magnetic Resonance in Medicine. 1995;33(4):475–482. doi: 10.1002/mrm.1910330404. [DOI] [PubMed] [Google Scholar]
- 34.Morrison C, Stanisz G, Henkelman RM. Modeling Magnetization-Transfer for Biological-Like Systems Using a Semisolid Pool with a Super-Lorentzian Lineshape and Dipolar Reservoir. Journal of Magnetic Resonance Series B. 1995;108(2):103–113. doi: 10.1006/jmrb.1995.1111. [DOI] [PubMed] [Google Scholar]


