Abstract
Early clinical results with time-of-flight (TOF) PET systems have demonstrated the advantages of TOF information in PET reconstruction. Reconstruction approaches in TOF-PET systems include list-mode and binned iterative algorithms as well as confidence-weighted analytic methods. List-mode iterative TOF reconstruction retains the resolutions of the data in the spatial and temporal domains without any binning approximations but is computationally intensive. We have developed an approach [DIRECT (direct image reconstruction for TOF)] to speed up TOF-PET reconstruction that takes advantage of the reduced angular sampling requirement of TOF data by grouping list-mode data into a small number of azimuthal views and co-polar tilts and depositing the grouped events into histo-images, arrays with the sampling and geometry of the final image. All physical effects are included in the system model and deposited in the same histo-image structure. Using histo-images allows efficient computation during reconstruction without ray-tracing or interpolation operations. The DIRECT approach was compared with 3D list-mode TOF ordered subsets expectation maximization (OSEM) reconstruction for phantom and patient data taken on the University of Pennsylvania research LaBr3 TOF-PET scanner. The total processing and reconstruction time for these studies with DIRECT without attention to code optimization is approximately 25–30% that of list-mode TOF-OSEM to achieve comparable image quality. Furthermore, the reconstruction time for DIRECT is independent of the number of events and/or sizes of the spatial and TOF kernels, while the time for list-mode TOFOSEM increases with more events or larger kernels. The DIRECT approach is able to reproduce the image quality of list-mode iterative TOF reconstruction both qualitatively and quantitatively in measured data with a reduced time.
Keywords: Time-of-flight PET, PET reconstruction
I. INTRODUCTION
Including time-of-flight (TOF) information in PET reconstruction has been shown to improve clinical PET images [1]–[3]. A variety of reconstruction approaches exist for three-dimensional (3D) TOF-PET data. The analytic confidence weighted back-projection approach, originally described in the 1980s for two-dimensional (2D) data [4]–[6], included the 2D probability density function defined by the spatial and timing resolutions in the back-projection, followed by filtering of these pre-images. This approach has been extended to 3D data [7]. Axial single-slice and Fourier rebinning approaches followed by 2D reconstruction have been described [8]–[10]; these techniques include rebinning of the TOF data into nonTOF arrays [11]. Iterative reconstruction algorithms such as ordered subsets expectation maximization (OSEM) [12] and list-mode OSEM [13] have been modified to include TOF information: fully 3D implementations of the TOF-OSEM algorithm from list-mode data have been described by Popescu, et al. [14] and Groiselle and Glick [15].
3D list-mode iterative TOF reconstruction with system modeling of all physical effects retains the resolutions of the data in the spatial and temporal domains without any binning approximations. However, this approach is computationally intensive, especially when spatial resolution modeling is included because the time for the forward- and back-projection operations for each event is strongly dependent on the sizes of the spatial and TOF kernels. To reduce the reconstruction time, a clinical implementation of 3D list-mode TOF-OSEM reconstruction uses multiple (10–20) processors and sub-optimal reconstruction parameter choices (e.g., stopping criteria determined by the reconstruction time rather than convergence and use of a truncated TOF kernel to speed up the forward- and back-projection steps) [16].
The direct image reconstruction for TOF-PET (DIRECT) approach [17] was developed to speed up reconstruction with minimal loss of accuracy (1) by taking advantage of the reduced angular sampling requirements of TOF-PET (i.e., the data can be grouped into a limited set of views) and (2) through efficient data partitioning into a set of image-equivalent structures (one per view), so-called “histo-images” (described below). As has been noted by Politte, et al. [18] and more recently by Vandenberghe, et al. [19], PET data with TOF information have considerable redundancy in angular sampling. This leads to a reduction in the in-plane and axial angular sampling requirements with TOF information that is dependent on the timing resolution of the system. The required angular sampling depends on the underlying spatial resolution of the line of response (LOR) data (full-width-at-half-maximum, FWHMLOR) and the timing resolution (FWHMTOF). Following the discussion and Fig. 2 in [19], one can estimate the maximum angular interval (αmax) that provides adequate sampling consistent with the spatial resolution of the data as
| (1) |
In this calculation, FWHMLOR is defined by the detector spatial resolution rather than the pixel size as was done in [19]. The subsequent minimum number of transverse angular samples (nϕmin) and tilt angles (nθmin) can be calculated from
| (2) |
| (3) |
where θmax is the full axial angular range of the scanner. For a whole-body TOF-PET scanner with 6-mm resolution and 430-ps timing resolution, only 17 transverse angular samples and 2 oblique tilt angles are required; for a scanner with 700-ps timing resolution, 28 transverse views and 3 oblique tilt angles are needed. In contrast, 3D list-mode data from a whole-body scanner have 250–350 transverse angular samples and 40–60 oblique tilt angles. In the extreme case of perfect TOF resolution, a single view would fully sample the object.
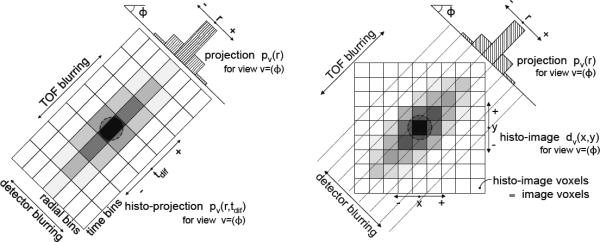
The first step in DIRECT is the reduction of the data size by grouping the acquired events into a set of transverse views and tilts, consistent with the TOF angular sampling requirements. These grouped events are then deposited into histo-images. A histo-image has the same array structure as the reconstructed image with the geometry determined by the desired voxel size, as illustrated in Fig. 1 (right). Deposition is done by histogramming the events into the most likely positions (voxels) within the histo-image defined by their LOR indices and TOF differences, similar to early TOF reconstructions with the most likely position (MLP) algorithm [6]. Unlike the early MLP reconstructions, the histo-image acts as the data array for iterative reconstruction in DIRECT. The forward-projection (and back-projection) operations – which model (1) acquisition of the TOF-PET events, (2) their grouping into a set of views, and (3) deposition of the view-grouped events into histo-images – can then be described as a convolution-like operation with an elongated ellipsoidal TOF/LOR resolution kernel describing the scanner (where each view has a different kernel). For spatially invariant kernels this operation can be performed very efficiently using Fourier-based methods [17]. For spatially variant kernels, an efficient implementation has been developed using graphical processing units (GPUs) [20].
Fig. 1.
Comparison of TOF data at a 45° transverse (azimuthal) angle binned into histo-projections (left) and partitioned into histo-images with the DIRECT approach (right). Histo-projections can be thought of as an extension of individual non-TOF projections (radial bins) along the TOF direction (time bins); the sampling intervals relate to the projection geometry and TOF resolution. Histo-images are defined by the geometry and desired sampling (voxel size) of the reconstructed images. For simplicity we illustrate only the 2D case; extension to the 3D case is straightforward: histo-images become 3D voxelized images, and views are defined by both transverse (azimuthal) and co-polar (tilt) angles. The schematics shown represent the deposition of many events from one source location.
Unlike the more conventional histo-projections (Fig. 1-left), the histo-image format allows for efficient computation (and memory utilization) during reconstruction without ray-tracing or interpolation because the same structure is used for both data and images as well as for the corrections for physical effects. The angular sampling approximations are the same for histo-images and histo-projections, but because there are no further interpolation steps between image and data spaces, the histo-image format leads to faster reconstruction speeds with no additional loss of resolution.
Initial performance results with DIRECT for simulated, trues-only data showed significant speed-up without loss of image quality, compared with 3D list-mode iterative TOF reconstruction [17]. The goals of this study were to examine the performance of DIRECT with measured phantom and patient data, including all real data effects, and to extend the comparison of the reconstruction quality/time trade-off of DIRECT and 3D list-mode iterative TOF-PET reconstruction through a more thorough assessment of the DIRECT approach.
II. Materials and Methods
A. Reconstruction Approaches – Implementation
1) DIRECT
List-mode data are first deposited into histo-images; in our implementation, the deposition uses tri-linear interpolation. The application of DIRECT to measured data required consideration of the confounding effects in measured data: gaps between detector modules, detector efficiency differences, attenuation correction, and corrections for random and scattered events. Because of the view-grouping, gaps between the detector modules propagate into the histo-images in irregular, spatially-varying ways (see Fig. 2). Gaps are included in DIRECT by setting projection lines through the gaps to zero in the sensitivity matrix calculation; the projections are sub-sampled to model the edges of the gaps accurately. Attenuation factors are efficiently calculated from the transmission image using Fourier-based forward-projectors [22] [23]. Attenuation and detector normalization effects are included along with the gaps in the sensitivity matrix and applied during the forward-and back-projection steps as multiplicative factors. The incorporation of multiplicative correction factors in DIRECT is discussed in detail in [17]. TOF information is included as a Gaussian kernel in the forward- and back-projection steps, as well. Delayed events are deposited into histo-images and then smoothed with a 3D Hann filter (cutoff: 0.5 × Nyquist frequency) to minimize the contribution of noise in the randoms to the final image. Scattered events are estimated using the single-scatter simulation (SSS) method, updated for TOF-PET data [24] [25]. Our implementation of SSS-TOF has been modified to operate directly on data in histo-image format rather than the LOR sinogram format used in list-mode iterative reconstruction.
Fig. 2.

Deposited data from a cylindrical phantom study for three transverse angular views out of 40, showing the effect of gaps between detector modules on histo-images. The data are from the University of Pennsylvania research LaBr3 TOF-PET system [21], which has 24 detector modules with gaps between modules, each approximately 8 mm, or two crystals, wide. Because of the grouping of angles, gaps do not show up as solid dark bands at regular intervals in the histo-images but as regions of variable, decreased intensity.
Because of our experience with the row-action maximum likelihood algorithm (RAMLA) [26], many of the reconstructions presented with DIRECT used the RAMLA update (“DIRECT-RAMLA”). However, in order to compare results more directly with those from iterative list-mode TOFOSEM, the OSEM update was also implemented in DIRECT (“DIRECT-OSEM”). Both RAMLA and OSEM are maximum likelihood expectation maximization (MLEM) algorithms with similar performance; using the OSEM update in DIRECT for comparisons with list-mode TOF-OSEM removes a potential source of variability between the approaches. In any comparisons shown, the same update equation (RAMLA or OSEM) was used.
For DIRECT-RAMLA reconstructions, the sequence of the processed views was ordered based on the golden ratio [27], which minimizes the overlap between successive views. For DIRECT-OSEM reconstructions, 5 subsets were used, and the grouping and selection of views in a given subset as well as the ordering of the subsets used the same golden ratio methodology. For DIRECT reconstruction the grouping of events into a limited number of views necessitates that the number of OSEM subsets is lower than for list-mode TOF-OSEM, which processes events from all available angles. Except as noted, the spatial LOR resolution kernel used in DIRECT was a 4-mm FWHM Gaussian in both the radial and axial directions to model only the width of the LOR for 4-mm crystals but not detector blurring effects. We refer to this LOR kernel as the case without detector resolution modeling. However, as will be seen, this small LOR kernel does provide some small contrast enhancement. In addition, a spherically symmetric Gaussian image kernel was used to model the deposition of events into voxels. The inclusion of a model of detector resolution blurring effects in the DIRECT framework was evaluated by using a spatially invariant LOR resolution kernel with a 7.9-mm FWHM instead of the 4-mm LOR resolution kernel described above. This wider kernel models the additional detector-based resolution losses beyond detector sampling in the scanner and represents the FWHM of the line spread function at a radius of 8.5 cm, the average radius of the objects studied. In the studies in this work, the LOR, TOF, and image kernels adequately control the resolution vs. noise properties, and consequently, no post-filtering was performed, and no explicit relaxation was used. For all reconstructions 4-mm × 4-mm × 4-mm voxels (144 × 144 × 48 arrays) were used.
2) 3D list-mode TOF-OSEM
As was done for the simulated data in [17], the 3D list-mode iterative TOF-OSEM algorithm [14] was used as the gold standard approach. Attenuation and detector normalization effects are included as multiplicative factors in the system model; scatter is estimated using SSS-TOF in LOR space and included along with smoothed [28] measured random coincidences as additive factors in the system model. The TOF kernel is modeled as a Gaussian; to minimize kernel truncation artifacts, the Gaussian function is not truncated until its magnitude is below 1% of the peak. Blob basis functions [29] placed on a body-centered cubic (BCC) grid [30] were used in the reconstructions without detector resolution modeling; the final images were interpolated to 4-mm × 4-mm × 4-mm voxels. Since blob basis functions have been shown to control noise without the need for post-filtering while maintaining resolution, compared with voxels [31], no relaxation or post-filtering was explicitly performed, consistent with the clinical reconstruction protocols at the University of Pennsylvania. To compare the images reconstructed using DIRECT with detector resolution modeling, a spatially invariant 7.9-mm Gaussian LOR resolution model was also included in the system model of list-mode TOF-OSEM. For reconstructions with detector resolution modeling a voxel basis function was used to avoid confounding the effects of the spherically symmetric blob basis functions with the LOR resolution model. All list-mode TOF-OSEM reconstructions used 25 chronological subsets for up to 20 iterations.
B. Sphere phantom study
A 35-cm diameter, 30-cm long cylinder containing five 10-mm diameter spheres with a sphere:background activity ratio of 6:1 was imaged on the University of Pennsylvania research LaBr3 TOF-PET scanner [21], [32]. The spheres were centered axially at three radial positions (r = 0, 8, and 11 cm). 164 M prompts and 40 M delayed events were acquired; the scatter fraction was 37% for a total of 76 M true events. The intrinsic timing resolution of the scanner is 375 ps; count rate effects degraded the timing resolution of this study to 430 ps. To assess the impact of timing resolution on the performance of DIRECT, the timing information of each event was also blurred using random sampling of a Gaussian function to obtain a data set with 700-ps timing resolution. This TOF resolution corresponds to that achieved in clinical studies on the Philips Gemini TF TOF-PET scanner, which also exhibits a count-rate dependent TOF resolution [33].
To improve the precision of the study, additional data from 15 10-mm hot spheres at various locations in the background were fused with the phantom's list-mode data, analogous to the method described in [34], [35]. The spheres were first imaged in air on the scanner. The number of sphere events (N+) that would result in a sphere:background ratio of 6:1 (R=6) was extracted from each sphere's list-mode file using
| (4) |
where was the average value in the background of the phantom image without inserted spheres, and and were the total counts in the sphere-in-air data file and image, respectively. To include attenuation effects from the cylindrical phantom, the sphere events were then reduced by rejecting events using random sampling of the probability of attenuation by the cylinder for each event's LOR. Finally, the attenuated sphere events were merged with the phantom's list-mode data. The inserted spheres had the same average counts in a 10-mm diameter spherical volume of interest (VOI) after 20 iterations of 3D list-mode TOF-OSEM reconstruction as the physical spheres in the phantom (“real” spheres: 12,524 vs. inserted spheres: 12,537). For this study all 20 spheres were considered together.
The numbers of transverse (azimuthal) angular views and oblique tilts used in DIRECT were varied from 80 to 5 and from 7 to 1, respectively, to study the sensitivity of DIRECT to the degree of angular sampling. The ranges of views and tilts were chosen to span the estimated minimum number of angular samples needed, determined in Sec. I. Both quantitative (contrast/noise performance) and visual assessments were performed. The contrast recovery coefficient of each sphere and image noise were determined as described below. To investigate the performance of DIRECT with reduced statistics, the data were also reconstructed with subsets of the counts (38, 19, 9.5, and 4.7 M true events) in addition to the full data set.
C. Non-uniform phantom study
A 35-cm diameter, 30-cm long cylinder with several inserts to mimic clinical imaging distributions was imaged on the LaBr3 TOF-PET scanner. The inserts were added to the phantom to investigate the impact of view-grouping in the presence of sharp transverse or axial changes in the emission and/or attenuation distributions. The non-uniformity of the attenuation distribution was of particular interest because, unlike the emission data that are spatially constrained by the use of TOF information, attenuation effects are spread along the entire LOR and may be blurred by grouping the correction factors into a limited number of views, which is then modeled in DIRECT [17]. Having an insert with a non-uniform attenuation distribution allowed us to test the validity of this model. The inserts included: (1) three 8-mm diameter spheres with a sphere:background activity ratio of 10.4:1 at r = 1, 6, and 12 cm; (2) an 8-cm diameter, 15-cm long “lung” cylinder with an attenuation coefficient of 0.031 cm−1 and a lung:background activity ratio of 0.32:1; and (3) six 5-cm diameter, 1.3-cm thick disks of Delrin, separated axially by 1 cm to mimic a spine. 120 M prompts and 28 M delayed events were acquired; the scatter fraction was 28% for a total of 65 M true events. The timing resolution of the study was 430 ps. The data were reconstructed for a range of angular samples (views and tilts).
The contrast/noise performance of the three hot spheres was determined as described below. For the lung insert, 25 slices were summed, and a 2-voxel wide profile was drawn through the center of the lung. For the spine insert, a 3-cm diameter circular region of interest (ROI) was drawn in the area of the spine on each slice, and the ROI counts were plotted as a function of slice.
D. Patient study
A normal volunteer with a body mass index of 38 was imaged on the LaBr3 TOF-PET scanner two hours following a 555-MBq (15-mCi) injection of [18F]-fluorodeoxyglucose. Four bed positions were acquired from the neck to the pelvis. 124 M prompts and 49 M delays (total for all four bed positions) were acquired. A 137Cs transmission scan was used for attenuation correction [36]. The TOF resolution of the study was 430 ps. In order to perform a contrast/noise analysis on these data, list-mode data for several 10-mm spherical lesions were fused with the whole-body data analogous to the sphere phantom study. The number of sphere counts was chosen to be 8 times the average activity concentration in the whole body. Six spheres were inserted into the lungs, and five were inserted into the liver. The contrast values of the spheres were calculated as described below. The contrast values were averaged over the spheres within each organ.
E. Contrast recovery coefficient calculation
Local contrast recovery coefficient (CRC) values were determined by drawing spherical VOIs on the hot spheres with diameters equal to the physical sphere diameters. For the inserted spheres, the local background was determined from the sphere VOIs drawn on the image without inserted spheres. For the “real” spheres in the phantoms, because there was no comparable study without these spheres the local background was determined by drawing annular background ROIs (inner diameter = 16 mm larger than the sphere diameter, width = 10 mm) around each sphere. We have found that annular background ROIs drawn around the “real” spheres and spherical VOIs drawn on the image without inserted spheres have comparable average values and spreads. The CRC was calculated as
| (5) |
where H is the average value in the sphere VOI, B is the average value in the background region, and a is the true sphere:background activity ratio. Perfect contrast recovery would have a CRC of 1.0.
F. Noise metrics
The metric of image noise used in this work is the image roughness [37] or percent standard deviation (%SD) of pixel values in a large region of uniform uptake. For patient studies, this is a common indicator of image noise because conventional metrics of statistical noise cannot be easily obtained: it is impossible to acquire replicate scans at a given count level, and it is not easy to find sufficiently large areas of uniform uptake to draw 30–60 non-overlapping ROIs for the calculation of the background variability, a surrogate for measuring noise over multiple realizations [37]. Image roughness, however, includes pixel correlations and residual image non-uniformities, so it may not fully describe image noise. Because both list-mode TOF-OSEM and DIRECT-OSEM use the same update, it was not anticipated that pixel correlations would differ significantly between the two approaches, provided that adequate angular sampling was used in DIRECT. To verify this hypothesis and to justify using image roughness as the noise metric in this work, the image roughness was compared to the statistical noise across multiple realizations for the two approaches used. Sixteen realizations of the sphere phantom data were generated at low (12.5 M trues) and high (200 M trues) count levels. Mean and SD images over the 16 replicates were calculated. The image roughness was calculated over four 8-cm diameter circular ROIs drawn on the image without inserted spheres in the same slice as the real spheres and then averaged over the four ROIs. The average statistical noise %SDrep was calculated by averaging the %SD across replicates over the pixels in the same ROIs used in the image roughness calculation. In addition, the local pixel correlation coefficient [38] was calculated over the 16 replicates for a central pixel in an 11×11 pixel box. To improve the precision of the calculation, nine boxes were drawn in the central 5 cm of the image in 10 slices separated by 12 mm to minimize axial correlation effects, and the 90 (10 × 9) correlation arrays were averaged.
III. Results
A. Noise metrics
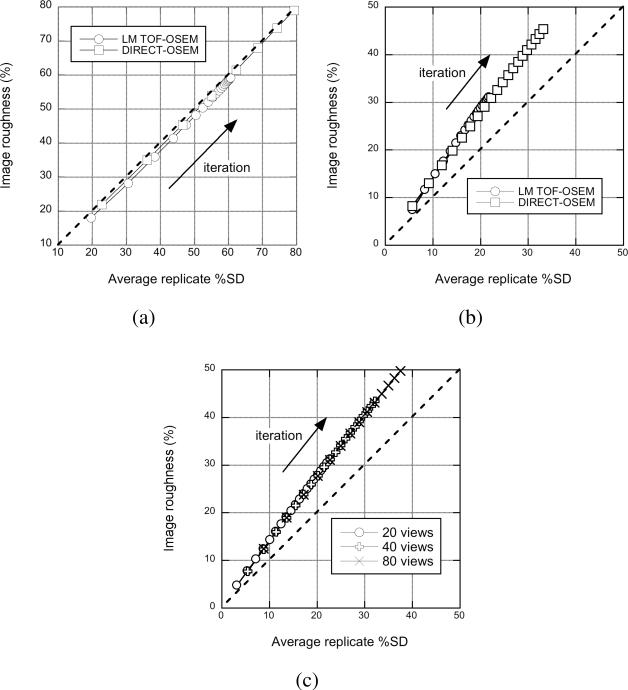
Fig. 3 shows the image roughness vs. %SDrep for list-mode (LM) TOF-OSEM and DIRECT-OSEM for 12.5 M (a) and 200 M (b) true counts for different numbers of iterations. For low count levels, where statistical noise overwhelms pixel correlation effects, the two metrics are very close for both list-mode TOF-OSEM and DIRECT-OSEM. At high count densities where pixel correlation effects and residual image nonuniformity are more evident because the statistical noise is low, the image roughness is no longer equivalent to replicate noise. However, both approaches show the same relative behavior between the noise metrics. Fig. 3 (c) shows that this behavior is unchanged with the number of views used in DIRECT when a sufficient number of views (20 or more) is used.
Fig. 3.
Comparison of image roughness and statistical noise measured using replicate scans in the sphere phantom. Image roughness is plotted as a function of %SDrep for (a) low and (b) high count densities for list-mode TOF-OSEM and DIRECT-OSEM approaches. (c) Image roughness is plotted as a function of %SDrep for DIRECT using different numbers of views for the high-count case.
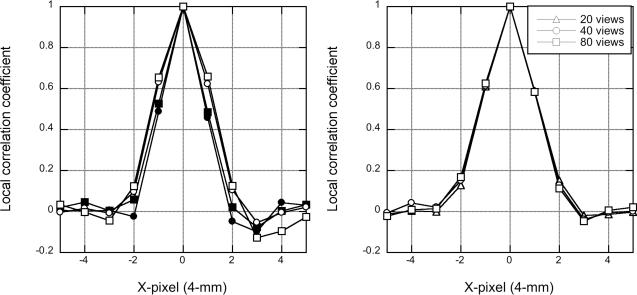
Fig. 4 shows a profile through the local correlation coefficient array for list-mode TOF-OSEM and DIRECT-OSEM with and without detector resolution modeling (left) and for DIRECT-RAMLA with different numbers of views (right). The correlation profiles were calculated at matched image roughness levels (20%). It can be seen that resolution modeling increases the extent of the pixel correlations. However the reconstructions with list-mode TOF-OSEM and DIRECT-OSEM have comparable local correlation profiles for each case (with or without detector resolution modeling). The local correlation is also unaffected by the number of views used in DIRECT.
Fig. 4.
Horizontal profiles through the local correlation coefficient arrays from the sphere phantom study with 200 M true events. (Left) Pixel correlations are shown for list-mode TOF-OSEM (∘) and DIRECT-OSEM (□) without (closed symbols) and with (open symbols) detector resolution modeling. (Right) Pixel correlations are shown for DIRECT using different numbers of views.
Because the two approaches show comparable image roughness vs. statistical noise behavior and similar local correlation profiles, the image roughness metric was used as an indicator of image noise in the remainder of the paper. For the phantom studies, the image roughness was determined as the pixel-to-pixel SD within several large (6–8 cm diameter) circular ROIs drawn in the background and then averaged over the ROIs. Multiple ROIs were used to cover a large portion of the uniform background. In the patient study, the image roughness was measured in 8-cm diameter ROIs drawn on seven slices in the liver, which visually had uniform uptake of activity, and then averaged over the seven slices. In all cases, the image roughness was expressed as a percentage of the mean value in the ROIs.
B. Angular sampling in DIRECT
1) Sphere phantom study
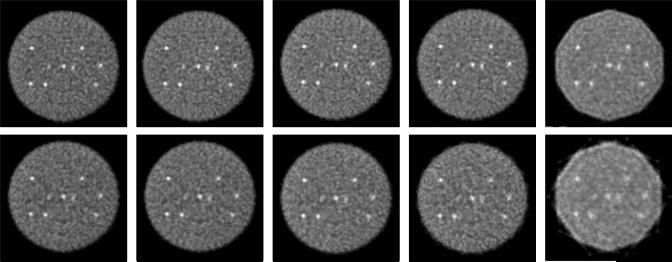
Fig. 5 (top) shows the central transverse slice of the sphere phantom for different numbers of transverse angular (azimuthal) views, ranging from 80 to 5. With the exception of 5 views where sampling artifacts are seen, there is no visible difference between the images as a function of the number of views used. Fig. 5 (bottom) shows the images for the data degraded to 700-ps timing resolution. There are very faint flaring artifacts at the edge of the phantom for 10 views and severe sampling artifacts for 5 views with this timing resolution; the images with 20–80 views appear visually similar.
Fig. 5.
Sphere phantom: Views - Images of the sphere phantom with 76 M true events as a function of the number of transverse angular views used in DIRECT-RANKA. (Top) Images are shown at 20% image roughness for 430-ps timing resolution data for (from left to right) 80, 40, 20, 10, and 5 views. (Bottom) Images are shown for 700-ps (degraded) timing resolution data.
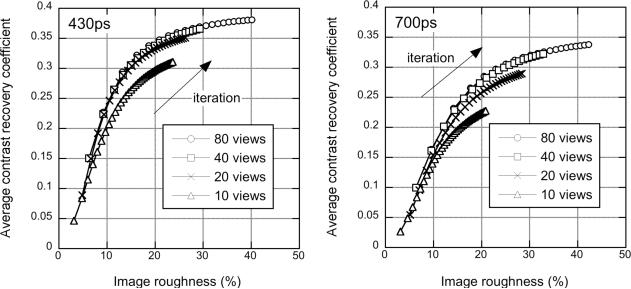
Fig. 6 shows the CRC vs. image roughness plot for the 430-ps data (left) and 700-ps data (right) for 10–80 views. In this and all CRC/image roughness plots with DIRECT, each symbol represents 5-iteration increments. It can be seen that there is a very small loss of contrast at fixed image roughness when 20 views are used with the 430-ps data and noticeably worse behavior with 10 views. For the 700-ps data, the loss of contrast with 10 and 20 views is greater. These findings are consistent with the estimated minimum number of transverse views discussed in Sec. I (17 and 28 for 430- and 700-ps timing resolutions, respectively). As has been observed with list-mode TOF-OSEM [32], contrast at a fixed level of image roughness improves somewhat with better timing resolution.
Fig. 6.
Sphere phantom: Views - CRC vs. image roughness performance for the sphere phantom study with 76 M true events as a function of number of transverse angular views used in DIRECT. The average CRC for the 20 spheres is plotted for the data with 430-ps timing resolution (left) and 700-ps (degraded) timing resolution (right) as a function of image roughness for 80 views: ∘, 40 views: □, 20 views: ×, and 10 views: △. The curves were generated for increasing numbers of iterations.
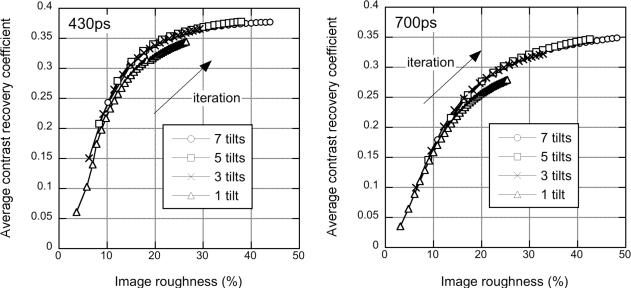
Fig. 7 (top) shows the central coronal slice of the sphere phantom with 430-ps timing resolution for different numbers of tilt (co-polar) angles, ranging from 7 to 1. Fig. 7 (bottom) shows the results for the data blurred to 700-ps timing resolution. There is no visible difference between the images for a given timing resolution as a function of number of tilts used. Fig. 8 (left) shows the CRC vs. image roughness for the 430-ps data for 1–7 tilts; Fig. 8 (right) shows the results for the 700-ps data. It can be seen that there is a small loss of contrast when only 1 tilt angle is used. These results agree reasonably well with the theoretical minimum number of tilt angles discussed in Sec. I (2 and 3 for 430-ps and 700-ps timing resolutions, respectively).
Fig. 7.
Sphere phantom: Tilts - Images of the sphere phantom as a function of the number of oblique tilt angles used in DIRECT-RAMLA. (Top) Images are shown at 20% image roughness for the 430-ps timing resolution data for (from left to right) 7, 5, 3, and 1 tilt angles. (Bottom) Images are shown for the 700-ps (degraded) timing resolution data.
Fig. 8.
Sphere phantom: Tilts - CRC vs. image roughness performance from the sphere phantom study as a function of the number of oblique tilt angles used in DIRECT. The average CRC for the 20 spheres is plotted for the data with 430-ps timing resolution (left) and 700-ps (degraded) timing resolution (right) as a function of image roughness for 7 tilts: ∘, 5 tilts: □, 3 tilts: ×, and 1 tilt: △.
2) Non-uniform phantom study
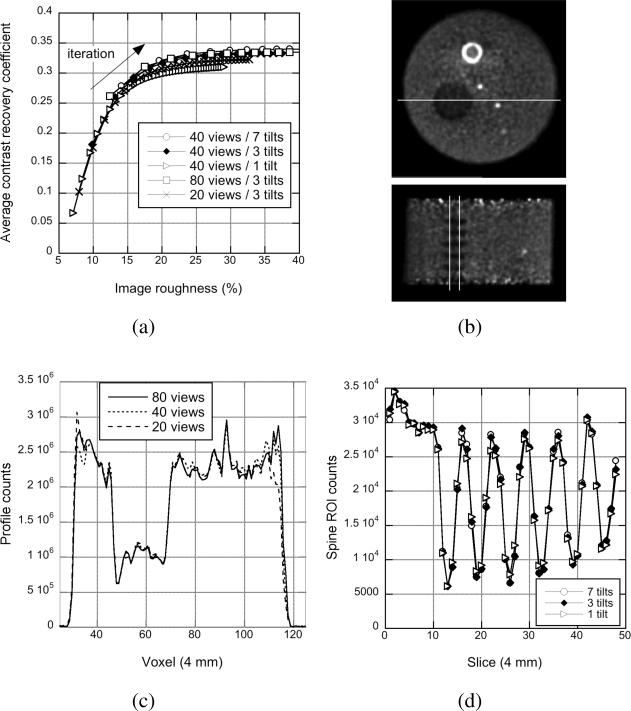
Fig. 9(a) shows the CRC vs. image roughness for the hot spheres in the non-uniform phantom for different numbers of transverse views and tilt angles. As was seen in the sphere phantom study, similar CRC vs. image roughness performance is observed in all cases except when an insufficient number of transverse views (20 views) or oblique tilts (1 tilt) is used, where a small loss of contrast can be seen.
Fig. 9.
Non-uniform phantom: Angular sampling - (a) Average CRC vs. image roughness performance for the three 8-mm diameter hot spheres in the non-uniform phantom shown in (b) for DIRECT with different numbers of transverse views and oblique tilts. (c) Transverse profiles through the lung insert are shown for images with 20% image roughness for DIRECT with 3 tilt angles and 20, 40, and 80 transverse views. (d) Axial profiles through the spine insert are shown for DIRECT with 40 transverse views and 1, 3, and 7 tilt angles.
Fig. 9(c) shows horizontal profiles through the lung insert (seen in Fig. 9(b)-top) for 3 tilts and 20, 40, and 80 views. Even when only 20 views are used in DIRECT, the profiles inside the phantom are similar within noise variations, although some differences are seen at the edges of the phantom. These results demonstrate that view-grouping does not result in measurable inaccuracies in the attenuation correction that translate into the emission image.
Fig. 9(d) shows the ROI counts in the spine insert (seen in Fig. 9(b)-bottom) as a function of axial location for 40 views and 1, 3, and 7 tilt angles. These results demonstrate that grouping TOF data into a limited number of tilt angles does not result in a measurable loss of contrast even in the case of sharp axial variations.
C. Impact of count statistics in DIRECT
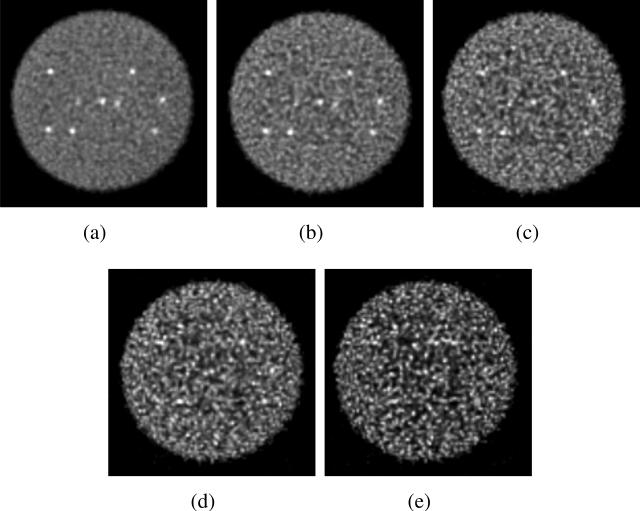
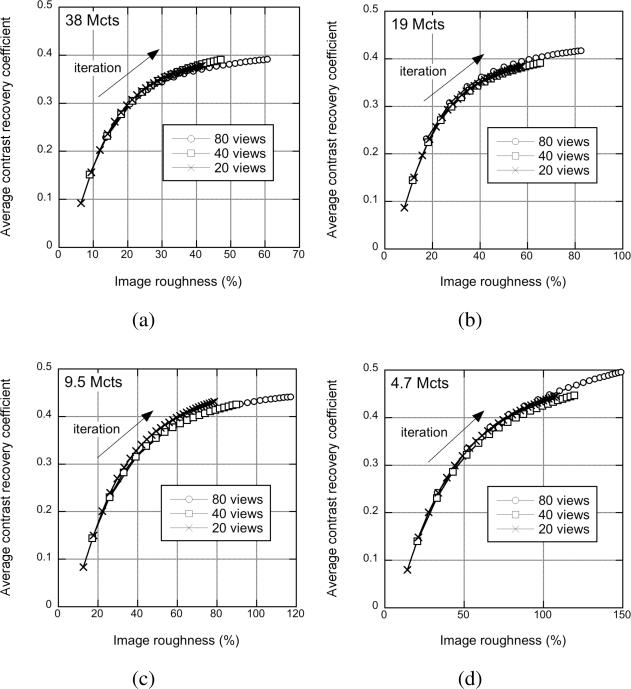
Fig. 10 shows transverse slices through the central slice of the sphere phantom for different numbers of true events, from 76 M to 4.7 M. Fig. 11 shows the average CRC as a function of image roughness for the different numbers of events reconstructed for 80, 40, and 20 transverse angular views. As expected with statistical reconstruction algorithms such as RAMLA and OSEM, the image roughness increases with fewer events. As has also been observed for list-mode TOF-OSEM reconstructions [39], while visual lesion detectability decreases with fewer counts, the contrast achieved with the DIRECT approach is relatively unaffected by the count level; however, there is a trend towards an increase in CRC as the count density decreases, which reflects the bias resulting from the non-negativity constraint of ML algorithms [40]. The CRC calculation used the actual sphere locations known from high-statistics images; this allowed reasonable CRC values to be measured even though the spheres are barely visible in the low-count images. However, for a given level of image roughness, higher CRC values are achieved with better statistics. In addition, the behavior of DIRECT for different count levels does not change with the number of angular views; the results for 20 and 80 transverse views are the same as for 40 views to within the measurement uncertainty. Thus, the performance of DIRECT is robust when fewer events are reconstructed even with a large number of views, despite the sparseness of the individual histo-images.
Fig. 10.
Sphere phantom: Statistics - Central transverse images of the sphere phantom with 430-ps TOF resolution for (a) 76 M, (b) 38 M, (c) 19 M, (d) 9.5 M, and (e) 4.7 M true events. The images are shown for 40 angular views and 3 tilts after 40 iterations with DIRECT-RAMLA.
Fig. 11.
Sphere phantom: Statistics - CRC vs. image roughness performance for the sphere phantom study with 430-ps TOF resolution for different numbers of true events reconstructed: (a) 38 M, (b) 19 M, (c) 9.5 M, and (d) 4.7 M true events with DIRECT-RAMLA. Each curve was generated for a single count density for increasing numbers of iterations. Results are shown for 3 tilt angles and 80, 40, and 20 views.
D. Comparison of DIRECT-OSEM and list-mode TOF-OSEM
The DIRECT approach was shown with simulated data to yield comparable images in significantly less reconstruction time than list-mode TOF-OSEM [17]. It was of interest to determine if the two approaches led to similar images with measured data. Images were compared for the two phantom studies as well as for the patient data.
1) Hot sphere phantom
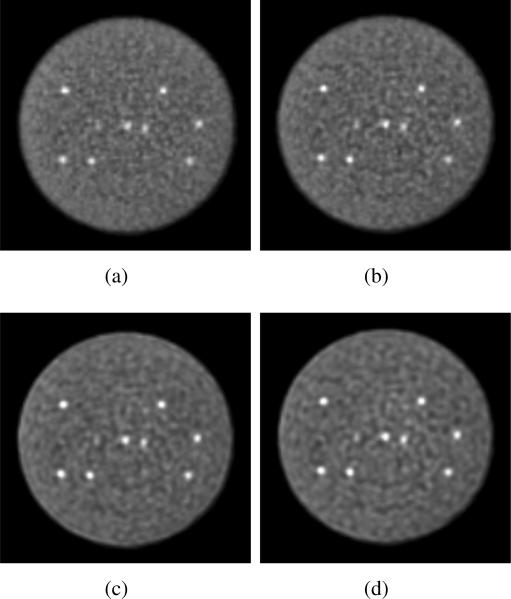
Fig. 12 shows the central transverse slice of the sphere phantom study with full counts reconstructed with (a) list-mode TOF-OSEM and (b) DIRECT-OSEM. Figs. 12 (c) and (d) show images with a spatially invariant detector resolution model for list-mode TOF-OSEM and DIRECT-OSEM, respectively. Visually, the images in Fig. 12 (a)–(b) appear similar with small differences in the noise texture although the pixel correlations were found to be similar - see Fig. 4. The images with detector resolution modeling (c and d) are also comparable for the list-mode TOF-OSEM and DIRECT-OSEM approaches and have increased contrast compared with those without detector resolution modeling.
Fig. 12.
Sphere phantom: Approaches - Transverse images from the sphere phantom study with 430-ps TOF resolution for different reconstruction approaches: (a) list-mode TOF-OSEM, (b) DIRECT-OSEM, (c) list-mode TOFOSEM with spatially invariant detector resolution model, and (d) DIRECT-OSEM and spatially invariant detector resolution model. All images are shown at 15% image roughness.
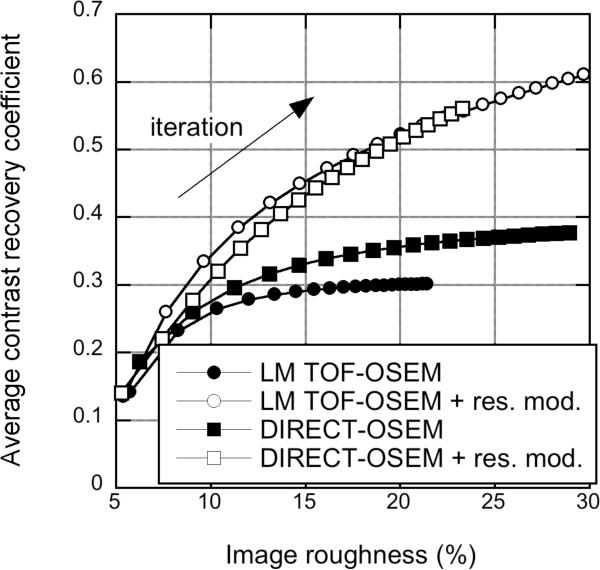
Fig. 13 shows the CRC vs. image roughness for the sphere phantom with DIRECT- OSEM and list-mode TOF-OSEM with and without detector resolution modeling. For this and all similar comparison plots, each symbol for list-mode TOF-OSEM represents 1 iteration (25 temporal subsets), while each symbol for DIRECT-OSEM represents 5 iterations (5 subsets). It can be observed that in the reconstructions without detector resolution modeling the contrast is higher with DIRECT-OSEM than that seen with list-mode TOF-OSEM. We postulate that this is due to the fact that in DIRECT it is difficult to reconstruct without any LOR resolution modeling (a 4.0-mm LOR kernel was used in these reconstructions to model the width of the LORs), whereas in the implementation of list-mode TOF-OSEM, this is not the case. Both reconstruction approaches with similar (approximate) detector resolution models show comparable performance (and higher CRC at a given level of image roughness than without detector resolution modeling).
Fig. 13.
Sphere phantom: Approaches - CRC vs. image roughness plots for the sphere phantom study with 430-ps TOF resolution for different reconstruction approaches. Results are shown for list-mode (LM) TOF-OSEM (circles) and DIRECT-OSEM (squares). Results are also shown with a spatially invariant detector resolution model (open symbols).
2) Non-uniform phantom study
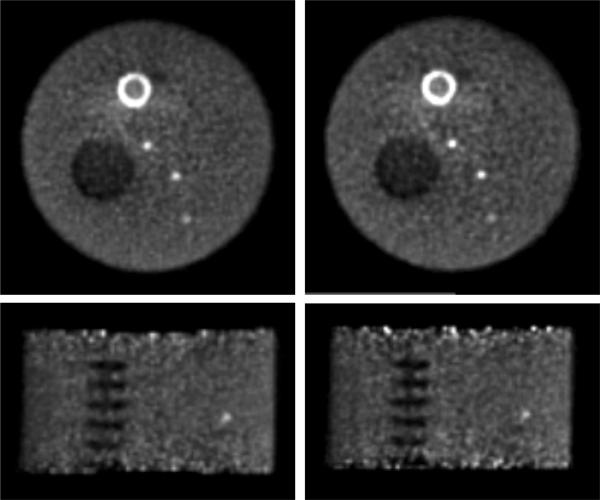
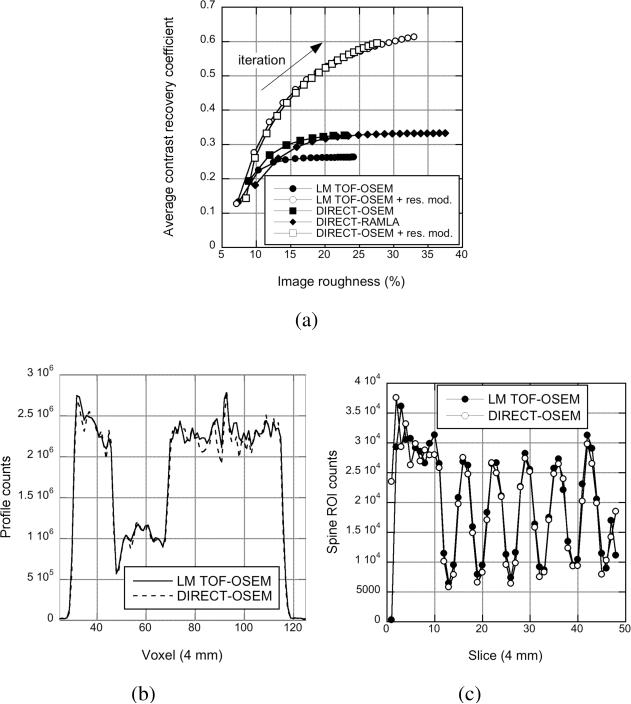
Fig. 14 shows transverse and coronal slices through the hot spheres in images of the non-uniform phantom for list-mode TOF-OSEM (left) and DIRECT-OSEM (right). The images appear similar for the two approaches with only very subtle differences in noise texture. Fig. 15(a) shows the CRC vs. image roughness for the hot spheres with and without detector resolution modeling for DIRECT with the OSEM and RAMLA algorithms and list-mode TOF-OSEM. As was seen for the sphere phantom, the CRC at a given level of image roughness is higher with DIRECT-OSEM than with list-mode TOF-OSEM due to the small amount of LOR resolution modeling inherent in DIRECT. The results for DIRECT with the OSEM and RAMLA updates are very similar. When similar detector resolution modeling is used, DIRECT-OSEM and list-mode TOF-OSEM have almost identical performance.
Fig. 14.
Non-uniform phantom - Transverse (top) and coronal (bottom) images of the non-uniform phantom. Images from reconstructions with (left) list-mode TOF-OSEM and (right) DIRECT-OSEM are shown at 20% image roughness. The hot annular structure near the top of the image is a myocardial insert that was not analyzed in this study. The non-uniform background near this insert is most likely due to inaccuracies in the scatter correction. The calculation of image roughness did not include this non-uniform area.
Fig. 15.
Non-uniform phantom: Approaches - (a) Average CRC vs. image roughness performance for the three 8-mm diameter hot spheres in the nonuniform phantom study. Results are shown for DIRECT with the OSEM and RAMLA updates and list-mode TOF-OSEM, with and without detector resolution modeling. (b) Transverse profiles through the lung insert and (c) axial profiles through the spine insert are shown for images with 20% image roughness without detector resolution modeling for DIRECT-OSEM with 40 transverse views and 3 tilt angles and for list-mode TOF-OSEM.
Fig. 15(b) shows a horizontal profile through the lung insert for DIRECT-OSEM (40 transverse views and 3 oblique tilts) and list-mode TOF-OSEM at fixed image roughness. No difference is observed in the region of the lung between the DIRECT and list-mode approaches.
Fig. 15(c) shows the ROI counts in the spine insert as a function of axial location for DIRECT-OSEM (40 transverse views and 3 tilts) and list-mode TOF-OSEM. No difference is observed in the profiles for DIRECT and list-mode TOF-OSEM.
3) Patient study
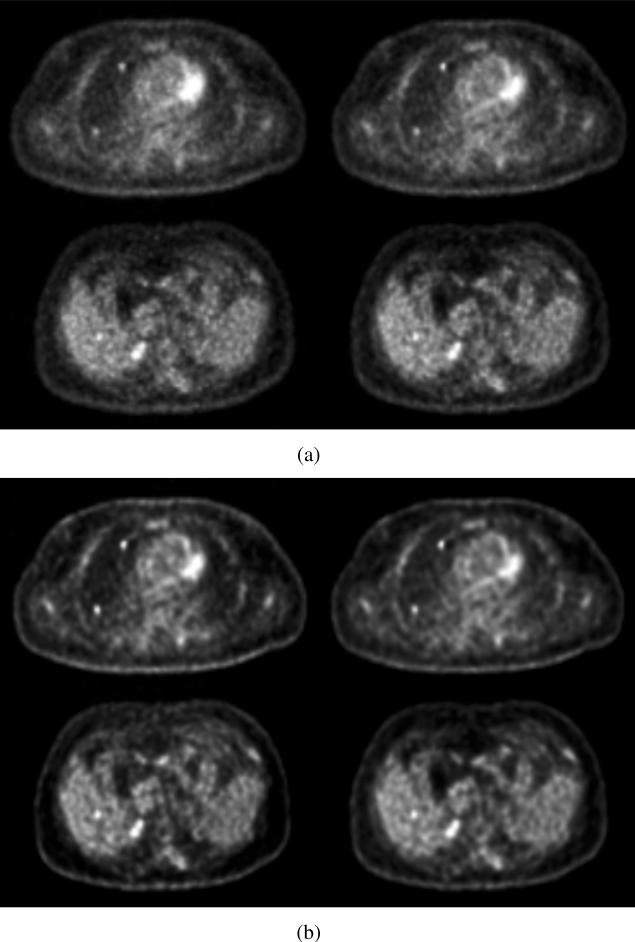
Fig. 16 shows two transverse slices through inserted lung and liver lesions from the patient study reconstructed with list-mode TOF-OSEM (left) and DIRECT-OSEM (right). Images without detector resolution modeling are shown in Fig. 16(a), while those with detector resolution modeling are shown in Fig. 16(b). While there are clear differences in both contrast and noise texture between the images reconstructed with and without detector resolution modeling, there is little visual difference in image quality between the list-mode TOF-OSEM and DIRECT-OSEM approaches.
Fig. 16.
Patient study - Selected transverse slices through lung (top) and liver (bottom) spheres in the patient images. (Left) List-mode TOF-OSEM reconstruction. (Right) DIRECT-OSEM. Images are shown without (a) and with (b) detector resolution modeling. All images are shown at 20% image roughness in the liver. Two lung and one liver spheres are shown.
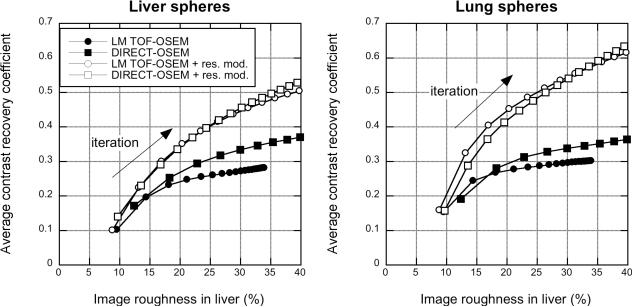
Fig. 17 shows the CRC vs. image roughness performance averaged over the spheres in the liver and lung. Both approaches have similar convergence behavior. As was seen with the phantom studies, without detector resolution modeling the CRC at a given image roughness is higher with DIRECT-OSEM than with list-mode TOF-OSEM. With a spatially invariant detector resolution model, the performance of the two approaches is very similar. The lung also has somewhat higher CRC than the liver.
Fig. 17.
Patient study - CRC vs. image roughness plots for the patient study for different reconstruction approaches. Results are shown for CRC averaged over the five liver spheres (left) and six lung spheres (right) for list-mode list-mode TOF-OSEM and DIRECT-OSEM.
E. Run time comparison of DIRECT and list-mode TOF-OSEM
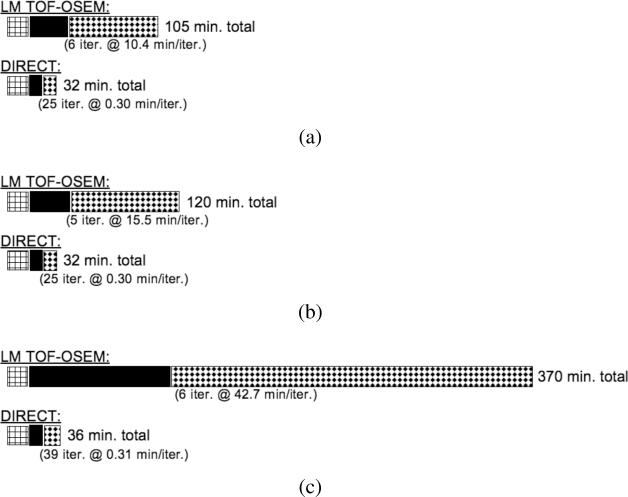
Fig. 18 shows schematically the difference in total reconstruction times for a single CPU on a Dell Precision T5500 between list-mode TOF-OSEM and DIRECT-RAMLA for all steps of the reconstruction process using the sphere phantom data. One iteration of DIRECT reconstruction takes 18 s with the RAMLA update and 12 s with the OSEM (5 subsets) algorithm, as compared to 10–43 min per iteration with list-mode TOF-OSEM. More iterations are required with the OSEM update in DIRECT than with the RAMLA update to achieve matched performance, so the reconstruction time for a given level of performance is similar for the two updates (9.0 min with 45 iterations of OSEM, compared with 7.5 min with 25 iterations of RAMLA to achieve 15% image roughness). For a fair comparison of the approaches, however, the entire processing sequence for a comparable image quality was considered, as reported in Fig. 18. Preprocessing steps include calculation of the randoms and scatter estimates (both approaches) and list annotation (list-mode TOF-OSEM) or deposition of the list data into 120 (40 transverse views × 3 tilt angles) histo-images (DIRECT). The sensitivity matrix calculations are comparable for the two approaches and include calculation of attenuation effects, detector efficiency normalization, and gap compensation. The time for DIRECT for this step is faster than that for list-mode TOF-OSEM due to the Fourier-based methods used in DIRECT. Results are shown for (a) 430-ps and (b) 700-ps timing resolutions, and (c) 430-ps timing resolution with a spatially invariant (7.9-mm Gaussian) detector resolution model. It can be observed that the total processing and reconstruction time is roughly constant with DIRECT, regardless of the sizes of the TOF and LOR resolution kernels, while the times for list-mode TOF-OSEM depend strongly on these kernel sizes. The reconstruction time per iteration for DIRECT is also independent of the number of events, while the per-iteration time for list-mode TOF-OSEM is almost linear with the number of counts being reconstructed (e.g., 5.1 min/iteration for 38 M true events, compared with 10.4 min/iteration for 76 M true events).
Fig. 18.
Schematics showing the times for all steps of image reconstruction for list-mode TOF-OSEM (25 subsets) and DIRECT-RAMLA. The data were from the hot sphere phantom study with 164 M prompts (76 M trues). The preprocessing steps (leftmost hatched boxes) include calculations of randoms and scatter estimates; the time to calculate the sensitivity matrix is shown by the solid black boxes. The reconstruction times (rightmost dotted boxes) are for images with 15% image roughness. All times are shown for a single CPU on a Dell Precision T5500 (2.8 GHz with 12 Gb RAM). Total reconstruction times are shown for data with (a) 430-ps timing resolution, (b) 700-ps timing resolution, and (c) 430-ps timing resolution data with a spatially invariant detector resolution model.
IV. Discussion
The reduced angular sampling requirements for TOF-PET data and the histo-image format for data and corrections combine in DIRECT to produce a fast, efficient reconstruction approach for 3D TOF-PET data. With sufficient angular sampling, the visual image quality and quantitative performance metrics with DIRECT are comparable to those obtained with the more computationally expensive 3D list-mode TOF-OSEM approach even in phantom and patient studies with non-uniform emission and attenuation distributions. There is also no dependence of CRC (or visible blurring of structures) on the radial or axial locations of the objects. Unlike a rebinning algorithm such as single-slice rebinning [41], for example, which shows marked blurring for off-center objects, the angular grouping of TOF data does not lead to a loss of resolution [19], provided that a sufficient number of angular samples, consistent with the timing resolution, is used. These results agree well with the prior validation of the performance of DIRECT using simulated, trues-only data [17] and indicate that all corrections for physical effects in measured data can be accurately included in the view-grouped, histo-image format.
The visual image quality and quantitative performance of DIRECT degrade somewhat when the angular sampling is too coarse for the timing resolution of the data. The TOF kernel is modeled in DIRECT as a single one-directional function at the average angle of the view-group, and the forward- and back-projection steps do not take into account the fan nature of the LORs contributing to a given view-group. When too few angular samples (view-groups) are used, this approximation breaks down (e.g., for 5 views in Fig. 5). More accurate modeling would involve a TOF kernel averaged over the range of directions represented in the individual view. However, the performance of DIRECT has been shown to be insensitive to the number of angular samples above the minimum number appropriate for the timing resolution because the data become over-sampled. There is no apparent benefit to using more angular samples (e.g., 80 transverse views or 7 tilt angles). Because using more view-groups requires more memory and disk space, we chose 40 transverse views and 3 oblique tilts as our default for the timing resolutions currently available.
The reconstruction time with DIRECT is independent of the sizes of the TOF and LOR resolution kernels as well as the number of events reconstructed. In addition, DIRECT was seen to be robust for low count situations. This will permit DIRECT to be applied to gated or dynamic studies where a fast approach is needed to reconstruct multiple, low-count frames of data. For clinical reconstructions with list-mode TOF-OSEM, multiple computers are used to speed the reconstruction time. For reconstruction of multi-frame studies in clinically reasonable times, faster reconstruction even with the DIRECT approach will be important, and this can be easily achieved with multi-threading and code optimization, as well as the use of multiple CPUs.
Spatially invariant detector resolution modeling has been efficiently incorporated into DIRECT, with results comparable to those obtained when a similar resolution model is included in list-mode TOF-OSEM reconstruction, but without the significant increase in reconstruction time. A spatially varying detector resolution model can be used in the list-mode TOF-OSEM algorithm although the reconstruction time penalty is even larger than that shown in Fig. 18, especially as wider resolution kernels are used at larger radial distances to model depth-of-interaction effects. Because a spatially varying detector resolution model within the DIRECT approach involves the loss of efficiencies seen by operating in Fourier space, a spatially varying resolution model has been implemented in DIRECT using GPUs in histo-image space [20]. Based on studies of the accuracy of the resolution model needed with list-mode TOF-OSEM [42], we do not expect a spatially varying resolution model to have a big effect in DIRECT. Work is currently in progress to ascertain the level of accuracy needed for the detector resolution model in DIRECT and to develop methods that mitigate the loss of efficiency when operating in histo-image space instead of Fourier space.
V. Conclusions
The DIRECT reconstruction approach has a favorable image quality vs. reconstruction time trade-off for measured 3D TOF-PET data. It has been seen to have comparable performance to a list-mode iterative TOF-PET algorithm but with reduced computation time. Future work includes making steps of DIRECT multi-threaded for even faster reconstruction and investigating methods of incorporating more accurate spatial resolution kernels.
Acknowledgment
The authors are grateful to A. E. Perkins of Philips Research and R. Kulp of the University of Pennsylvania for help with the phantom and patient studies and to the associate editor and anonymous reviewers for their helpful comments.
This work was supported in part by NIH grants R01-CA-113941 and R01-EB-002131.
References
- [1].Karp JS, Surti S, Daube-Witherspoon ME, Muehllehner G. Benefit of time-of-flight in PET: Experimental and clinical results. J. Nucl. Med. 2008;49:462–470. doi: 10.2967/jnumed.107.044834. [DOI] [PMC free article] [PubMed] [Google Scholar]
- [2].Kadrmas DJ, Casey ME, Conti M, Jakoby BW, Lois C, Townsend DW. Impact of time-of-flight on PET tumor detection. J. Nucl. Med. 2009;50:1315–1323. doi: 10.2967/jnumed.109.063016. [DOI] [PMC free article] [PubMed] [Google Scholar]
- [3].Lois C, Jakoby BW, Long MJ, Hubner KF, Barker DW, Casey ME, et al. An assessment of the impact of incorporating time-of-flight information into clinical PET/CT imaging. J. Nucl. Med. 2010;51:237–245. doi: 10.2967/jnumed.109.068098. [DOI] [PMC free article] [PubMed] [Google Scholar]
- [4].Snyder DL, Thomas LJ, Jr., Ter-Pogossian MM. A mathematical model for positron-emission tomography systems having time-of-flight measurements. IEEE Trans. Nucl. Sci. 1981;NS-28:3575–3583. [Google Scholar]
- [5].Philippe EA, Mullani NA, Wong W-H, Hartz R. Real-time image reconstruction for time-of-flight positron emission tomography (TOFPET) IEEE Trans. Nucl. Sci. 1982;NS-29:524–528. [Google Scholar]
- [6].Snyder DL, Thomas LJ, Ter-Pogossian MM. A mathematical model for positron-emission tomography systems having time-of-flight measurements. IEEE Trans. Nucl. Sci. 1981;NS-28:3575–3583. [Google Scholar]
- [7].Watson CC. An evaluation of image noise variance for time-of-flight PET. IEEE Trans. Nucl. Sci. 2007;54:1636–1647. [Google Scholar]
- [8].Defrise M, Casey ME, Michel C, Conti M. Fourier rebinning of time-of-flight PET data. Phys. Med. Biol. 2005;50:2749–2763. doi: 10.1088/0031-9155/50/12/002. [DOI] [PubMed] [Google Scholar]
- [9].Defrise M, Panin V, Michel C, Casey ME. Discrete axial rebinning for time-of-flight PET. Conference Record of the 2006 IEEE Nuclear Science Symposium and Medical Imaging Conference; San Diego, CA. 31 October - 4 November 2006.pp. M10–2. [Google Scholar]
- [10].Cho S, Ahn S, Li Q, Leahy RM. Analytical properties of time-of-flight PET data. Phys. Med. Biol. 2008;53:2809–2821. doi: 10.1088/0031-9155/53/11/004. [DOI] [PMC free article] [PubMed] [Google Scholar]
- [11].Cho S, Ahn S, Li Q, Leahy RM. Exact and approximate Fourier rebinning of PET data from time-of-flight to non time-of-flight. Phys. Med. Biol. 2009;54:467–484. doi: 10.1088/0031-9155/54/3/001. [DOI] [PMC free article] [PubMed] [Google Scholar]
- [12].Hudson HM, Larkin RS. Accelerated image reconstruction using ordered subsets of projection data. IEEE Trans. Med. Imaging. 1994;13:601–609. doi: 10.1109/42.363108. [DOI] [PubMed] [Google Scholar]
- [13].Reader AJ, Manavaki R, Zhao S, Julyan PJ, Hastings DL, Zweit J. Accelerated list-mode EM algorithm. IEEE Trans. Nucl. Sci. 2002;49:42–49. [Google Scholar]
- [14].Popescu LM, Matej S, Lewitt RM. Iterative image reconstruction using geometrically ordered subsets with list-mode data. Conference Record of the 2004 IEEE Nuclear Science Symposium and Medical Imaging Conference; Rome, Italy. 20–22 October 2004.pp. M09–211. [Google Scholar]
- [15].Groiselle CJ, Glick SJ. 3D PET list-mode iterative reconstruction using time-of-flight information. Conference Record of the 2004 IEEE Nuclear Science Symposium and Medical Imaging Conference; Rome, Italy. 20–22 October 2004.pp. M02–305. [Google Scholar]
- [16].Wang W, Hu Z, Gualtieri EE, Parma MJ, Walsh ES, Sebok D, et al. Systematic and distributed time-of-flight list mode PET reconstruction. Conference Record of the 2006 IEEE Nuclear Science Symposium and Medical Imaging Conference; San Diego, CA. 29 October - 4 November 2006.pp. M04–2. [Google Scholar]
- [17].Matej S, Surti S, Jayanthi S, Daube-Witherspoon ME, Lewitt RM, Karp JS. Efficient 3-D TOF PET reconstruction using view-grouped histo-images: DIRECT–Direct image reconstruction for TOF. IEEE Trans. Med. Imaging. 2009;28:739–751. doi: 10.1109/TMI.2008.2012034. [DOI] [PMC free article] [PubMed] [Google Scholar]
- [18].Politte DG, Hoffman GR, Beecher DE, Ficke DC, Holmes TJ, Ter-Pogossian MM. Image-reconstruction of data from Super PETT I: A first-generation time-of-flight positron-emission tomograph (reconstruction from reduced-angle data) IEEE Trans. Nucl. Sci. 1986;33:428–454. [Google Scholar]
- [19].Vandenberghe S, Daube-Witherspoon ME, Lewitt RM, Karp JS. Fast reconstruction of 3D time-of-flight PET data by axial rebinning and transverse mashing. Phys. Med. Biol. 2006;51:1603–1621. doi: 10.1088/0031-9155/51/6/017. [DOI] [PubMed] [Google Scholar]
- [20].Ha S, Matej S, Mueller K. Efficiently GPU-accelerating long kernel convolutions in 3-D DIRECT TOF PET reconstructions via memory cache optimization. Proceedings of the 11th International Meeting on Fully Three-Dimensional Image Reconstruction in Radiology and Nuclear Medicine and the 3rd workshop on High Performance Image Reconstruction; Potsdam, Germany. 11–15 July 2011.pp. 31–34. [Google Scholar]
- [21].Karp JS, Kuhn A, Perkins AE, Surti S, Werner ME, Daube-Witherspoon ME, et al. Characterization of a time-of-flight PET scanner based on lanthanum bromide. Conference Record of the 2005 IEEE Nuclear Science Symposium and Medical Imaging Conference; San Juan, Puerto Rico. 23 – 29 October 2005.pp. M04–8. [Google Scholar]
- [22].Matej S, Fessler JA, Kazantsev IG. Iterative tomographic image reconstruction using Fourier-based forward and back-projectors. IEEE Trans. Med. Imaging. 2004;23:401–412. doi: 10.1109/TMI.2004.824233. [DOI] [PubMed] [Google Scholar]
- [23].Matej S, Kazantsev IG. Fourier-based reconstruction for fully 3-D PET: Optimization of interpolation parameters. IEEE Trans. Med. Imaging. 2006;25:845–854. doi: 10.1109/tmi.2006.873219. [DOI] [PubMed] [Google Scholar]
- [24].Watson CC. Extension of single scatter simulation to scatter correction of time-of-flight PET. IEEE Trans. Nucl. Sci. 2007;54:1679–1686. [Google Scholar]
- [25].Werner ME, Surti S, Karp JS. Implementation and evaluation of a 3D PET single scatter simulation with TOF modeling. Conference Record of the 2006 IEEE Nuclear Science Symposium and Medical Imaging Conference; San Diego, CA. 31 October – 4 November 2006.pp. M05–3. [Google Scholar]
- [26].Matej S, Browne JA. Performance of a fast maximum likelihood algorithm for fully 3-D PET reconstruction. In: Grangeat P, Amans J-L, editors. 3D Image Reconstruction in Radiology and Nuclear Medicine. Kluwer Academic Publishers; Dordrecht, The Netherlands: 1996. pp. 297–316. [Google Scholar]
- [27].Kohler T. A projection access scheme for iterative reconstruction based on the golden section. Conference Record of the 2004 IEEE Nuclear Science Symposium and Medical Imaging Conference; Rome, Italy. 20–22 October 2004.pp. M10–200. [Google Scholar]
- [28].Casey ME, Hoffman EJ. Quantitation in positron emission computed tomography: 7. A technique to reduce noise in accidental coincidence measurements and coincidence efficiency calibration. J. Comput. Assist. Tomogr. 1986;10:845–850. [PubMed] [Google Scholar]
- [29].Lewitt RM. Multidimensional digital image representations using generalized Kaiser-Bessel window functions. J. Opt. Soc. Am. A. 1990;7:1834–1846. doi: 10.1364/josaa.7.001834. [DOI] [PubMed] [Google Scholar]
- [30].Matej S, Lewitt RM. Efficient 3D grids for image reconstruction using spherically-symmetric volume elements. IEEE Trans. Nucl. Sci. 1995;42:1361–1370. doi: 10.1109/42.481442. [DOI] [PubMed] [Google Scholar]
- [31].Matej S, Lewitt RM. Practical considerations for 3-D image reconstruction using spherically symmetric volume elements. IEEE Trans. Med. Imaging. 1996;15:68–78. doi: 10.1109/42.481442. [DOI] [PubMed] [Google Scholar]
- [32].Daube-Witherspoon ME, Surti S, Perkins A, Kyba CCM, Wiener R, Werner ME, et al. The imaging performance of a LaBr3-based PET scanner. Phys. Med. Biol. 2010;55:45–64. doi: 10.1088/0031-9155/55/1/004. [DOI] [PMC free article] [PubMed] [Google Scholar]
- [33].Surti S, Kuhn A, Werner ME, Perkins AE, Kolthammer J, Karp JS. Performance of Philips Gemini TF PET/CT scanner with special consideration for its time-of-flight imaging capabilities. J. Nucl. Med. 2007;48:471–480. [PubMed] [Google Scholar]
- [34].El Fakhri G, Surti S, Trott C, Scheuermann J, Karp JS. Improvement in lesion detection with whole-body oncologic time-of-flight PET. J. Nucl. Med. 2011;52:347–353. doi: 10.2967/jnumed.110.080382. [DOI] [PMC free article] [PubMed] [Google Scholar]
- [35].Surti S, Scheuermann J, El Fakhri G, Daube-Witherspoon ME, Lim R, Abi-Hatem N, et al. Impact of TOF on whole-body oncologic studies: a human observer detection and localization study. J. Nucl. Med. 2011;52:712–719. doi: 10.2967/jnumed.110.086678. [DOI] [PMC free article] [PubMed] [Google Scholar]
- [36].Karp JS, Muehllehner G, Qu H, Yan X-H. Singles transmission in volume-imaging PET with a 137Cs source. Phys. Med. Biol. 1995;40:929–944. doi: 10.1088/0031-9155/40/5/014. [DOI] [PubMed] [Google Scholar]
- [37].Tong S, Alessio AM, Kinahan PE. Noise and signal properties in PSF-based fully 3D PET image reconstruction: an experimental evaluation. Phys. Med. Biol. 2010;55:1453–1473. doi: 10.1088/0031-9155/55/5/013. [DOI] [PMC free article] [PubMed] [Google Scholar]
- [38].Alessio AM, Stearns CW, Tong S, Ross SG, Kohlmyer S, Ganin A, Kinahan PE. Application and evaluation of a measured spatially variant system model for PET image reconstruction. IEEE Trans. Med. Imaging. 2010;29:938–949. doi: 10.1109/TMI.2010.2040188. [DOI] [PMC free article] [PubMed] [Google Scholar]
- [39].Surti S, Karp JS. Experimental evaluation of a simple lesion detection task with time-of-flight PET. Phys. Med. Biol. 2009;54:373–384. doi: 10.1088/0031-9155/54/2/013. [DOI] [PMC free article] [PubMed] [Google Scholar]
- [40].Stute S, Nuyts J, Van Slambrouck K, Sibomana M, van Velden F, Boellaard R, Comtat C. Image properties of various ML-based reconstructions of very noisy HRRT data. Conference Record of the 2011 IEEE Nuclear Science Symposium and Medical Imaging Conference; Valencia, Spain. 23 – 29 October 2011.pp. MIC21.S–273. [Google Scholar]
- [41].Daube-Witherspoon ME, Muehllehner G. Treatment of axial data in three-dimensional positron emission tomography. J. Nucl. Med. 1987;28:1717–1724. [PubMed] [Google Scholar]
- [42].Daube-Witherspoon ME, Matej S, Werner ME, Surti S, Karp JS. Impact of resolution modeling on accuracy and precision of lesion contrast measurements. Conference Record of the 2011 IEEE Nuclear Science Symposium and Medical Imaging Conference; Valencia, Spain. 23 - 29 October 2011.pp. MIC21.S–318. [Google Scholar]


