Abstract
This work describes our first efforts to implement SWIFT (SWeep Imaging with Fourier Transformation) in continuous mode for imaging and spectroscopy. We connected a standard quadrature hybrid with a quad coil and acquired NMR signal during continuous radiofrequency excitation. We utilized a chirped radiofrequency pulse to minimize the instantaneous radiofrequency field during excitation of the spin system for the target flip angle and bandwidth. Due to the complete absence of “dead time”, continuous SWIFT has the potential to extend applications of MRI and spectroscopy in studies of spin systems having extremely fast relaxation or broad chemical shift distributions beyond the range of existing MRI sequences.
Keywords: MRI, spectroscopy, continuous wave, sweep imaging, SWIFT
1. Introduction
In the late 1970’s, manufacturers of NMR instruments changed direction from producing continuous wave (CW) spectrometers to pulsed Fourier Transformation (FT) spectrometers. The change was enabled by extensive computerization of spectrometers and the development of the FFT [1], and was predominantly motivated by Ernst’s works [2–5] showing the advantages of pulsed FT techniques for spectroscopy. Acquisition in the presence of a radiofrequency (RF) field of very low power (milliwatts) was replaced by acquisition of free induction decay (FID) following a short (microseconds) RF excitation pulse of high power (kilowatts). Frequency and field modulation with lock-in receivers became obsolete and creative efforts were instead directed toward improvement of high power transmitters, fast transmit/receive (T/R) switches, and flexible pulse programmers. Modern magnetic resonance imaging (MRI) was developed based on the same pulsed FT NMR platform [6]. However, due to the need to use larger probes in most MRI applications, the requirements for MRI scanners are different from the requirements for NMR spectroscopy. Larger RF coils in MRI demand higher power and require longer pulse lengths to excite the spin system to the same flip angle. Indeed, acquiring an FID after a long RF pulse no longer yields a high quality (baseline free) spectrum of the spin system. In reality the acquired signal is a truncated FID with inevitable off-resonance phase distortion and decreased contribution from fast relaxing spins. Therefore, MRI more than NMR spectroscopy can gain from using elements of the “old” CW, rapid scan [7], and stochastic [8] techniques. One example of reviving ideas from CW NMR is the use of adiabatic pulses [9–11] in many MRI applications. Another example is the SWIFT method (SWeep Imaging with Fourier Transformation) [12], which uses swept RF excitation and virtually simultaneous signal acquisition in a timeshared mode. SWIFT has significant benefits for studying objects with ultra-fast spin-spin relaxation rates and has already found many applications [13–16]. In the time-shared mode, the transmitter is “on” during time τp and “off” during the rest of the dwell time dw =1/bw for the acquisition, where bw is the baseband excitation bandwidth and dc = τpbw is a transmitter’s duty cycle. In this “gapped” mode of SWIFT, the RF excitation energy is proportional to the ratio [17]. Gapping always compromises the signal-to-noise ratio (S/N) compared to un-gapped acquisition because , where td is “dead time”. The dead time is the time period after switching the transmitter off, during which the decaying residual transmitter signal is higher than the thermal noise background, which prevents acquisition. For a standard T/R switched transceive coil, td is proportional to the coil ring-down time, which depends on the quality factor Q of the coil and the Larmor frequency as [18]. Due to this constraint, very high excitation bandwidths can be difficult to achieve with gapped SWIFT especially at low Larmor frequencies due to the finite td required for ring-down. Furthermore, td consumes valuable acquisition time in the gaps. Thus, time-shared acquisition imposes a practical limitation for the SWIFT technique. However time-shared acquisition is just one of many modulation techniques used in CW spectroscopy to isolate spin signal from the excitation field [19,20] that can be considered for SWIFT. A continuous wave NMR imaging (CW-NMRI) system, which utilized magnetic field modulation in the slow sweep condition together with phase-sensitive detection and lock-in amplifier, has been demonstrated for three-dimensional multi-nuclear imaging of different materials [21]. In addition, a sideband modulation technique adapted to a modern scanner using a digital receiver was proposed recently [22,23]. There are also different schemes with hybrids and circulators used in radar technology to reach considerable T/R isolation [24]. The goal of the present work is to implement SWIFT in a continuous mode (cSWIFT) for imaging and spectroscopy on a modern MRI scanner with minimal hardware modification. We describe below our initial results and discuss possible future improvements.
2. Theory
2.1. Signal description
A sweeping frequency can be written as an explicit function of both time and frequency. The response to such excitation can be treated in either the time or frequency domain. In the case of constant RF amplitude and linear frequency sweep, the pulse is represented by the chirp function [25]:
| (1) |
where b is the sweep rate in sec−2 and the subscript “−” or “+” denotes the sign of the frequency sweep direction. In continuous mode the acquired raw signal, S, consists of the mixture of the spin signal with the “leakage” of the transmitted signal. For small flip angles, when the spin system can be considered a linear system, the spin signal presents as the convolution of the FID, h(t), with the excitation function [26]. Thus S is described as:
| (2) |
Where the symbol ⊕ means convolution, multiplication by c− describes phase sensitive detection with the receiver frequency locked to the excitation frequency (the frequency-modulated (FM) frame [9]), and where A and ϕ are the relative amplitude and phase of the transmitter leakage signal. In the FM frame, the transmitter signal is a smooth function of time and may be subtracted using some type of model-based fit (see below). Afterwards, the spectrum of the spins, H(ω), can be extracted by one of the existing schemes of de-convolution (correlation) by considering: (a) the signal in the time domain as in the SWIFT method:
| (3) |
or (b) as a frequency domain signal, as used in the rapid scan correlation method [7,27]:
| (4) |
where the operation F{ } represents Fourier transformation. In practice however, baseline correction is incapable of fully removing the transmitter leakage signal. One can show that due to pulse non-ideality and boundary effects the residual transmitter signal will be transformed differently in these two specific de-convolution procedures, which could be used as a quality test of the baseline correction. A combination of the results might be used as an additional tool to clean up the resulting spectrum.
2.2. Levels of spin signals and leakage
The amplitude of the frequency-modulated pulse in frequency units, ω1, that is needed to excite a spin system with flip angle, θ, and bandwidth, bw, satisfies the relation [17]:
| (5) |
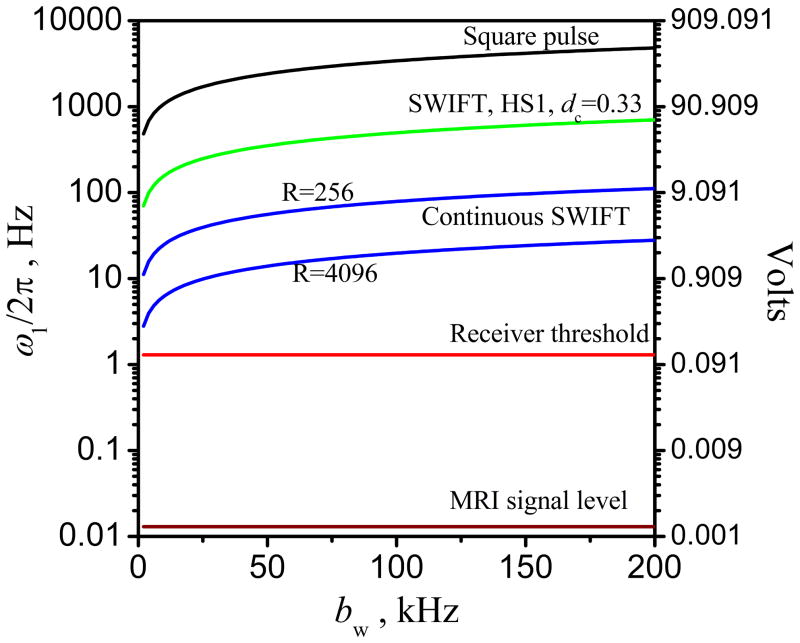
where γ is the gyromagnetic ratio, is the RF field amplitude, β1/2n is a shape function (which is equal to 1 for a chirp pulse), Tp is the pulse length, and R = Tpbw. The curves in Fig. 1 present the calculated values of ω1 needed to rotate a proton spin system to the “Ernst angle” in a spoiled steady-state experiment with longitudinal relaxation time T1 = 1 s. The repetition time, TR, is equal to the acquisition time, which in the case of SWIFT is equal to Tp. In the case of gapped SWIFT, the hyperbolic secant (HS) shape with transmitter duty cycle dc = 0.33 with R = 256 was used. For comparison, the RF amplitude needed for a standard square hard pulse having length equal to 1/(3*bw) [17] is also presented. Note that cSWIFT, in comparison to pulsed MRI, needs about 100 times (40db) lower amplitude of the RF pulse or less, depending on R value.
Figure 1.
The calculated values of ω1 (left axis) and estimated voltages (right axis) of RF amplitude vs. bandwidth in comparison with the amplitude of the spin signal and receiver threshold (details in the text).
To obtain a rough estimate of the relative levels of the RF amplitude in comparison to the spin signal amplitude during a gapped SWIFT experiment (with HS pulse, dc = 0.33, R = 256, bw = 60 kHz), we first performed direct measurements with an oscilloscope. A 15-cm spherical phantom filled with water was used. The voltage scale shown in Fig. 1 was set based on those measurements. We also estimated that the receiver threshold was about 1.3 V with these parameters. The receiver threshold was the maximum signal level allowed as determined by the electronic sensor in the Agilent system which gives the “overflow” error message when it is exceeded. Thus, according Fig. 1, to ensure that, with the utilized parameter set, a signal in continuous mode does not exceed the specified linear region of the receiver, a minimum of 40 db isolation between the transmitter and receiver is required.
2.3. Transmitter-receiver isolation
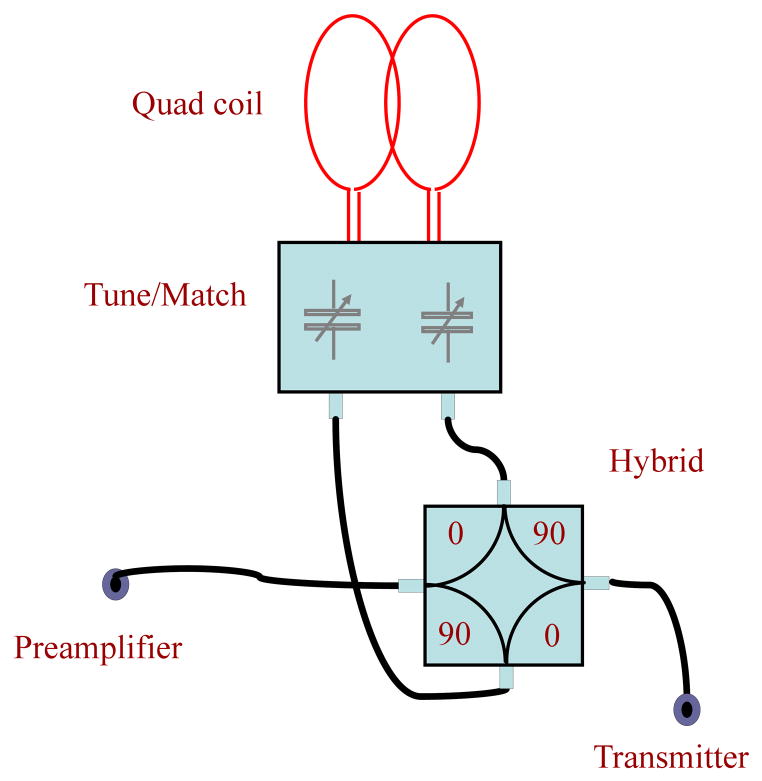
To reduce the dynamic range of the signal and to decrease the contribution of the transmitter’s systematic and thermal noise in the resulting spectra, the leakage amplitude A must be minimized. Let’s consider a well-known scheme in MRI based on a quadrature hybrid used to connect quad coils (Fig. 2). This connection scheme is also in use for monostatic radar as a self-duplexer with about 30–40 db T/R isolation [24].
Figure 2.
Quad coil connection based on a quadrature hybrid.
The leakage A in this scheme has at least two sources. The first, Ahh, is due to direct coupling between transmitter and receiver via connectors inside the hybrid, which depends on the quality of the hybrid. The second, Ach, appears due to a mismatch of impedances between the coil probe and hybrid. Considering that the hybrid’s bandwidth is much broader than that of the coil, one can conclude that the frequency dependence of the leakage is mostly determined by the Ach term. In a simplified description, the leakage can be approximated by [28]:
| (7) |
where ω0 is the resonance frequency, Δω = ω − ω0, τ = 2Q/ω0, and Rh and Rprobe are respectively the hybrid and probe resistances, which are usually (by matching or design) about 50 ohms. For the case of Δωτ ≪ 1, Eq. (7) predicts almost linear off-resonance dependence of the leakage.
In practice, the transmitter leakage signal can be minimized by careful adjustment of the tune/match system and therefore very high isolation can be attained at a given frequency. In this simple scheme, however, the leakage amplitude will be sensitive to coil deformation, vibration, and load variations due to sample movement, all of which should be minimized as much as possible. At some level such instabilities can be compensated during signal pre-processing.
2.4. The signal pre-processing
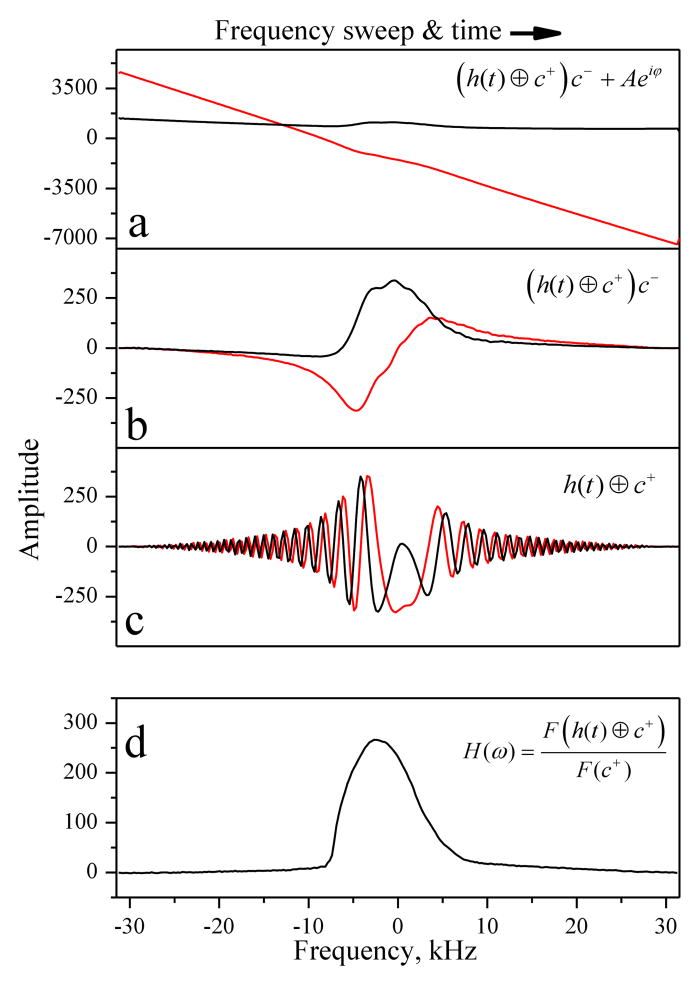
To obtain projections of the scanned object, cSWIFT requires pre-processing of the acquired (raw) real and imaginary components of the signal. The step-by-step procedure used herein is shown in Fig. 3. At the raw data stage ((h(t) ⊕ c+)c− + Aeiϕ) (Fig. 3a), leakage is clearly visible and is mostly confined to the imaginary component, which has almost linear dependency on frequency as predicted by Eq. (7).
Figure 3.
Step by step (a→b→c→d) modification of the acquired raw real and imaginary cSWIFT signal until the projection of the scanned object is obtained (details in the text).
2.4.1 Subtraction of leakage signal
The leakage signal Aeiϕ is additive to the spin signal, so it should be subtracted. As was mentioned previously for the small sweep range used in spectroscopy the leakage signal can be approximated by a linear function. However for imaging, especially of short T2 objects, the required sweep range usually exceeds the linear regime and a polynomial fitting procedure must be used. We found that fitting by a second order polynomial is more practical than the full Eq. (7). To avoid noise contribution to the fitting, the average of groups of projections should be used; however zero order coefficients could be adjusted for each projection individually to compensate long term drifts of the transmitter leakage.
It is important to note that with chirp excitation artifacts appear when spins are excited close to the beginning or end of the pulse. In this initial work we avoided these effects by choosing the field of view to be about twice the size of the studied objects. In the future edge effects could be minimized by a smooth ramp up and ramp down of the chirp pulse at sweep frequencies outside the acquisition bandwidth (field of view) [10].
2.4.2 Pulse imperfection and “bullseye artifacts”
Because the same pulse is used to excite each projection, pulse imperfections affect each projection in the same manner. As a result, the reconstructed images are distorted by artificial spheres of different radii and intensity, which we call “bullseye artifact”. These artifacts that arise from pulse imperfections can be corrected [29]. The correction function is found from high–pass filtering the average of all projections. For cSWIFT data, “bullseye correction” [29] can be applied on the time domain signal after baseline subtraction and one more time subsequently on the correlated spectra. It is worth noting that due to the leakage contribution one part of the artifact signal is additive in the time domain and the other (due to convolution of pulse function and spin signal) is multiplicative in the frequency domain [29].
2.4.3 Transformation to the first rotating frame
Fig. 3b presents the rescaled signal in the FM frame after baseline subtraction ((h(t) ⊕ c+)c−). This signal is transformed to the first rotating frame (at the Larmor frequency) by multiplication with the complex chirp pulse (Fig. 3c).
2.4.4 Correlation
The final correlation step produces the time domain spin impulse response (FID) h(t) (Fig. 3c).
3. Methods
The spectroscopic and imaging data presented here were acquired using 9.4 T (31 cm-bore) and 4 T (90 cm-bore) MRI scanners equipped with Varian (now Agilent) DirectDrive™ consoles. The maximum available field gradient strengths are 400 and 40 mT/m, respectively. The images from the 4 T scanner were acquired with the basic connection scheme presented in Fig. 2 with a quadrature transmit/receive breast coil, which consists of two orthogonal single loop coils of about 20 cm diameter (Q 50 at 169 MHz) [30]. A linear 2.2 cm single loop coil (Q ≈ 100 at 400 MHz) was used at the 9.4 T scanner with a similar connection (Fig. 2) but with 50 ohm termination at the hybrid’s second output. In all cases, transmitter coupling through the hybrid as observed with the console was minimized through the adjustment of individual coil tune and match conditions.
In low band spectroscopic experiments, due to the relatively narrow excitation bandwidth (6 kHz), the relation Δωτ ≪ 1 was satisfied and a linear approximation for the baseline was used.
In cSWIFT imaging, the baseline was fitted by a second order polynomial that was more practical than the full Eq. (7). To avoid noise contribution to the fitting, the average of all projections was used. To minimize the spin signal contribution to the fitting, only points at the beginning and end of the average projection (20% of all points) were used; however zero order coefficients were adjusted for each projection individually to compensate long term drifts of the transmitter leakage.
A “bullseye correction” [29] was applied on the time domain signal after baseline correction and one more time on the correlated spectra. The “bullseye correction” is necessary to correct effects from pulse imperfections which are additive in the time domain and multiplicative in the frequency domain [29].
Acquisition parameters, phantoms, and tissue sample were:
Ethanol phantom: A 15 cm diameter glass sphere loaded with 40% ethanol-water mixture. Acquisition parameters: 4 T, cSWIFT with bw = 6 kHz, 4096 complex points per spectrum;
Test phantom: The phantom consisted of 7 centrifuge tubes (50 mL) containing 1% agarose gel in water doped with different concentrations of magnesium chloride. The tubes were submerged in water in a 500mL tapered cylindrical plastic container. Acquisition parameters: 9.4 T, cSWIFT and SWIFT with bw = 62.5 kHz, 64000 views (spokes in k-space), 256 complex points per view, the diameter of field of view was 40 cm, total acquisition time 4 min;
TKA sample: A human total knee arthroplasty sample with approximate dimensions 2.5 cm × 2 cm × 1 cm. Acquisition parameters: 9.4 T, cSWIFT and SWIFT with bw = 71 kHz, 128000 views, 256 complex points per view, the diameter of field of view was 4 cm, total acquisition time 7.7 min;
Water phantom: A 15 cm diameter glass sphere loaded with water. Acquisition parameters: 4 T, cSWIFT with bw = 1 MHz, 4096 complex points per spectrum with sweep rate b = 24.4 MHz/sec. The sliding acquisition bandwidth, sw was equal to 100 kHz.
The sweep rate in the case of cSWIFT was equal to bw/Tp. For gapped SWIFT a hyperbolic secant function [31] with oversampling factor equal to 16 [17] was used. The sweep time (=acquisition time) of each view in SWIFT and cSWIFT was equal to Tp = 256/bw. The time delay between the end of one acquisition and the start of the next acquisition was fixed at 0.6 ms. The field gradients changed values at the beginning of that delay. Each acquisition results in one spoke (radial center out trajectory) of k-space after pre-processing. The terminus of the radial spokes form isotropically distributed points on a sphere located in one of up to 32 interleaved spirals [32]. 3D radial SWIFT data were processed using an in-house program developed in LabVIEW (National Instruments) and interpolated with a Kaiser-Bessel function onto a Cartesian grid utilizing in-house matlab mex code.
4. Results
4.1. Spectroscopy with cSWIFT
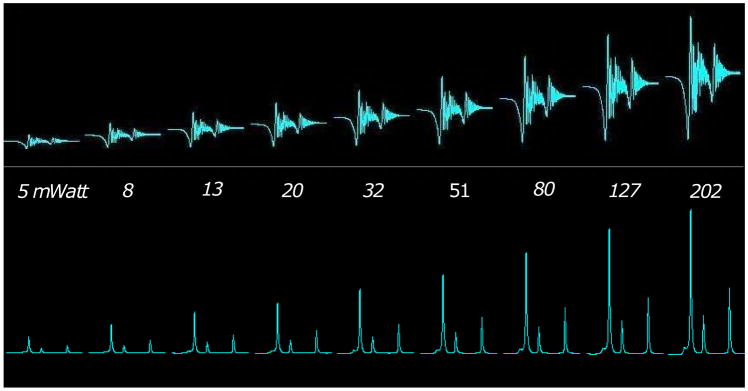
Fig. 4 presents the array of raw data (top) and de-convolved spectra (bottom) of the ethanol phantom with increasing flip angles (from left to right) in continuous mode. As expected the baseline of the raw data (A) increases with increasing flip angle and is approximately equal to the amplitude of the FID.
Figure 4.
Array of raw data (top) and de-convolved spectra (bottom) of the Ethanol phantom with increasing flip angles (from left to right) in continuous mode.
4.2. Imaging with cSWIFT
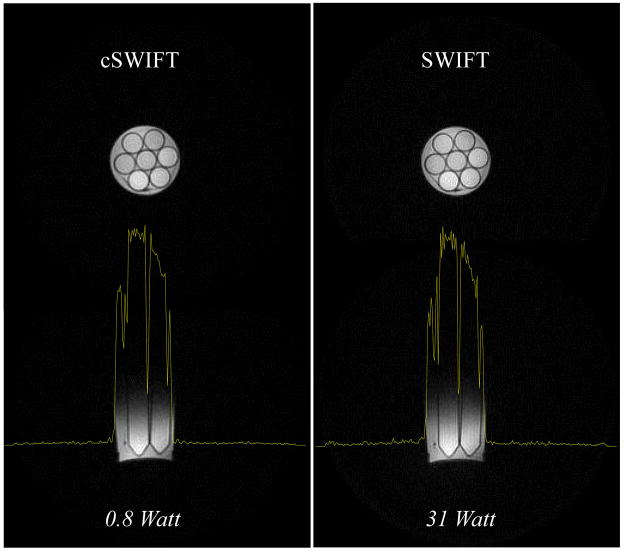
Images of the test phantom were obtained with gapped and continuous SWIFT sequences, with minimal differences in experimental conditions and parameters (Fig. 5). The peak power used for excitation in continuous mode was about 0.8 Watt, which was about 40 times less than that used in gapped SWIFT. It should be mentioned that the large change in necessary power was a result of both gapping and the less favorable shape factor of the hyperbolic secant pulse used in gapped SWIFT relative to cSWIFT. The power level used in cSWIFT is extremely low as compared to the high peak power (4 kW) typically transmitted at 4 T, so for lower overall noise we chose a lower wattage amplifier with a better noise figure. The high power amplifier was replaced with a 10 W linear amplifier. With this setup, the noise introduced by the output of the linear amplifier was lower than the receive-only noise floor. Accordingly, the profile in the resulting cSWIFT image, shown in Fig. 5, is less noisy than the profile from the regular SWIFT image.
Figure 5.
Selected slices of 3D images of the Test phantom obtained under as similar as possible conditions with the gapped (right) and continuous (left) SWIFT sequences. The profiles (yellow) show the signal intensity across the object.
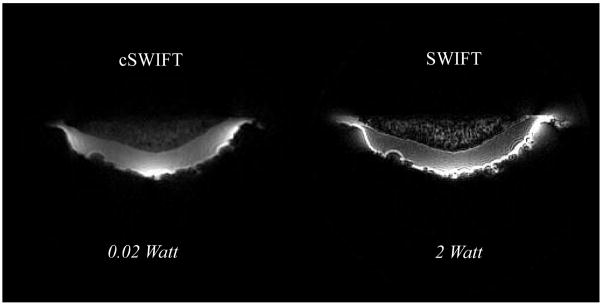
The cSWIFT image of a human total knee arthroplasty (TKA) sample is presented in Fig. 6 (left) and compared with a gapped SWIFT image (right) with approximately similar flip angles. In this case, at the 9.4 T scanner, cSWIFT data were acquired without any transmitter amplifier and the hybrid was directly connected to the output of the console. Although in this case the Ernst angle was not achieved because the output of the console transmitter is only ~20 mW, this is still a remarkable demonstration of the power efficiency of the technique.
Figure 6.
Selected slices of 3D images of the TKA sample obtained under as similar as possible (see text) conditions with the regular (right) and continuous (left) SWIFT sequences.
The connection of the linear coil using a hybrid with the unused output terminated by a 50 ohm load at room temperature decreases SNR by the fraction of the terminator’s noise power that reaches the preamplifier through the hybrid [33], and is used here only for “proof of principle”. A more optimal connection scheme for the linear coil could be achieved with a circulator [33].
It is worth noting that the relative intensity of the cartilage signal is higher in continuous mode. The contrast difference in these images might be related to an additional saturation of broad collagen signal [34] from the sidebands created in the gapped mode [17], but a definite conclusion requires more detailed study.
4.3 High bandwidth spectroscopic experiment
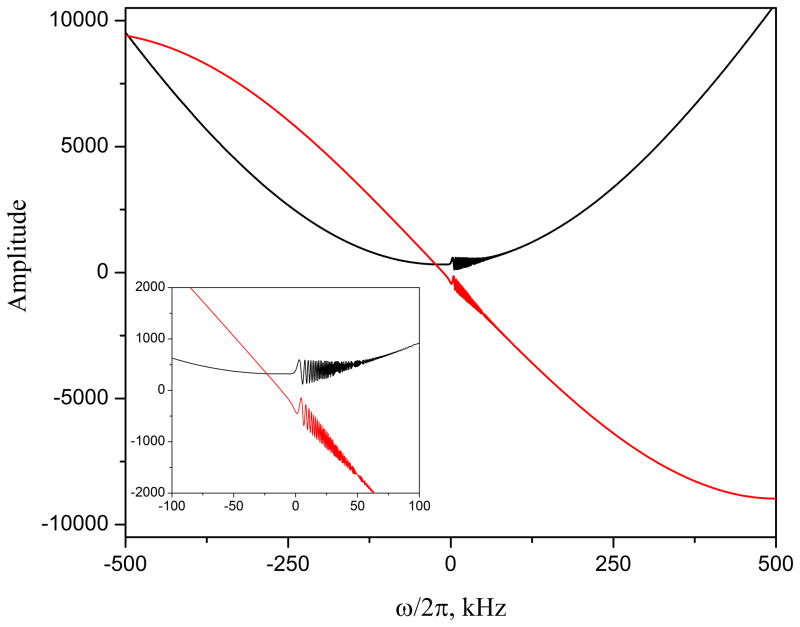
To emphasize the difference between continuous and gapped versions of SWIFT, Fig 7 shows the raw cSWIFT data (real and imaginary components) obtained from the water phantom using extremely high bandwidth. Such a high bandwidth is practically unreachable with the gapped version of SWIFT. The shapes of the baselines are accurately predicted by Eq. 7.
Figure 7.
The raw cSWIFT data (real and imaginary components) of water phantom obtained with 1 MHz bandwidth.
Unlike the previously presented cSWIFT experiments, here the acquisition bandwidth (sw) differs from excitation bandwidth (= sweep range) (bw). Because the receiver frequency changes frequency synchronously with the sweeping frequency, the acquisition window in this case should be considered as a sliding window. The sliding acquisition window sw was 100 kHz, which is ten times less than entire sweep range, bw. In cSWIFT the main magnetic field is constant and each spin, after excitation, keeps its own constant resonance frequency in the laboratory frame. In the FM frame, a spin’s frequency will appear to be changing in time with the sweep rate b. The audio filter of the receiver will truncate all signals outside the −sw/2 to +sw/2 window (Fig. 7), and this is equivalent to a time-domain apodization. Thus, the sliding window results in a broadening of the spectral lines by about 2b/sw hertz. In specific case presented, the broadening corresponds to 500 Hz; but at the same time, the S/N is improved by a factor of about sqrt(bw/sw) = 3.16. The possibility to independently set sw and bw creates additional flexibility for optimizing the S/N, acquisition time, and power consumption for each specific case.
5. Conclusions
There are two main factors which distinguish SWIFT from pulsed NMR techniques and these make it possible for SWIFT to be performed in a continuous mode. The first is that, when implemented with a chirp excitation pulse, SWIFT uses the lowest possible peak amplitude of the RF field for a given flip angle and bandwidth because the power is evenly distributed in time. Second, although the leakage signal may occupy the biggest fraction of digitized signal, the requirement for high dynamic range is somewhat reduced because the spin signal (convolved with the excitation pulse) is also distributed in time..
The results presented here were obtained using Agilent DirectDrive™ systems with minimal hardware modification; specifically, the transmitter was bypassed or replaced by the low power linear amplifier. We obtained high quality images with SWIFT in continuous mode with bandwidths up to 71 kHz. Increasing the bandwidth will require dedicated hardware modifications, including possible construction of a probe with highly decoupled crossed coils, optimizing a connection scheme based on hybrids or active circulators [35], and/or replacing the preamplifier with one having an extended dynamic range. In the meantime, the highly oversampled digital receiver used on the Agilent system greatly exceeds the discretization requirements for cSWIFT. We also noticed the presence of a long term temperature drift on the leakage amplitude, possibly related to the stability of the transmitter output and/or tune/match unit. However the effect of this drift on the quality of the reconstructed images was eliminated by applying separate baseline corrections on relatively short blocks of the collected data. Of course, transmitter leakage would be reduced by improved adjustment of the probe to secure better isolation.
In general, the results presented can be considered a successful “proof-of-principle” of the continuous SWIFT technique. In particular, we believe that the quality of available scanner electronics is good enough to develop the “direct” continuous SWIFT technique up to very high bandwidths, without involving any spin modulation procedure. With this direct method, object motion remains a concern since it will modulate the leakage signal due to varying coil loading. We believe future engineering advances will address this issue by attaining improved T/R isolation and/or by fast feedback compensation of such modulation [36]. Alternatively, one can also consider using some form of modulation technique involving minimal modifications to existing MRI hardware.
At this stage of development we did not plan to do a comprehensive S/N comparison between the gapped and continuous versions of SWIFT. It is obvious that due to inherently high T/R isolation the gapped SWIFT will always have an advantage in the simplicity of experimental setup for most applications. However the ability of continuous SWIFT to provide extremely high bandwidths at high and especially at low Larmor frequencies, where gapped SWIFT will fail, allows this method immediately to find a niche in MRI. In general the result of any comparison of these two methods will depend on the success of solving the above mentioned technical problems.
In conclusion, due to the total absence of “dead time,” continuous SWIFT has the great potential for extending the application of MRI and spectroscopy to studying spin systems having extremely fast relaxation or broad chemical shift distributions beyond that of existing short T2 sensitive MRI sequences.
Highlights.
Investigate the levels of spin signals relative to RF excitation field;
Method for direct measurements of spin signals during RF excitation;
Method for separation of spin signals from transmitter leakage;
Image quality proves the functionality.
Acknowledgments
This research was supported by NIH P41 RR008079, S10 RR023730, S10 RR027290 RR008079, R21 CA139688 grants and the WM Keck Foundation. We thank Drs. Ryan Chamberlain and Peter Andersen for useful discussions and Drs. Jutta Ellermann, Wen Ling, and Elizabeth Arendt for the opportunity to use the TKA sample in this study. In addition, we thank Dr. Rajesh Venkataraman for developing the gridding code.
Footnotes
Disclosure
Drs. Garwood, Idiyatullin and Corum are entitled to sales royalties from a technology license held by GE Healthcare through the University of Minnesota for products related to the research described in this paper. The University of Minnesota also has a financial interest arising from a right to receive royalty income under the terms of the license agreement. This relationship has been reviewed and managed by the University of Minnesota in accordance with its conflict of interest policies.
Publisher's Disclaimer: This is a PDF file of an unedited manuscript that has been accepted for publication. As a service to our customers we are providing this early version of the manuscript. The manuscript will undergo copyediting, typesetting, and review of the resulting proof before it is published in its final citable form. Please note that during the production process errors may be discovered which could affect the content, and all legal disclaimers that apply to the journal pertain.
References
- 1.Cooley JW, Tukey JW. An algorithm for the machine calculation of complex fourier series. Math Comput. 1965;19:297–307. [Google Scholar]
- 2.Ernst RR. Sensitivity enhancement in magnetic resonance. I. Analysis of the method of time averaging. Rev Sci Instrum. 1965;36:1689–1695. [Google Scholar]
- 3.Ernst RR. Sensitivity enhancement in magnetic resonance. Adv Magn Reson. 1966;2:1–135. [Google Scholar]
- 4.Ernst RR, Anderson WA. Sensitivity enhancement in magnetic resonance. Ii. Investigation of intermediate passage conditions. Rev Sci Instrum. 1965;36:1696–1706. [Google Scholar]
- 5.Ernst RR, Anderson WA. Application of fourier transform spectroscopy to magnetic resonance. Rev Sci Instrum. 1966;37:93–102. [Google Scholar]
- 6.Lauterbur PC. Image formation by induced local interactions: Examples employing nuclear magnetic resonance. Nature. 1973;242:190–191. [PubMed] [Google Scholar]
- 7.Dadok J, Sprecher RF. Correlation NMR spectroscopy. J Magn Reson. 1974;13:243–248. [Google Scholar]
- 8.Blümich B. Stochastic NMR imaging. J Magn Reson. 1984;60:37–45. [Google Scholar]
- 9.Garwood M, DelaBarre L. The return of the frequency sweep: Designing adiabatic pulses for contemporary NMR. J Magn Reson. 2001;153:155–177. doi: 10.1006/jmre.2001.2340. [DOI] [PubMed] [Google Scholar]
- 10.Kunz D. Use of frequency-modulated radiofrequency pulses in MR imaging experiments. Magn Reson Med. 1986;3:377–84. doi: 10.1002/mrm.1910030303. [DOI] [PubMed] [Google Scholar]
- 11.Pipe J. Spatial encoding and reconstruction in MRI with quadratic phase profiles. Magn Reson Med. 1995;33:24–33. doi: 10.1002/mrm.1910330105. [DOI] [PubMed] [Google Scholar]
- 12.Idiyatullin D, Corum C, Park J-Y, Garwood M. Fast and quiet MRI using a swept radiofrequency. J Magn Reson. 2006;181:342–349. doi: 10.1016/j.jmr.2006.05.014. [DOI] [PubMed] [Google Scholar]
- 13.Zhou R, Idiyatullin D, Moeller S, Corum C, Zhang H, Qiao H, Zhong J, Garwood M. SWIFT detection of SPIO-labeled stem cells grafted in the myocardium. Magn Reson Med. 2010;63:1154–1161. doi: 10.1002/mrm.22378. [DOI] [PMC free article] [PubMed] [Google Scholar]
- 14.Idiyatullin D, Corum C, Moeller S, Prasad H, Garwood M, Nixdorf D. Dental magnetic resonance imaging: Making the invisible visible. J Endod. 2011;37:745–752. doi: 10.1016/j.joen.2011.02.022. [DOI] [PMC free article] [PubMed] [Google Scholar]
- 15.Kendi ATK, Khariwala SS, Zhang J, Idiyatullin DS, Corum CA, Michaeli S, Pambuccian SE, Garwood M, Yueh B. Transformation in mandibular imaging with sweep imaging with fourier transform magnetic resonance imaging. Arch Otolaryngol Head Neck Surg. 2011;137:916–919. doi: 10.1001/archoto.2011.155. [DOI] [PMC free article] [PubMed] [Google Scholar]
- 16.Corum CA, Moeller S, Idiyatullin D, Hutter D, Snyder A, Nelson MT, Emory T, Kuehn-Hajder JE, Eberly LE, Adriany G, et al. Breast morphological and DCE MRI with SWIFT. ISMRM Annual Scientific Meeting & Exhibition; 2011; Montreal, Quebec, Canada. [Google Scholar]
- 17.Idiyatullin D, Corum C, Moeller S, Garwood M. Gapped pulses for frequency-swept MRI. J Magn Reson. 2008;193:267–273. doi: 10.1016/j.jmr.2008.05.009. [DOI] [PMC free article] [PubMed] [Google Scholar]
- 18.Hoult DI. Fast recovery, high sensitivity NMR probe and preamplifier for low frequencies. Rev Sci Instrum. 1979;50:193–200. doi: 10.1063/1.1135786. [DOI] [PubMed] [Google Scholar]
- 19.Anderson WA. Applications of modulation techniques to high resolution nuclear magnetic resonance spectrometers. Rev Sci Instrum. 1962;33:1160–1166. [Google Scholar]
- 20.Baker EB, Burd LW, Root GN. Time-sharing modulation at 200 kc applied to broad and narrow line NMR for base-line stability. Rev Sci Instrum. 1965;36:1495–1498. [Google Scholar]
- 21.Fagan AJ, Davies GR, Hutchison JM, Glasser FP, Lurie DJ. Development of a 3-D, multi-nuclear continuous wave NMR imaging system. J Magn Reson. 2005;176:140–150. doi: 10.1016/j.jmr.2005.05.022. [DOI] [PubMed] [Google Scholar]
- 22.Brunner DO, Pavan M, Dietrich B, Rothmund D, Heller A, Pruessmann KP. Sideband excitation for concurrent rf transmission and reception. ISMRM Annual Scientific Meeting & Exhibition; 2011; Montreal, Quebec, Canada. [Google Scholar]
- 23.Michal CA. Nuclear magnetic resonance noise spectroscopy using two-photon excitation. The Journal of Chemical Physics. 2003;118:3451–3454. [Google Scholar]
- 24.Nagen JB. Radio-frequency electronics: Circuits and applications. Cambridge University Press; New York: 1996. [Google Scholar]
- 25.Barrett HH, Myers K. Foundations of image science. John Wiley & Sons; Hoboken, New Jersey: 2004. [Google Scholar]
- 26.Shaw D. Fourier transform NMR spectroscopy. Elsevier; Amsterdam, New York: 1984. [Google Scholar]
- 27.Gupta RK, Ferretti JA, Becker ED. Rapid scan fourier transform NMR spectroscopy. J Magn Reson. 1974;13:275–290. [Google Scholar]
- 28.de Graaf RA. In vivo NMR spectroscopy: Principles and techniques. John Wiley & Sons; New York: 1998. [Google Scholar]
- 29.Moeller S, Corum C, Idiyatullin D, Chamberlain R, Garwood M. Correction of rf pulse distortions, with application in radial imaging using SWIFT. ISMRM 16th Scientific Meeting & Exhibition; 2008 3–9 May; Toronto, Ontario, Canada. [Google Scholar]
- 30.Merkle H, DelaBarre L, Bolan PJ, Baker EH, Everson LI, Yee D, Garwood M. Transceive quadrature breast coils and applications at 4 Tesla. ISMRM Annual Scientific Meeting & Exhibition; 2001 21–27 April; Glasgow, Scotland. [Google Scholar]
- 31.Silver MS, Joseph RI, Hoult DI. Selective spin inversion in nuclear magnetic resonance and coherent optics through an exact solution of the bloch- riccati equation. Physical Review, A. 1985;31:2753–2755. doi: 10.1103/physreva.31.2753. [DOI] [PubMed] [Google Scholar]
- 32.Wong ST, Roos MS. A strategy for sampling on a sphere applied to 3D selective rf pulse design. Magn Reson Med. 1994;32:778–84. doi: 10.1002/mrm.1910320614. [DOI] [PubMed] [Google Scholar]
- 33.García-García Q. Noise in lossless microwave multiports. International Journal of RF and Microwave Computer-Aided Engineering. 2004;14:99–110. [Google Scholar]
- 34.Ling W, Regatte RR, Schweitzer ME, Jerschow A. Characterization of bovine patellar cartilage by NMR. NMR Biomed. 2008;21:289–295. doi: 10.1002/nbm.1193. [DOI] [PubMed] [Google Scholar]
- 35.Bahri R, Abdipour A, Moradi G. Analysis and design of new active quasi circulator and circulators. Progress In Electromagnetics Research, PIER. 2009;96:377–395. [Google Scholar]
- 36.Hoult DI, Kolansky G, Kripiakevich D, King SB. The NMR multi-transmit phased array: A cartesian feedback approach. J Magn Reson. 2004;171:64–70. doi: 10.1016/j.jmr.2004.07.020. [DOI] [PubMed] [Google Scholar]


