Abstract
Objective
To describe effects of ranibizumab and bevacizumab when administered monthly or as needed for two years and to describe the impact of switching to as-needed treatment after a year of monthly treatment.
Design
Multicenter, randomized clinical trial.
Participants
Patients (N=1107) who were followed during Year 2 among 1185 patients with neovascular age-related macular degeneration (AMD) who were enrolled in the clinical trial.
Interventions
At enrollment, patients were assigned to four treatment groups defined by drug (ranibizumab or bevacizumab) and dosing regimen (monthly or as needed). At one year, patients initially assigned to monthly treatment were randomly reassigned to monthly or as needed treatment, without changing the drug assignment.
Main Outcome Measure
Mean change in visual acuity.
Results
Among patients following the same regimen for two years, mean gain in visual acuity was similar for both drugs (bevacizumab-ranibizumab difference: −1.4 letters; 95% confidence interval (CI): [−3.7, 0.8]; p=0.21). Mean gain was greater for monthly than for as-needed treatment (difference: −2.4 letters; CI: [−4.8, −0.1]; p=0.046). The proportion without fluid ranged from 13.9% in the bevacizumab-as-needed group to 45.5% in the ranibizumab monthly group (drug p=0.0003; regimen p<0.0001). Switching from monthly to as-needed treatment resulted in greater mean decrease in vision during year 2 (−2.2 letters, p=0.03) and a lower proportion without fluid (−19%, p<0.0001). Rates of death and arteriothrombotic events were similar for both drugs (p>0.60). The proportion of patients with ≥1 systemic serious adverse events was higher with bevacizumab than ranibizumab (39.9% vs. 31.7%; adjusted risk ratio 1.30; CI [1.07, 1.57]; p=0.009). The majority of the excess events have not been associated previously with systemic therapy targeting vascular endothelial growth factor (VEGF).
Conclusions
Ranibizumab and bevacizumab had similar effects on visual acuity over a two-year period. Treatment as needed resulted in less gain in visual acuity, whether instituted at enrollment or after one year of monthly treatment. There were no differences between drugs in rates of death or arteriothrombotic events. The interpretation of the persistence of higher rates of serious adverse events with bevacizumab is uncertain because of the lack of specificity to conditions associated with inhibition of VEGF.
INTRODUCTION
Clinical trials established ranibizumab as a highly effective treatment for neovascular agerelated macular degeneration (AMD), the leading cause of legal blindness in the United States.1,2 While awaiting approval of ranibizumab by the Food and Drug Administration, ophthalmologists began using off-label bevacizumab since the drug had target specificity similar to that of ranibizumab and was available at low cost. Bevacizumab rapidly became the most commonly used drug for the treatment of neovascular AMD despite the absence of data from randomized clinical trials supporting its use.3
In May 2011, we reported the one-year results of the Comparison of AMD Treatments Trials (CATT).4 This randomized clinical trial demonstrated that bevacizumab and ranibizumab had nearly identical effects on visual acuity and that less-than-monthly, or as-needed, dosing did not compromise vision. Both drugs dramatically reduced retinal and subretinal fluid but ranibizumab eliminated fluid more often. Although there were no differences between drugs in rates of death and arteriothrombotic events, there were more serious adverse events in patients treated with bevacizumab (risk ratio 1.29). Because neither drug eliminates neovascularization, treatment continues indefinitely for most patients. Therefore, the longer-term effects of these drugs and dosing regimens are important.
METHODS
Study Population
The design and methods for CATT have been published previously.4 Eligible eyes had active choroidal neovascularization secondary to AMD, no previous treatment, visual acuity between 20/25 and 20/320, and neovascularization, fluid, or hemorrhage under the fovea. The study was approved by an institutional review board associated with each center. The study adhered to the tenets of the Declaration of Helsinki and was performed in compliance with the Health Insurance Portability and Accountability Act. All patients provided written informed consent. The study is registered on http:/www.clinicaltrials.gov, NCT00593450, accessed March 26, 2012.
Treatment
At enrollment, patients were assigned with equal probability to one of four treatment groups defined by drug (ranibizumab or bevacizumab) and by dosing regimen (monthly or as needed). At one year, patients initially assigned to monthly treatment retained their drug assignment but were re-assigned randomly, with equal probability, to either monthly or as needed treatment (“switched regimen group”). Patients initially assigned to as needed treatment had no change in assignment; i.e., they retained both their drug assignment and as-needed dosing regimen for year 2.
The dose per intravitreal injection was 0.50 mg ranibizumab in 0.05 ml solution or 1.25 mg bevacizumab in 0.05 ml solution. Patients on the monthly dosing regimen received an injection every 4 weeks. Patients on the as needed dosing regimen were evaluated for treatment every 4 weeks and treated when fluid on optical coherence tomography (OCT), new or persistent hemorrhage, decreased visual acuity relative to the previous visit, or dye leakage on fluorescein angiography was present.
Outcome Measures
The primary outcome measure was mean change in visual acuity. Pre-specified secondary outcomes were the proportion of patients with a change in visual acuity of ≥15 letters, number of injections, drug costs (per-dose cost, approximately $2000 for ranibizumab and $50 for bevacizumab),5 presence of fluid and change in foveal retinal thickness, change in lesion size on fluorescein angiography, and incidence of systemic and ocular adverse events. OCT scans during year 1 were performed with time domain OCT. Spectral domain OCT was used for 22.6% of scans during year 2. Clinic coordinators questioned patients at each visit regarding adverse events and coded events according to the Medical Dictionary for Regulatory Activities (MedDRA) system; a medical monitor reviewed serious adverse events and their coding. Arteriothrombotic events (as defined by the Antiplatelet Trialists’ Collaboration) were pre-specified for monitoring.6
Masking to Treatment Assignment
Image graders, visual acuity examiners, and the medical monitor were unaware of drug and dosing regimen. Ophthalmologists were unaware of drug assignment. Clinic coordinators were aware of both drug and regimen. Patients were not informed of their drug assignment; however, insurance and billing documents specified ranibizumab but not study-supplied bevacizumab. Therefore, patients may have learned or deduced their assigned drug from these financial documents.
Statistical Analysis
CATT was designed as a randomized non-inferiority clinical trial involving 4 treatment groups with the primary analysis at one year. The primary analysis was pre-specified as a comparison of mean change in visual acuity from baseline among the 4 treatment groups. The sample size of approximately 300 patients in each of the treatment groups was sufficient to provide two-sided 99.2% confidence limits that would exclude a difference of 5 letters (the non-inferiority limit) if the true difference were 0 letters.
Year 2 of CATT was conducted to describe longer term effects of the original 4 treatment groups and to describe the impact of switching to from monthly to as-needed treatment after a year of monthly treatment. The re-randomization of each monthly treatment group at the end of one year into two groups created 6 treatment groups and reduced the sample size of groups originally treated monthly. The result is a higher number of possible comparisons, loss of statistical power, and increased likelihood of an inconclusive result regarding non-inferiority for each comparison. The analyses presented herein describe the effects of the drugs and the effects of the regimens in Year 2, rather than the effects of each drug and dosing regimen combination. This approach yields larger sample sizes, greater precision, and increased power. The approach provides an accurate description of the results when there is no “interaction” between drug and dosing regimen; i.e., when the beneficial or harmful effect of a drug is the same for each dosing regimen and the effect of the dosing regimen is the same for each drug.
For comparisons of patients remaining on their originally-assigned dosing regimen in year 2, change relative to baseline was used. For comparisons of patients randomly reassigned to a dosing regimen for year 2, change relative to the 1-year value was used. Comparisons without covariate adjustment were made with analysis of variance for continuous outcome measures and chi-square tests for categorical outcome measures with treatment specified by drug and dosing regimen (main effects). Interaction between drug and dosing regimen was assessed with linear regression for continuous outcome measures and with logistic regression for categorical outcome measures. Unless specified otherwise, interaction terms for primary and secondary outcomes were associated with p-values >0.10 and not included in models. Adjustment for covariates and three alternative approaches for handling missing data (multiple imputation using propensity scoring or regression modeling and last observation carrying forward) for the 2-year visual acuity were performed as sensitivity analyses.7,8 Quarterly measurements of change in visual acuity were summarized by means of longitudinal analysis.8 Time to first systemic serious adverse event was analyzed using a Cox proportional hazards model that included dosing regimen as a time dependent covariate and a propensity score based on age, smoking status, use of dietary supplements, and status of 15 conditions associated (p<0.10) with incidence of serious adverse events.9,10 Serious adverse events were further classified as previously associated with drugs affecting the vascular endothelial growth factor (VEGF) pathway (arteriothrombotic events, systemic hemorrhage, congestive heart failure, venous thrombotic events, hypertension, vascular death).11,12 Analyses followed the intention-to-treat principle.
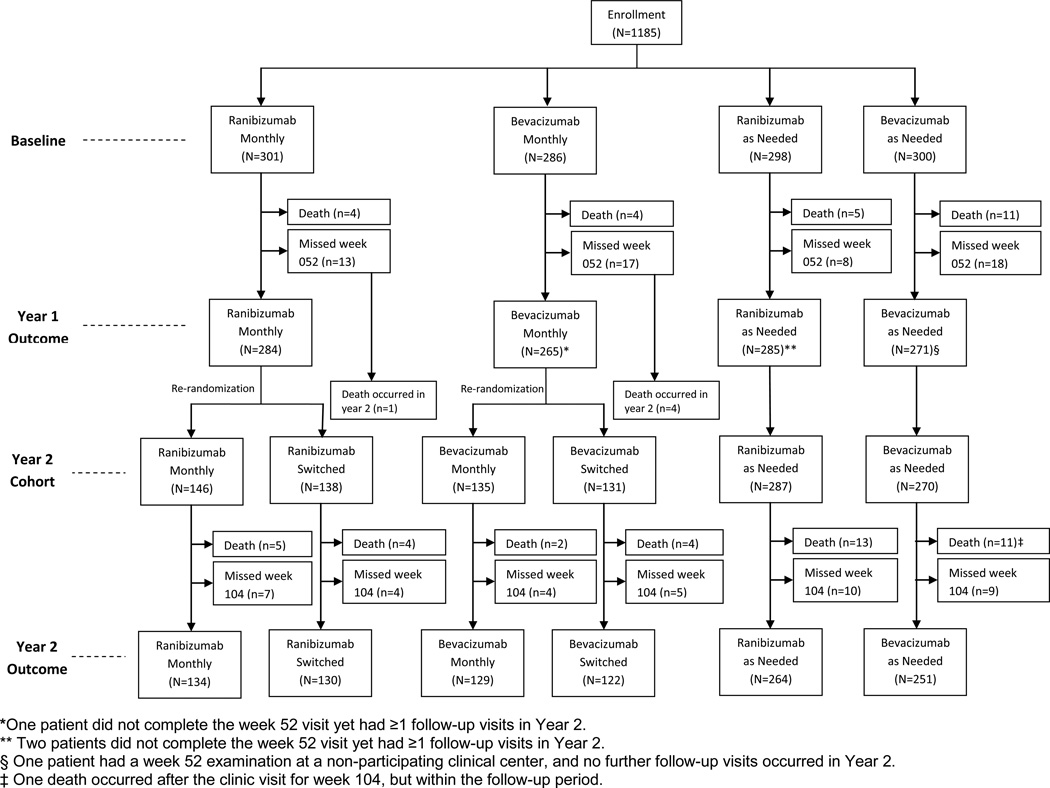
This report includes data available by December 31, 2011. Only the 1107 patients with at least one visit completed in a CATT center between weeks 52 and 104, inclusive, are included in efficacy analyses while all 1185 patients enrolled through 43 centers are included in safety analyses (Figure 1). Statistical computations were performed with SAS 9.2.
Figure 1.
Flow diagram of patient participation.
RESULTS
Patients and Treatment
At enrollment, there were no substantial imbalances in demographic or ocular characteristics among the six treatment groups (Table 1). Two years after enrollment, visual acuity scores were available for 1030 (93.0%) of 1107 patients. Missed visit rates at 2 years were similar across treatment groups (3.0 to 5.0%). Additional information on follow-up may be found in the Appendix 2, available at http://aaojournal.org).
Table 1.
Characteristics at Enrollment by Treatment Group
| Drug | Ranibizumab | Bevacizumab | Ranibizumab | Bevacizumab | Ranibizumab | Bevacizumab | ||||||
|---|---|---|---|---|---|---|---|---|---|---|---|---|
| Year 1 Regimen | Monthly | Monthly | As Needed | As Needed | Monthly | Monthly | ||||||
| Year 2 Regimen | Monthly | Monthly | As Needed | As Needed | As Needed | As Needed | ||||||
| Characteristic | N=146 | N=135 | N=287 | N=270 | N=138 | N=131 | ||||||
| Age - no. (%) | ||||||||||||
| 50–59 yr | 0 | (0.0) | 0 | (0.0) | 6 | (2.1) | 2 | (0.7) | 2 | (1.4) | 1 | (0.8) |
| 60–69 yr | 18 | (12.3) | 17 | (12.6) | 31 | (10.8) | 31 | (11.5) | 14 | (10.1) | 10 | (7.6) |
| 70–79 yr | 44 | (30.1) | 38 | (28.1) | 113 | (39.4) | 98 | (36.3) | 55 | (39.9) | 39 | (29.8) |
| 80–89 yr | 72 | (49.3) | 68 | (50.4) | 118 | (41.1) | 126 | (46.7) | 57 | (41.3) | 72 | (55.0) |
| ≥90 yr | 12 | (8.2) | 12 | (8.9) | 19 | (6.6) | 13 | (4.8) | 10 | (7.2) | 9 | (6.9) |
| Mean (SD*)- yr | 79.5 | (7.4) | 79.7 | (7.5) | 78.3 | (7.8) | 78.9 | (7.4) | 78.8 | (7.5) | 80.4 | (7.1) |
| Sex - no. (%) | ||||||||||||
| Female | 90 | (61.6) | 82 | (60.7) | 179 | (62.4) | 166 | (61.5) | 82 | (59.4) | 86 | (65.6) |
| Male | 56 | (38.4) | 53 | (39.3) | 108 | (37.6) | 104 | (38.5) | 56 | (40.6) | 45 | (34.4) |
| Race - no. (%) | ||||||||||||
| White | 143 | (97.9) | 132 | (97.8) | 285 | (99.3) | 264 | (97.8) | 137 | (99.3) | 130 | (99.2) |
| Other | 3 | (2.1) | 3 | (2.2) | 2 | (0.7) | 6 | (2.2) | 1 | (0.7) | 1 | (0.8) |
| Past medical history – no. (%) | ||||||||||||
| Myocardial infarction | 15 | (10.3) | 16 | (11.9) | 28 | (9.8) | 33 | (12.2) | 17 | (12.3) | 19 | (14.5) |
| Stroke | 6 | (4.1) | 7 | (5.2) | 22 | (7.7) | 16 | (5.9) | 7 | (5.1) | 9 | (6.9) |
| Transient ischemic attack | 8 | (5.5) | 12 | (8.9) | 11 | (3.8) | 17 | (6.3) | 4 | (2.9) | 11 | (8.4) |
| Hypertension | ||||||||||||
| Normal | 29 | (19.9) | 35 | (25.9) | 60 | (20.9) | 59 | (21.9) | 34 | (24.6) | 34 | (26.0) |
| Suspect | 15 | (10.3) | 7 | (5.2) | 32 | (11.1) | 15 | (5.6) | 7 | (5.1) | 13 | (9.9) |
| Definite | 102 | (69.9) | 93 | (68.9) | 195 | (67.9) | 196 | (72.6) | 97 | (70.3) | 84 | (64.1) |
| Visual-acuity score and Snellen equivalent, no. (%) | ||||||||||||
| 68–82 letters, 20/25–40 | 47 | (32.2) | 42 | (31.1) | 113 | (39.4) | 92 | (34.1) | 61 | (44.2) | 44 | (33.6) |
| 53–67 letters, 20/50–80 | 55 | (37.7) | 60 | (44.4) | 102 | (35.5) | 110 | (40.7) | 36 | (26.1) | 51 | (38.9) |
| 38–52 letters, 20/100–160 | 31 | (21.2) | 22 | (16.3) | 58 | (20.2) | 53 | (19.6) | 30 | (21.7) | 29 | (22.1) |
| 23–37 letters, 20/200–320 | 13 | (8.9) | 11 | (8.2) | 14 | (4.9) | 15 | (5.6) | 11 | (8.0) | 7 | (5.3) |
| Mean (SD*) | 59.9 | (14.2) | 60.2 | (13.6) | 61.6 | (13.1) | 60.6 | (13.0) | 60.9 | (14.3) | 60.4 | (12.4) |
| Total thickness at fovea -- µm | ||||||||||||
| Mean (SD) | 460 | (190) | 462 | (205) | 462 | (195) | 459 | (173) | 462 | (184) | 471 | (185) |
| Retinal thickness plus subfoveal-fluid thickness at fovea -- µm | ||||||||||||
| Mean (SD) | 254 | (127) | 249 | (117) | 248 | (124) | 251 | (116) | 251 | (119) | 253 | (114) |
| Foveal center involvement -- no. (%) | ||||||||||||
| Choroidal neovascularization | 81 | (55.5) | 65 | (48.1) | 169 | (58.9) | 159 | (58.9) | 87 | (63.0) | 79 | (60.3) |
| Fluid | 45 | (30.8) | 42 | (31.1) | 76 | (26.5) | 67 | (24.8) | 34 | (24.6) | 31 | (23.7) |
| Hemorrhage | 10 | (6.8) | 12 | (8.9) | 23 | (8.0) | 24 | (8.9) | 8 | (5.8) | 11 | (8.4) |
| Other | 9 | (6.2) | 11 | (8.1) | 14 | (4.9) | 18 | (6.7) | 8 | (5.8) | 8 | (6.1) |
| Not possible to grade | 1 | (0.7) | 5 | (3.7) | 5 | (1.7) | 2 | (0.7) | 1 | (0.7) | 2 | (1.5) |
SD is standard deviation
Treatment decisions by ophthalmologists in year 2 were consistent with the identification of fluid on OCT scans by the reading center for 3337 (68.5%) of 4872 examinations in the ranibizumab-as-needed groups and 3190 (69.6%) of 4583 examinations in the bevacizumab-as-needed groups. Ninety-five percent of inconsistencies were instances of missed treatments; i.e., the OCT reading center detected fluid and the patient was not treated. The proportions consistent on spectral domain OCT scans (1442 {70.1%} of 2058) and on time domain OCT scans (5085 {68.7%} of 7397) were similar (p=0.22). During year 2, ophthalmologists reported knowing the identity of the assigned drug in 66 (0.5%) of 12,645 evaluations for treatment (9 patients assigned to ranibizumab and 2 patients assigned to bevacizumab). During an exit interview, 252 (48.0%) of 525 patients assigned to ranibizumab and 124 (24.8%) of 500 patients assigned to bevacizumab responded that they knew which drug had been used to treat their study eye and then correctly identified the drug. Few (<3%) patients said they knew the drug and identified the incorrect drug.
Change in Visual Acuity in Patients Treated with the Same Dosing Regimen for 2 Years
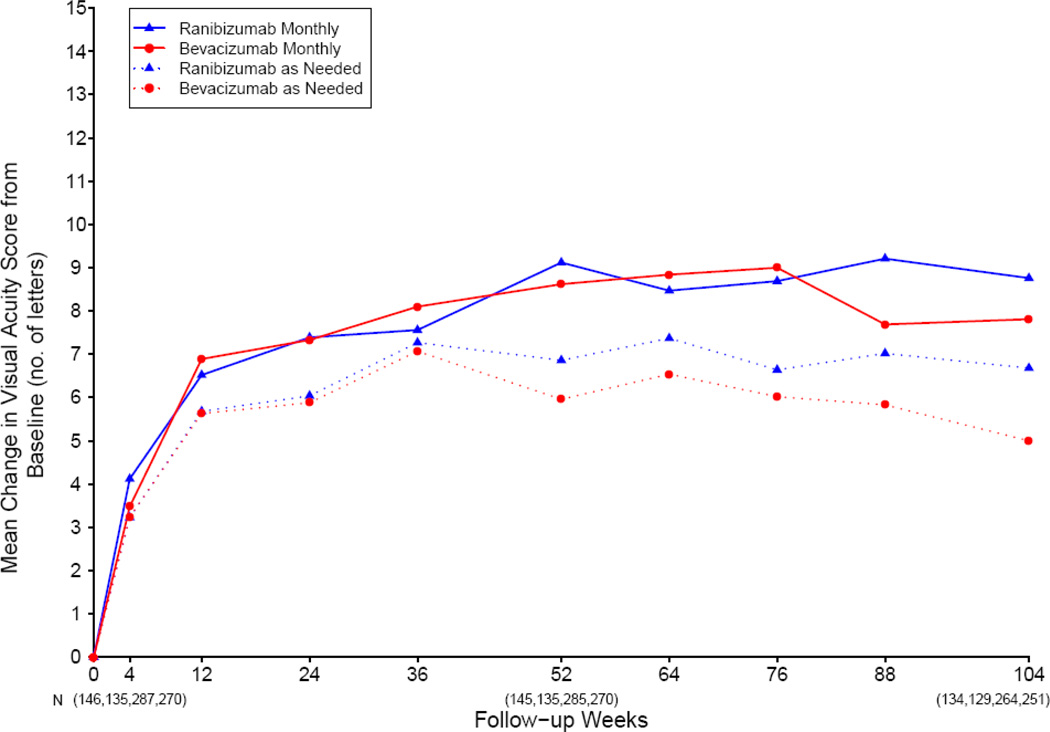
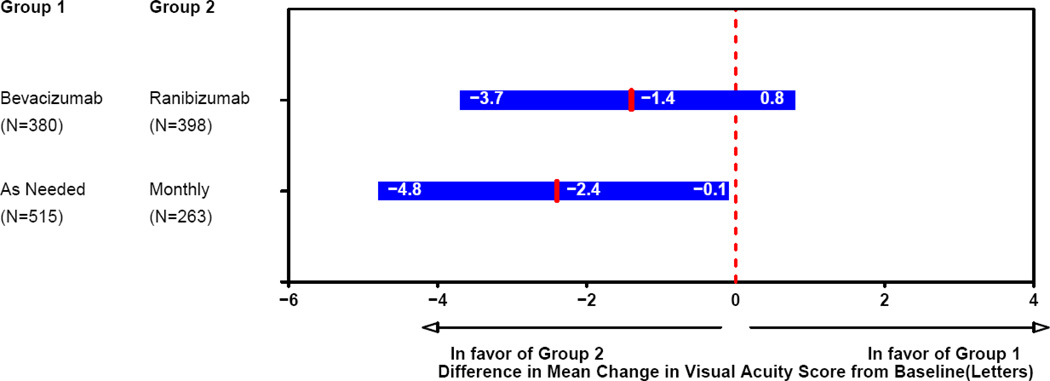
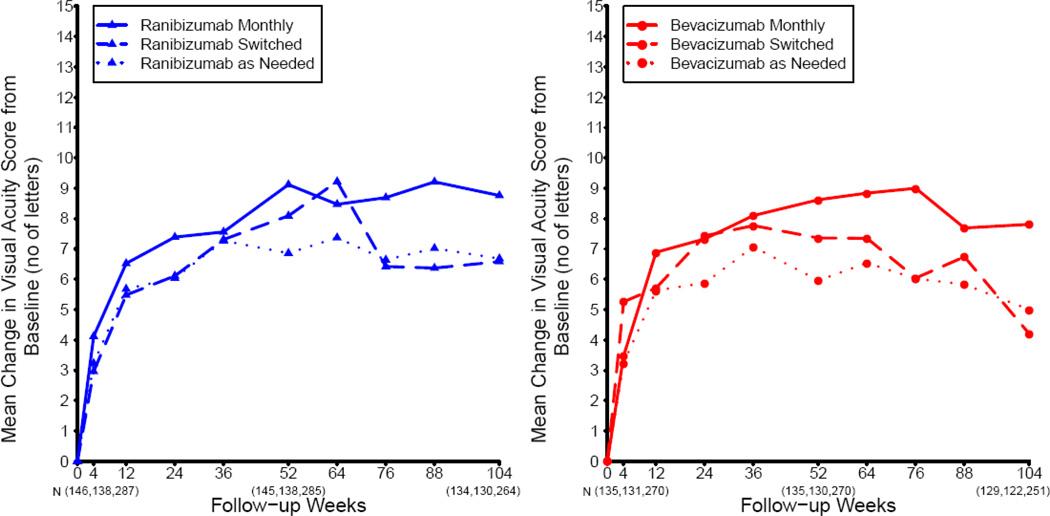
Most of the change in mean visual acuity occurred during year 1, with relatively little change during year 2 (Figure 2). At 2 years, the mean increase in letters of visual acuity from baseline was 8.8 in the ranibizumab-monthly group, 7.8 in the bevacizumab-monthly group, 6.7 in the ranibizumab-as-needed group, and 5.0 in the bevacizumab-as-needed group to (Table 2; drug p=0.21, regimen p=0.046). The difference in mean improvement for patients treated with bevacizumab relative to those treated with ranibizumab was −1.4 letters (95% confidence interval (CI): [−3.7, 0.8]); Figure 3). The difference in mean improvement for patients treated by an as-needed regimen relative to those treated monthly was −2.4 letters (CI: [−4.8, −0.1]). The results of the above analyses were similar after application of alternative methods for handling missing visual acuity data at 2 years. After adjusting for baseline predictors of visual acuity in a multivariable longitudinal regression model, the estimated change in visual acuity, averaged over 2 years of follow-up, was 0.7 letters better for ranibizumab (CI: [−0.9, 2.3]; p=0.41) and 1.7 letters better for patients treated monthly (CI: [−0.1, 3.4]; p=0.07).
Figure 2.
Patients treated with the same dosing regimen for 2 years: mean change in visual acuity from enrollment, over time.
Table 2.
Outcomes at Two Years - Patients Treated with the Same Dosing Regimen for 2 Years
| Ranibizumab | Bevacizumab | Ranibizumab | Bevacizumab | |||||||
|---|---|---|---|---|---|---|---|---|---|---|
| Monthly | Monthly | as Needed | as Needed | P | ||||||
| Outcome | N=134 | N=129 | N=264 | N=251 | Drug | Regimen | ||||
| Visual acuity score, letters, Snellen equivalent, no. (%) | ||||||||||
| 83–97, 20/12–20 | 24 | (17.9) | 17 | (13.2) | 44 | (16.7) | 35 | (13.9) | ||
| 68–82, 20/25–40 | 67 | (50.0) | 61 | (47.3) | 123 | (46.6) | 121 | (48.2) | ||
| 53–67, 20/50–80 | 23 | (17.2) | 31 | (24.0) | 59 | (22.3) | 46 | (18.3) | ||
| 38–52, 20/100–160 | 11 | ( 8.2) | 14 | (10.9) | 23 | ( 8.7) | 28 | (11.2) | ||
| ≤37, ≤20/200 | 9 | ( 6.7) | 6 | ( 4.7) | 15 | ( 5.7) | 21 | ( 8.4) | ||
| Mean letters (SD)* | 68.5 | (18.9) | 68.2 | (16.1) | 68.5 | (15.3) | 66.0 | (19.9) | 0.17 | 0.41 |
| Change in visual acuity score, from baseline, letters, no. (%) | ||||||||||
| ≥ 15 increase | 44 | (32.8) | 41 | (31.8) | 81 | (30.7) | 71 | (28.3) | ||
| 5–14 increase | 49 | (36.6) | 36 | (27.9) | 78 | (29.5) | 79 | (31.5) | ||
| ≤ 4 change | 22 | (16.4) | 31 | (24.0) | 62 | (23.5) | 49 | (19.5) | ||
| 5–14 decrease | 10 | ( 7.5) | 11 | ( 8.5) | 24 | ( 9.1) | 23 | ( 9.2) | ||
| ≥ 15 decrease | 9 | ( 6.7) | 10 | ( 7.8) | 19 | ( 7.2) | 29 | (11.6) | ||
| Mean (SD) | 8.8 | (15.9) | 7.8 | (15.5) | 6.7 | (14.6) | 5.0 | (17.9) | 0.21 | 0.046 |
| Mean (SD) no. treatments, 2 years | 22.4 | (3.9) | 23.4 | (2.8) | 12.6 | (6.6) | 14.1 | (7.0) | 0.01† | -- |
| Mean cost of drug/patient | $44,800 | $1,170 | $25,200 | $705 | ||||||
| Total thickness at fovea, µm | ||||||||||
| Mean (SD)** | 267 | (143) | 274 | (137) | 293 | (129) | 306 | (134) | 0.26 | 0.005 |
| Mean Change(SD) from baseline*** | −190 | (172) | −180 | (196) | −166 | (190) | −153 | (189) | 0.38 | 0.08 |
| Retinal thickness and subfoveal fluid thickness, µm | ||||||||||
| Mean (SD)** | 162 | (81) | 166 | (79) | 167 | (75) | 169 | (83) | 0.63 | 0.53 |
| Mean Change(SD) from baseline*** | −91 | (152) | −84 | (133) | −78 | (131) | −84 | (145) | 0.86 | 0.54 |
| Fluid on optical coherence tomography, no. (%) | ||||||||||
| None | 61 | (45.5) | 39 | (30.2) | 59 | (22.3) | 35 | (13.9) | 0.0003 | <0.0001 |
| Present | 69 | (51.5) | 87 | (67.4) | 198 | (75.0) | 212 | (84.5) | ||
| Unknown/missing | 4 | ( 3.0) | 3 | ( 2.3) | 7 | ( 2.7) | 4 | ( 1.6) | ||
| Dye leakage on angiogram, no. (%) | ||||||||||
| None | 102 | (76.1) | 97 | (75.2) | 183 | (69.3) | 161 | (64.1) | 0.24 | 0.002 |
| Present | 24 | (17.9) | 27 | (20.9) | 75 | (28.4) | 81 | (32.3) | ||
| Unknown/missing | 8 | ( 6.0) | 5 | ( 3.9) | 6 | ( 2.3) | 9 | ( 3.6) | ||
| Area of lesion, mm2 | ||||||||||
| Mean (SD)‡ | 6.7 | (7.8) | 7.8 | (8.5) | 8.5 | (7.4) | 8.6 | (8.3) | 0.44 | 0.04 |
| Mean Change (SD) from baseline‡‡ | −0.4 | (6.8) | 1.6 | (5.9) | 1.9 | (6.5) | 3.0 | (7.0) | 0.006 | 0.0003 |
| Geographic atrophy±, no. (%) | ||||||||||
| None | 90 | (70.3) | 99 | (80.5) | 205 | (84.0) | 200 | (85.8) | 0.13 | 0.007 |
| Non-foveal | 27 | (21.1) | 17 | (13.8) | 28 | (11.5) | 20 | ( 8.6) | ||
| Foveal | 6 | ( 4.7) | 5 | ( 4.1) | 9 | ( 3.7) | 10 | ( 4.3) | ||
| Unknown/missing | 5 | ( 3.9) | 2 | ( 1.6) | 2 | ( 0.8) | 3 | ( 1.3) | ||
SD is standard deviation
Number in each group unknown or missing: 3, 3, 3, 1;
Number in each group unknown or missing: 3, 3, 6, 2;
Includes choroidal neovascularization, hemorrhage, blocked fluorescence, serous pigment epithelium detachment, scar, geographic atrophy, non-geographic atrophy or tear of the retinal pigment epithelium, adjacent to the location of choroidal neovascularization at baseline Number in each group unknown or missing: 12, 8, 16, 18;
Number in each group unknown or missing: 16, 12, 22, 27;
Comparison restricted to as-needed groups
Areas of hypopigmentation or hyperfluorescence of ≥250μ diameter having ≥2 of the following characteristics: circular shape, sharp borders, visible choroidal vessels. Areas meeting this definition surrounding a scar were not considered geographic atrophy. Excluded those with geographic atrophy at enrollment: 6 (4.4%), 6 (4.7%), 20 (7.8%), 18 (7.2%)
Figure 3.
Patients treated with the same dosing regimen for 2 years: differences in mean change in visual acuity at 2 years and 95% confidence intervals.
Secondary Outcomes in Patients Treated with the Same Dosing Regimen for 2 Years
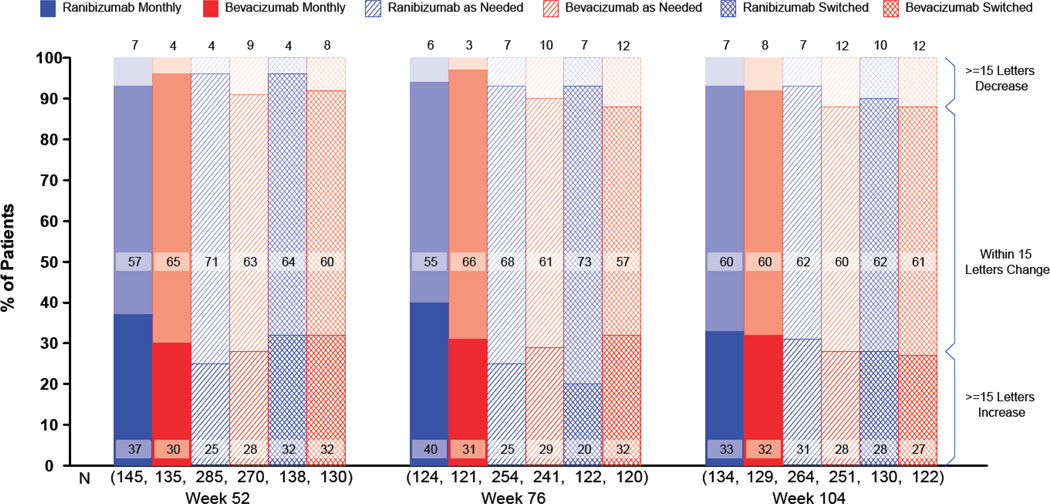
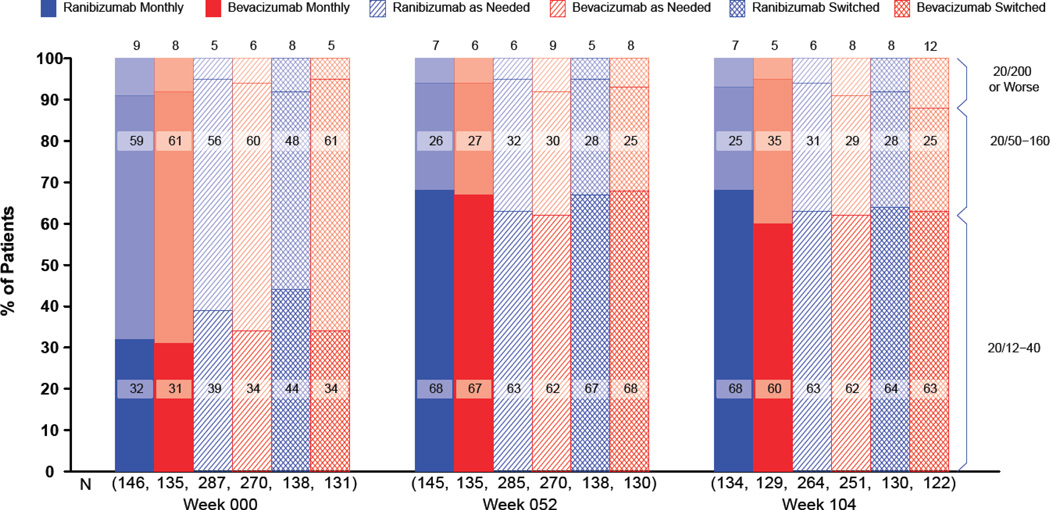
At 2 years, the proportions of patients without a decrease in vision of ≥15 letters were similar, ranging from 88.4% for the bevacizumab-as-needed group to 93.3% for the ranibizumab-monthly group (Figure 4; Table 2 p=0.24). The mean visual acuity at 2 years was similar among the 4 treatment groups with an approximate Snellen equivalent of 20/40 (drug p=0.17, regimen p=0.41). The proportions with 20/20 or better visual acuity and with 20/200 or worse were also similar among the treatment groups (Figure 5). The mean (standard deviation) number of injections through year 2 in the as-needed groups, out of a maximum of 26, was 12.6 (6.6) for patients treated with ranibizumab and 14.1 (7.0) for those treated with bevacizumab (p=0.01). The estimated 2-year drug cost per patient varied from $705 in the bevacizumab-as-needed group to $44,800 in the ranibizumab-monthly group.
Figure 4.
3-Line change in visual acuity from enrollment by treatment group and follow-up time.
Figure 5.
Visual acuity by treatment group and follow-up time.
At 2 years, mean retinal thickness was 29 µm less in patients treated monthly than in patients treated with an as-needed regimen (regimen p=0.005). The proportion of patients without fluid on OCT ranged from 13.9% in the bevacizumab-as-needed group to 45.5% in the ranibizumab-monthly group (drug p=0.0003; regimen p<0.0001). Fluorescein dye leakage was absent in a higher percentage of patients treated monthly than in patients treated as needed (regimen p=0.002). The mean change in lesion area from baseline ranged from −0.4 mm2 for the ranibizumab-monthly group to 3.0 mm2 for the bevacizumab-as-needed group (drug p = 0.006; regimen p=0.0003). Most of the increase in mean lesion area occurred during year 2. The proportion of study eyes with geographic atrophy at 2 years among eyes without apparent geographic atrophy at enrollment, ranging from 25.8% in the ranibizumab-monthly group to 12.9% in the bevacizumab-as-needed group, was greater among patients treated monthly (p=0.007).
Outcomes among Patients with Dosing Regimen Reassigned at 1 Year
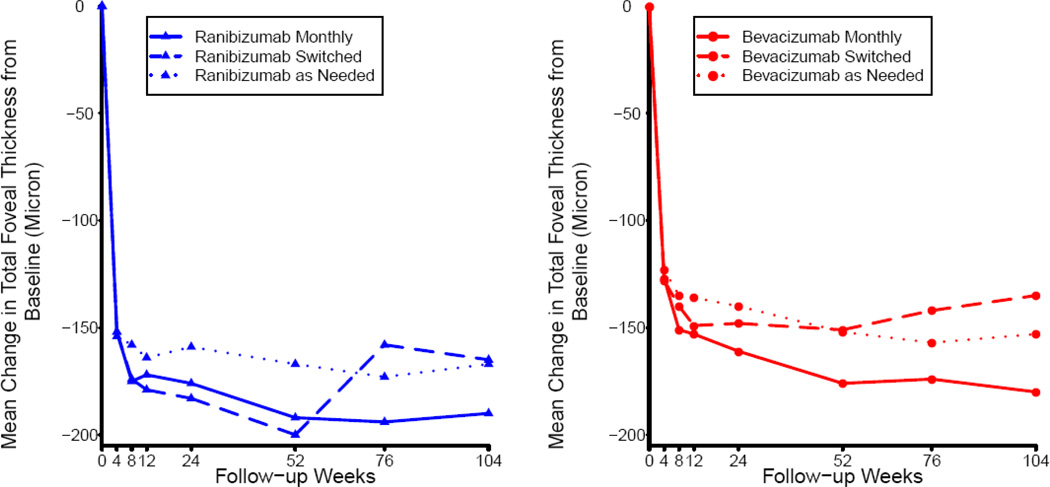
The mean visual acuity among patients assigned to continue monthly treatment changed little during Year 2, while the mean changes in the groups switched from monthly to treatment as needed were −1.8 letters in ranibizumab-treated patients and −3.6 letters in bevacizumab-treated patients (Table 3; regimen p=0.03). For both drugs, mean change in visual acuity at 2 years was similar in the as-needed groups and the groups that switched from monthly to as-needed treatment (Figures 4, 6). Among switched patients, the mean number of injections was 5.0 for ranibizumab-treated patients and 5.8 for bevacizumab-treated patients (p=0.11). The mean total retinal thickness in monthly-treated patients changed little but increased in the switched patients (ranibizumab, +31µm; bevacizumab +19 µm) (regimen p=0.0004; Figure 7). The proportions of patients without fluid on OCT were similar in the two switched groups (19.2% for ranibizumab; 18.0% for bevacizumab) and substantially higher in the bevacizumab-monthly (30.2%) and ranibizumab-monthly (45.5%) groups (drug p=0.03; regimen p<0.0001).
Table 3.
Outcomes at Two Years - Patients Whose Dosing Regimen Was Re-assigned at 1 Year
| --------Ranibizumab------- | ---------- Bevacizumab -------- | |||||||||
|---|---|---|---|---|---|---|---|---|---|---|
| Monthly | Switched | Monthly | Switched | P | ||||||
| Outcome | N=134 | N=130 | N=129 | N=122 | Drug | Regimen | ||||
| Visual acuity score, letters Snellen equivalent, no. (%) | ||||||||||
| 83–97, 20/12–20 | 24 | (17.9) | 22 | (16.9) | 17 | (13.2) | 23 | (18.9) | ||
| 68–82, 20/25–40 | 67 | (50.0) | 61 | (46.9) | 61 | (47.3) | 54 | (44.3) | ||
| 53–67, 20/50–80 | 23 | (17.2) | 23 | (17.7) | 31 | (24.0) | 19 | (15.6) | ||
| 38–52, 20/100–160 | 11 | (8.2) | 13 | (10.0) | 14 | (10.9) | 11 | (9.0) | ||
| ≤37, ≤20/200 | 9 | (6.7) | 11 | (8.5) | 6 | (4.7) | 15 | (12.3) | ||
| Mean letters (SD*) | 68.5 | (18.9) | 67.7 | (18.5) | 68.2 | (16.1) | 65.0 | (21.8) | 0.39 | 0.23 |
| Change in visual acuity score, from 1 year, letters, no. (%)§ | ||||||||||
| ≥ 15 increase | 4 | (3.0) | (4.6) | (4.6) | 8 | (6.2) | 2 | (1.7) | ||
| 5–14 increase | 34 | (25.6) | (14.6) | (14.6) | 21 | (16.3) | 17 | (14.0) | ||
| ≤ 4 change | 58 | (43.6) | 66 | (50.8) | 63 | (48.8) | 61 | (50.4) | ||
| 5–14 decrease | 28 | (21.1) | 27 | (20.8) | 27 | (20.9) | 26 | (21.5) | ||
| ≥ 15 decrease | 9 | (6.8) | 12 | (9.2) | 10 | (7.8) | 15 | (12.4) | ||
| Mean (SD) | −0.3 | (11.1) | −1.8 | (11.2) | −0.6 | (10.3) | −3.6 | (12.1) | 0.29 | 0.03 |
| Mean no. of treatments, Year 2 | ||||||||||
| Mean (SD) | 10.5 | (3.1) | 5.0 | (3.8) | 11.3 | (2.3) | 5.8 | (4.4) | 0.11† | -- |
| Cost of drug/patient | $21,000 | $10,000 | $565 | $290 | ||||||
| Total thickness at fovea, µm | ||||||||||
| Mean (SD)** | 267 | (143) | 295 | (135) | 274 | (137) | 334 | (190) | 0.09 | 0.001 |
| Mean Change(SD) from1 year*** | 1 | (78) | 31 | (78) | −9 | (94) | 19 | (114) | 0.18 | 0.0004 |
| Retinal thickness and subfoveal fluid thickness, µm | ||||||||||
| Mean (SD)** | 162 | (81) | 162 | (63) | 166 | (79) | 189 | (116) | 0.04 | 0.14 |
| Mean Change(SD) from 1 year*** | 12 | (51) | 10 | (46) | −5 | (61) | 16 | (92) | 0.35 | 0.12 |
| Fluid on optical coherence tomography | ||||||||||
| None | 61 | (45.5) | 25 | (19.2) | 39 | (30.2) | 22 | (18.0) | 0.03 | <0.0001 |
| Present | 69 | (51.5) | 100 | (76.9) | 87 | (67.4) | 97 | (79.5) | ||
| Unknown/missing | 4 | (3.0) | 5 | (3.8) | 3 | (2.3) | 3 | (2.5) | ||
| Dye leakage on angiogram | ||||||||||
| None | 102 | (76.1) | 88 | (67.7) | 97 | (75.2) | 80 | (65.6) | 0.59 | 0.01 |
| Present | 24 | (17.9) | 37 | (28.5) | 27 | (20.9) | 36 | (29.5) | ||
| Unknown/missing | 8 | (6.0) | 5 | (3.8) | 5 | (3.9) | 6 | (4.9) | ||
| Area of lesion, mm2 | ||||||||||
| Mean (SD)‡ | 6.7 | (7.8) | 9.0 | (8.1) | 7.8 | (8.5) | 8.2 | (7.8) | 0.80 | 0.06 |
| Mean Change (SD) from 1 year‡‡ | 0.7 | (4.5) | 1.7 | (5.3) | 1.1 | (4.0) | 1.8 | (5.7) | 0.63 | 0.08 |
| Geographic atrophy±, no. (%) | ||||||||||
| None | 90 | (70.3) | 97 | (80.8) | 99 | (80.5) | 97 | (86.7) | 0.05 | 0.02 |
| Non-foveal | 27 | (21.1) | 16 | (13.3) | 17 | (13.8) | 6 | ( 5.4) | ||
| Foveal | 6 | ( 4.7) | 4 | ( 3.3) | 5 | ( 4.1) | 6 | ( 5.4) | ||
| Unknown/missing | 5 | ( 3.9) | 3 | ( 2.5) | 2 | ( 1.6) | 3 | ( 2.7) | ||
SD is standard deviation
Number in each group unknown or missing: 1, 0, 0, 1;
Number in each group unknown or missing: 3, 3, 3, 1;
Number in each group unknown or missing: 5, 3, 4, 5;
See Table 1 for definition. Number in each group unknown or missing: 12, 8, 8, 6;
Number in each group unknown or missing: 22, 17, 15, 14.
See Table 1 for definition. Excluded those with geographic atrophy at baseline: 6, 10, 6, 10
Comparison restricted to as-needed groups
Figure 6.
Mean change in visual acuity from enrollment, over time by dosing regimen within drug group.
Figure 7.
Mean change in total foveal thickness from enrollment, over time by dosing regimen within drug group.
Adverse Events
At 2 years, 32 (5.3%) of 599 patients assigned to ranibizumab and 36 (6.1%) of 586 assigned to bevacizumab had died (Table 4; p=0.62). The proportion of patients with arteriothrombotic events was similar in the ranibizumab-treated patients (4.7%) and the bevacizumab-treated patients (5.0%; p=0.89). Venous thrombotic events occurred in 3 (0.5%) of ranibizumab-treated patients and 10 (1.7%) bevacizumab-treated patients (p=0.054).
Table 4.
Adverse Events within 2 Years of Enrollment
| Ranibizumab N=599 |
Bevacizumab N=586 |
||||
|---|---|---|---|---|---|
| Adverse Event Type | n | (%) | n | (%) | P§ |
| Systemic Serious | |||||
| Death-all causes | 32 | (5.3) | 36 | (6.1) | 0.62 |
| Arteriothrombotic events | 28* | (4.7) | 29 | (5.0) | 0.89 |
| Nonfatal stroke | 8 | (1.3) | 8 | (1.4) | 1.00 |
| Nonfatal myocardial infarction | 9 | (1.5) | 7 | (1.2) | 0.80 |
| Vascular death | 12 | (2.0) | 14 | (2.4) | 0.70 |
| Venous thrombotic events | 3 | (0.5) | 10 | (1.7) | 0.054 |
| Hypertension | 3 | (0.5) | 4 | (0.7) | 0.72 |
| One or more serious adverse events | 190 | (31.7) | 234 | (39.9) | 0.004 |
| Previously associated with anti-VEGF treatment‡ | |||||
| Yes | 45 | (7.5) | 62 | (10.6) | 0.07 |
| No | 170 | (28.4) | 202 | (34.5) | 0.02 |
| MedDRA† system organ class** | |||||
| Cardiac disorders | 47 | (7.8) | 62 | (10.6) | 0.11 |
| Infections | 41 | (6.8) | 54 | (9.2) | 0.14 |
| Nervous system disorders | 34 | (5.7) | 36 | (6.1) | 0.81 |
| Injury and procedural complications | 23 | (3.8) | 35 | (6.0) | 0.11 |
| Neoplasms benign and malignant | 27 | (4.5) | 22 | (3.8) | 0.56 |
| Gastrointestinal disorders | 11 | (1.8) | 28 | (4.8) | 0.005 |
| Any other system organ class | 81 | (13.5) | 104 | (17.8) | 0.046 |
| Ocular, Study Eye | |||||
| Endophthalmitis | 4 | (0.7) | 7 | (1.2) | 0.38 |
| Pseudo-endophthalmitis | 1 | (0.3) | 0 | (0.0) | 1.00 |
Fisher’s exact test
One patient had both a nonfatal stroke and a nonfatal myocardial infarction
Arteriothrombotic events, systemic hemorrhage, congestive heart failure, venous thrombotic events, hypertension, vascular death 12,13
Medical Dictionary for Regulatory Activities
Data are listed only for system organ classes with 35 or more events
One or more serious systemic adverse events occurred in 190 (31.7%) of ranibizumab-treated patients and 234 (39.9%) of bevacizumab-treated patients (p=0.004). When patients were grouped according to their originally assigned drug and dosing regimen, the rates continued to diverge in Year 2 (Figure 8). Considering only events occurring in Year 2, 131 (24.4%) of 536 bevacizumab-treated patients and 103 (18.0%) of 571 ranibizumab-treated patients experienced a systemic serious adverse event (p=0.009). After adjustment for demographic features and coexisting illnesses at baseline, the risk ratio for all systemic serious adverse events within two years for bevacizumab was 1.30 (CI: [1.07, 1.57]; p=0.009). Patients treated as needed had higher rates than patients treated monthly (risk ratio1.20; CI: [0.98, 1.47]; p=0.08). When only Year 2 was considered, 182 (22.0%) of 826 patients treated as needed and 52 (18.5%) of 281 patients treated monthly experienced a serious adverse event (p=0.21). After excluding all events previously associated with systemic treatment with anti-VEGF drugs, 170 (28.4%) of ranibizumab-treated patients and 202 (34.5%) of bevacizumab-treated patients had events (p=0.02). The proportion with events was generally higher among bevacizumab-treated patients for each of the MedDRA system organ classes displayed in Table 4 with the exception of benign and malignant neoplasms (p=0.56). Gastrointestinal disorders (e.g., hemorrhage, hernia, nausea/vomiting), occurred in 11 (1.8%) ranibizumab-treated and 28 (4.8%) bevacizumab-treated patients (p=0.005). Endophthalmitis, defined as severe inflammation that was presumed infectious and treated with intravitreal antibiotics, developed in 4 (0.7%) ranibizumab-treated patients and 7 (1.2%) bevacizumab-treated patients (p=0.38); 10 of 11 cases occurred in monthly treated patients.
Figure 8.
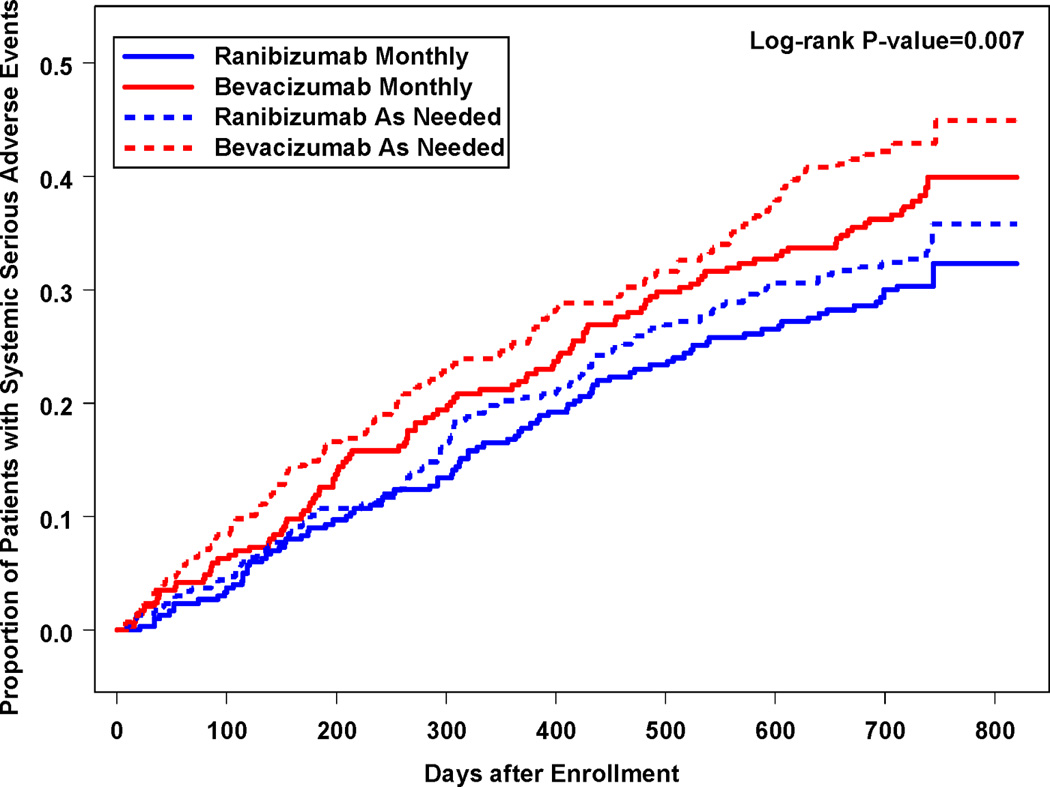
Cumulative proportion of patient with ≥1 systemic serious adverse event by originally assigned dosing regimen and drug.
DISCUSSION
At both one and two years, bevacizumab and ranibizumab had similar effects on visual acuity when the dosing regimen was the same (Figure 2 Tables 2, 3). There was little difference in any visual metric evaluated including mean gain in visual acuity, the proportion of patients who gained three lines, who did not lose three lines, and who achieved 20/40 or better. Mean gains in visual acuity at two years were within 1.4 letters and the difference in vision averaged over the two-year period was 0.7 letters.
Small differences in mean gain in visual acuity emerged between dosing regimens (Table 2). At two years, as-needed dosing of either drug produced 2.4 letters less mean gain than monthly dosing (p=0.046), with the greatest difference (3.8 letters) between ranibizumab monthly and bevacizumab as needed. This may be due to more lesion growth, fluorescein leakage, and residual fluid on OCT in eyes in the as-needed group.
Switching to as-needed dosing after one year of monthly treatment, with either drug, produced a mean 2.2 letter decrease, yielding mean visual acuity nearly equal to that obtained with as-needed dosing for two years (Figure 6). Monthly treatment throughout year 1 did not preserve lesion stability in year 2; total retinal thickness and residual fluid was greater in the patients who switched from monthly to as needed treatment at 2 years than in those who maintained monthly dosing (Table 3). Nonetheless, the magnitude and durability of the therapeutic effect in all six groups is remarkable when one considers the natural history of neovascular AMD and the modest efficacy of treatments prior to bevacizumab and ranibizumab. At 2 years, 60% or more of the patients in all groups had vision 20/40 or better; dramatically better than among patients who were untreated (<10%) or treated (<15%) with modalities available before 2005.13–16
Both drugs substantially and immediately reduced fluid in or under the retina (Figure 7). At one year, more eyes had complete resolution of fluid with ranibizumab than bevacizumab. At two years, differences in mean retinal thickness on OCT and in the proportion of patients with residual fluid remained essentially unchanged from year one, except in patients who switched from monthly to as needed treatment in both drug groups. There were more eyes in the monthly treated groups with no fluid on OCT (dry OCT) at the end of Year 2 than in the as-needed groups, with the highest proportion with a dry OCT found in the ranibizumab monthly treated group. However, the ranibizumab monthly treated group also had the highest proportion that developed geographic atrophy of any of the 6 treatment groups. The development of geographic atrophy was higher in both monthly treated groups than in the as needed groups. This may be important to consider when weighing the risks and benefits of monthly versus as-needed treatment and in the selection of drug. Although most geographic atrophy in CATT was non-foveal through the two-year period of the study, adverse effects on visual function, such as lower reading speed and extension to the foveal center with time, are common in the natural history of geographic atrophy.
The greater prevalence of fluid in the bevacizumab-as-needed group led to an average of 0.6 more injections during the second year than in ranibizumab-as-needed patients, and in an average of 1.5 injections more over a two-year period. Despite the adoption of spectral domain OCT in year 2 with its greater precision in assessing fluid, there was no increase in the agreement between ophthalmologist and reading center on when treatment was required. For both drugs, monthly injection resulted in less growth of CNV than as-needed treatment (Table 2).
Over 2 years, the rates of death, myocardial infarction, and stroke did not differ between drugs. The higher rate of serious adverse events (SAEs) for bevacizumab-treated patients reported in year 1 remained in year 2 with a similar cumulative risk ratio of 1.30. Also as reported for year 1, the risk of SAEs was not higher with monthly treatment relative to as-needed treatment. Among all organ systems, the greatest imbalance was in gastrointestinal disorders. While the number of events is small, this has been an area of concern in previous studies of systemic bevacizumab. When all known VEGF-related SAE’s are excluded, most of the imbalance remains, leaving us uncertain whether this difference was due to chance, imbalances at baseline not captured in multivariate modeling, or truly higher risk. Results from ongoing randomized clinical trials worldwide may provide additional, independent information on the risk of treatment with bevacizumab relative to ranibizumab.
In 2010, ranibizumab accounted for nearly 10% of the entire Medicare part B drug budget, its single largest expenditure.17 As treatment of patients continues indefinitely, the cumulative financial burden to third party payors and patients will only increase. The choice of drug and dosing regimen for patients must balance the comparable effects on vision, the possibility of true differences in adverse events, and the 40-fold difference in cost per dose between ranibizumab and bevacizumab.
Supplementary Material
Acknowledgments
Financial Support: Supported by cooperative agreements U10 EY017823, U10 EY017825, U10 EY017826, and U10 EY017828 from the National Eye Institute, National Institutes of Health, Department of Health and Human Services. The funding organization participated in the design and conduct of the study, data analysis and interpretation, and review of the manuscript.
Footnotes
Publisher's Disclaimer: This is a PDF file of an unedited manuscript that has been accepted for publication. As a service to our customers we are providing this early version of the manuscript. The manuscript will undergo copyediting, typesetting, and review of the resulting proof before it is published in its final citable form. Please note that during the production process errors may be discovered which could affect the content, and all legal disclaimers that apply to the journal pertain.
Writing Committee:
The members of the Comparison of Age-related Macular Degeneration Treatments Trials (CATT) Research Group are listed in Appendix 1 (available at http://aaojournal.org).
This article contains online-only material. The following should appear online-only: Appendix 1 and Appendix 2.
Financial dislosure: Glenn Jaffe, MD has a consultancy relationship with Heidelberg Engineering and active or pending grants from Regeneron. Cynthia Toth, MD has a consultancy relationship with Physical Sciences Incorporated, active or pending grants from Genentech, Bioptigen, and Physical Sciences Incorporated, a patent pending for OCT analysis technology related to analysis for age-related macular degeneration, and royalties from Alcon Laboratories for ophthalmic surgical technologies. Dr. Jaffe’s and Dr. Toth’s institution receives money for these relationships. The other members of the writing committee have no financial relationships to declare.
REFERENCES
- 1.Brown DM, Kaiser PK, Michels M, et al. ANCHOR Study Group. Ranibizumab versus verteporfin for neovascular age-related macular degeneration. N Engl J Med. 2006;355:1432–1444. doi: 10.1056/NEJMoa062655. [DOI] [PubMed] [Google Scholar]
- 2.Rosenfeld PJ, Brown DM, Heier JS, et al. MARINA Study Group. Ranibizumab for neovascular age-related macular degeneration. N Engl J Med. 2006;355:1419–1431. doi: 10.1056/NEJMoa054481. [DOI] [PubMed] [Google Scholar]
- 3.Brechner RJ, Rosenfeld PJ, Babish JD, Caplan S. Pharmacotherapy for neovascular age-related macular degeneration: an analysis of the 100% 2008 Medicare fee-for-service Part B claims file. Am J Ophthalmol. 2011;151:887–895. doi: 10.1016/j.ajo.2010.11.017. [DOI] [PubMed] [Google Scholar]
- 4.CATT Research Group. Ranibizumab and bevacizumab for neovascular age-related macular degeneration. N Engl J Med. 2011;364:1897–1908. doi: 10.1056/NEJMoa1102673. [DOI] [PMC free article] [PubMed] [Google Scholar]
- 5.Office of the Inspector General, Department of Health and Human Services. Review of Medicare Part B Avastin and Lucentis treatments for age-related macular degeneration (A-01-10-00514) [letter] [Accessed February 16, 2012];2011 Sep; Available at: http://oig.hhs.gov/oas/reports/region10/11000514.pdf.
- 6.Antiplatelet Trialists' Collaboration. Collaborative overview of randomized trials of antiplatelet therapy--I: Prevention of death, myocardial infarction, and stroke by prolonged antiplatelet therapy in various categories of patients. BMJ. 1994;308:81–106. [PMC free article] [PubMed] [Google Scholar]
- 7.Rubin DB. Multiple Imputation for Nonresponse in Surveys. New York: Wiley; 1987. pp. 15–22. [Google Scholar]
- 8.Zeger SL, Liang KY. Longitudinal data analysis for discrete and continuous outcomes. Biometrics. 1986;42:121–130. [PubMed] [Google Scholar]
- 9.Cox DR. Regression models and life-tables. J R Stat Soc Ser B. 1972;34:187–220. [Google Scholar]
- 10.Rosenbaum PR, Rubin DB. The central role of the propensity score in observational studies for causal effects. Biometrika. 1983;70:41–55. [Google Scholar]
- 11.Chen HX, Cleck JN. Adverse effects of anticancer agents that target the VEGF pathway. Nat Rev Clin Oncol. 2009;6:465–477. doi: 10.1038/nrclinonc.2009.94. [DOI] [PubMed] [Google Scholar]
- 12.Nalluri SR, Chu D, Keresztes R, et al. Risk of venous thromboembolism with the angiogenesis inhibitor bevacizumab in cancer patients: a meta-analysis. JAMA. 2008;300:2277–2285. doi: 10.1001/jama.2008.656. [DOI] [PubMed] [Google Scholar]
- 13.Macular Photocoagulation Study Group. Laser photocoagulation of subfoveal neovascular lesions of age related macular degeneration: updated findings from two clinical trials. Arch Ophthalmol. 1993;111:1200–1209. doi: 10.1001/archopht.1993.01090090052019. [DOI] [PubMed] [Google Scholar]
- 14.Treatment of Age-related Macular Degeneration With Photodynamic Therapy (TAP) Study Group. Photodynamic therapy of subfoveal choroidal neovascularization in age-related macular degeneration with verteporfin: two-year results of 2 randomized clinical trials--TAP report 2. Arch Ophthalmol. 2001;119:198–207. [PubMed] [Google Scholar]
- 15.Verteporfin in Photodynamic Therapy Study Group. Verteporfin therapy of subfoveal choroidal neovascularization in age-related macular degeneration: two-year results of a randomized clinical trial including lesions with occult with no classic choroidal neovascularization--Verteporfin in Photodynamic Therapy report 2. Am J Ophthalmol. 2001;131:541–560. doi: 10.1016/s0002-9394(01)00967-9. [DOI] [PubMed] [Google Scholar]
- 16.Eyetech Study Group. Anti-vascular endothelial growth factor therapy for subfoveal choroidal neovascularization secondary to age-related macular degeneration: phase II study results. Ophthalmology. 2003;110:979–986. doi: 10.1016/S0161-6420(03)00085-X. [DOI] [PubMed] [Google Scholar]
- 17.United States Senate Special Committee on Aging. Statement of Jonathan Blum, Deputy Administrator and Director, Center for Medicare and Medicaid Services, on sustaining the Medicare program through lower costs, before the United States Senate Special Committee on Aging. [Accessed February 10, 2012];2011 Jul 21; Available at: http://aging.senate.gov/events/hr236jb.pdf.
Associated Data
This section collects any data citations, data availability statements, or supplementary materials included in this article.


