

SUMMARY
Objectives
To determine whether there is an association between geographical areas with greater sexual minority density, defined as gay and lesbian individuals, and incidence and mortality rates for lung cancer.
Study design
As individual surveillance data on sexual orientation are not available, this study used an ecological approach to examine the link between sexual minorities and lung cancer.
Methods
Population-based surveillance data on the incidence of and mortality due to lung cancer from 1996 to 2004 were used from 12 SEER registries and 2000 Census data on same-sex-partnered households for the geographical area covered by SEER 12. Using multiple regression models, the county-level association of sexual minority density with incidence or mortality rates for lung cancer was examined.
Results
A significant positive association was found between both incidence and mortality rates for lung cancer and areas with a higher density of sexual minority men, and a significant negative association was found between both incidence and mortality rates for lung cancer and areas with a higher density of sexual minority women.
Conclusions
In the absence of surveillance data, this novel methodological strategy approximates population-level lung cancer disparities for sexual minority populations at the aggregate level.
Keywords: Homosexuality, Lung cancer, Morbidity, Mortality, Cancer surveillance, Health disparities
Introduction
The existence of a link between smoking and lung cancer was first reported around 1930.1 Since then, smoking has been causally linked to lung cancer. Specifically, it has been stated that there is no risk-free level of smoking and up to 90% of all lung cancers are attributable to smoking.2 Smoking has been linked to lung cancer in all racial and ethnic groups; however, it has also been stated that the higher incidence of lung cancer in African-American men and lower incidence of lung cancer in American Indians is not explained by differences in their smoking rates.3 Other population-based differences in smoking and lung cancer are linked to sex.4 The risk of developing lung cancer is about 23 times higher in male smokers and 13 times higher in female smokers compared with lifelong non-smokers.5,6 The age-adjusted annual incidence of lung cancer is declining steadily in men, but is still higher in men than women.5,6 Women have shown a steady increase in lung cancer over a long period, which has only slowed recently.6,7 These differences in lung cancer between men and women reflect historical changes in smoking, the prevalence of which peaked 20 years later among women compared with men.7
Population groups with higher smoking rates are known to bear a disproportionate amount of the lung cancer burden. One such population group is sexual minorities, defined as gay, lesbian and bisexual individuals. For example, in 2007, the President’s Cancer Panel noted a higher cancer risk for sexual minorities, as smoking among sexual minorities is twice the rate among heterosexual populations, smoking rates of sexual minority youth are as high as those of adults, and these youths tend to start smoking at an earlier age.8 Two recent review articles summarized the evidence on smoking disparities in sexual minorities.9,10 Over a 20-year span from 1987 to 2007, studies using population-based, convenience and cohort data assessed smoking in sexual minorities. One review concluded that among sexual minority women, the odds ratios of tobacco use were between 1.5 and 2.0 compared with heterosexual women, whereas the odds ratios of tobacco use among sexual minority men were between 2.0 and 2.5 compared with heterosexual men.9 Considering a latency period of 15–20 years between smoking and lung cancer, it is reasonable to assume that the higher smoking rates among sexual minorities dating back to the early 1980s9,10 resulted in their higher risk of lung cancer in the early 21st Century. A direct investigation of this hypothesis cannot be performed because cancer registries do not include data on sexual orientation,11 therefore making it impossible to assess the prevalence of lung cancer in sexual minorities. A few studies used registries of human immunodeficiency virus (HIV)-positive populations, which include large proportions of men who have sex with men, to assess the incidence of lung cancer.12–14 While lung cancer is not an acquired immunodeficiency syndrome (AIDS)-defining cancer, the excess of lung cancer documented in studies of HIV-positive populations has been explained by the higher smoking rates in HIV-positive populations and HIV-infected gay men.12–14 Despite the strong and consistent documentation of smoking disparities among sexual minorities, the lack of surveillance data on sexual orientation results in a gap of public health knowledge. This needs to be addressed urgently.
SEER data also lack individual-level information on socio-economic status, which hinders the examination of cancer disparities due to socio-economic status. To fill this information gap, aggregate data on socio-economic status derived from the US Census have been used. The linkage of SEER and census data is complementary and has gained widespread acceptance as a methodology for identifying cancer disparities due to socioeconomic status.15–20 The linkage of SEER and census data was replicated in this study to overcome the lack of individual-level sexual orientation data in SEER using aggregate sexual orientation data from the census.
The US Census does not measure sexual orientation directly; instead, it gathers information on same-sex-partnered households, which has since been used as a surrogate measure of sexual orientation.21–27 While there are a number of concerns, including that census data only represent coupled sexual minorities who are cohabiting and feel comfortable reporting their same-sex-partner status,21,22,28 census-derived same-sex-partnered households has emerged as a premier national data source of sexual minorities that allows the identification of geographical locations where sexual minorities are clustered. For example, some studies successfully conducted population-based studies with sexual minorities after they selected geographical locations that had, according to the census, a high density of same-sex households.26,29 Previously, SEER data and census data have been linked successfully to test the hypothesis that the incidence of breast cancer is higher in geographical areas with more female same-sex-partner households, indicating a positive association between the incidence of breast cancer and areas with a higher density of sexual minority women.25 Furthermore, a significant positive association has been identified between a higher density of sexual minority men and women and the incidence of colorectal cancer, while the mortality rate for colorectal cancer has been positively associated with areas with a higher density of sexual minority men but not women.27 The present study examined the assumed disparity in lung cancer due to sexual orientation, relying on aggregate data on same-sex-partnered households from the 2000 Census.
Methods
The approach of linking SEER and census data at the county level for the purpose of assessing cancer disparities has been described in detail elsewhere.25,27 Therefore, a shortened description of this approach is described here.
Data
The SEER Program is the premier source for cancer statistics in the USA, collecting data on incidence, survival and prevalence from specific geographical areas representing 26% of the US population. Nine years of data were selected, from 1996 to 2004, so the available county-level census data in 2000 represent the midpoint of the study period. These data were derived from 12 SEER registries and represent 215 counties.
2000 Census
The decennial US Census conducted in 2000 is an enumeration of the US population. By combining responses from two questions included in the census, one about the sex of each household member and one about the relationship between each member of the household, which included ‘unmarried partner’ as an answer choice, ‘same-sex-partnered households’30 was identified from the Census Summary File 1 (SF1). However, SF1 does not provide information on the age of household members, which is a major disadvantage for an interest in the relationship between sexual orientation and lung cancer, an age-dependent disease. In order to control for the potential confounding effect of age, the exposure variable used was age-specific sexual minority density. The distribution of same-sex partners across age groups was obtained using the 5% Public Use Microdata Sample (PUMS) of Census 2000. Summary File 3 (SF3) was used to obtain estimates on socio-economic status at the county level.
Measures
The outcomes of interest were sex-specific incidence and mortality rates for lung cancer, which were obtained from SEER. The sample was limited to men and women aged ≥18 years with new, primary diagnoses of lung cancer and all deaths due to lung cancer that were recorded for 1996–2004, recording each woman’s and man’s age, race, year of diagnosis, year of death and county of residence from SEER. In total, 89,741 new cases of lung cancer were diagnosed in men and 68,637 new cases of lung cancer were diagnosed in women within the 12 SEER registries. For men, 95 males under 18 years of age (0.10%) and eight (0.01%) subjects of unknown age were excluded; for women, 86 females under 18 years of age (0.13%) and four (0.01%) subjects of unknown age were excluded. Over the same period (1996–2004), 78,593 deaths due to lung cancer were reported in men and 60,908 deaths due to lung cancer were reported in women in the 12 SEER registries. Counts of incidence of and mortality due to lung cancer were classified into one of 11 age categories (18–24, 25–29, 30–34, 35–39, 40–44, 45–49, 50–54, 55–59, 60–64, 65–69 and ≥70 years) and into one of three race groups (White, Black or other). All incidence and mortality rates for lung cancer were calculated using the total female and male population aged ≥18 years in each county, and age adjusted using the 11 age groups listed above and the 2000 US Standard Million.31
The main independent variable was derived from the 2000 Census data on same-sex-partnered households, a surrogate for individual sexual orientation data. These data were aggregated at the county level, expressing either the number of females or males living in a same-sex-partnered relationship within a household in relation to the female or male adult population of the county. This aggregate variable was called ‘sexual minority women density’ (SMWD) or ‘sexual minority men density’ (SMMD) because it expresses the variation in the density with which resident sexual minority women or men report at the county level. To make these data age specific, the distribution of sexual minority women, defined as women who live in female same-sex-partnered households, was obtained across different age groups from the PUMS data, and this information was combined with the county-level SMWD. The same calculations were performed for men. Due to the small samples of PUMS at the individual county level, PUMS data across the 215 counties in the SEER registry were aggregated and the SWMD or SMMD weight for each age group was computed as:
Due to a strong association between socio-economic status and lung cancer,32 models were adjusted for socio-economic status. Poverty was adjusted for in order to maintain consistent methodology with a previous study on breast and colorectal cancer.25 Poverty level was defined as the percentage of the population living under the Federal poverty level, which has been found to be the most consistent and easily interpretable variable that accurately measures socio-economic disparities in health outcomes.20,33 However, for this study of lung cancer, a further adjustment was made for education, which represents an innovation from the previously established methodology.25 It was reasoned that the inclusion of education was warranted, given earlier findings that men and women with less than a high-school education have higher rates of lung cancer compared with their college-educated counterparts.32 Moreover, smoking is the most common cause of lung cancer. Smoking rates are significantly higher in the least educated population, and this group’s smoking rates remained fairly stable over the 9 years of data (1996–2004),34 providing further evidence for the inclusion of education as an additional confounder, defined as the percentage of the population with high-school and higher education.
Statistical analysis
The county-level association of SMWD or SMMD with the incidence or mortality rates for lung cancer was examined using multiple regression models. All models included SEER registry, race and socio-economic status as fixed effects. The process for model selection used a combination of residual diagnostics, Akaike Information Criterion and judgement to select models that combined parsimony and interpretability with robust model fit and valid underlying assumptions. Several model formulations and distributional assumptions appropriate for incidence and mortality data were considered, including Poisson and zero-inflated Poisson models as well as negative binomial alternatives. Residual plots were then examined to assess the validity of the distributional assumptions. The estimated regression coefficients were estimated from these models after exponentiation as incidence rate ratios or mortality rate ratios, respectively. SAS Version 9.1.3 (SAS Institute Inc, Cary NC, USA) was used for all analyses.
Results
The accumulated incidence rates of lung cancer for men and women from 1996 to 2004 are shown in Table 1. The 12 SEER registries show considerable variation in the number of counties that are captured by each registry, ranging from one (the Los Angeles registry) to 99 counties (the Iowa registry). Overall, the 12 SEER registries include 215 of the 3141 counties across the USA. Similarly, the number of incident cases of lung cancer showed great variation by registry. For men, the lowest incidence of lung cancer was reported by the Rural Georgia registry, whereas the Los Angeles registry reported the greatest number of incident cases. The crude and adjusted incidence rates for men are listed in the fourth and fifth columns of Table 1, respectively. The lowest crude incidence rate for men was reported by the Utah registry (35 cases per 100,000), whereas the highest crude incidence rate was reported by the Rural Georgia registry. Once incidence had been adjusted for age, the lowest incidence rate was reported by the Hawaii registry, and the highest incidence rate was still reported by the Rural Georgia registry. For women, the lowest and highest incidence rates for lung cancer were reported by the same registries as for men: Rural Georgia and Los Angeles, respectively. The highest crude and adjusted incidence rates for women were reported by the Detroit registry. The lowest crude and adjusted incidence rates for women mirrored the results for men, with the lowest crude rate reported by the Utah registry and the lowest adjusted incidence rate reported by the Hawaii registry.
Table 1.
Lung cancer incidence by SEER registry from 1996 to 2004
| Incidence in men | Incidence in women | ||||||
|---|---|---|---|---|---|---|---|
| Registry | Counties | Incident cases | Crude incidence rate per 100,000 | Adjusted incidence rate per 100,000 | Incident cases | Crude incidence rate per 100,000 | Adjusted incidence rate per 100,000 |
| Rural Georgia | 10 | 533 | 142.0 | 142.3 | 230 | 54.5 | 46.7 |
| Hawaii | 5 | 1831 | 44.6 | 47.4 | 1110 | 26.9 | 24.7 |
| New Mexico | 33 | 3910 | 68.4 | 76.2 | 2743 | 45.1 | 43.7 |
| Utah | 29 | 2383 | 35.4 | 50.4 | 1473 | 21.4 | 25.9 |
| San-Jose | 4 | 4104 | 50.5 | 72.3 | 3488 | 43.9 | 48.4 |
| Monterey | |||||||
| Atlanta | 5 | 5864 | 62.1 | 105.4 | 4240 | 42.6 | 56.5 |
| Iowa | 99 | 9948 | 104.4 | 105.4 | 6537 | 64.1 | 53.6 |
| Connecticut | 8 | 10,608 | 96.8 | 101.5 | 8770 | 72.4 | 63.0 |
| Detroit | 3 | 13,078 | 102.9 | 117.4 | 10,414 | 74.1 | 69.9 |
| Seattle | 13 | 10,386 | 76.8 | 95.4 | 8422 | 60.6 | 62.4 |
| San-Francisco-Oakland | 5 | 9579 | 68.1 | 83.6 | 7698 | 52.8 | 52.0 |
| Los Angeles | 1 | 17,414 | 58.0 | 79.1 | 13,422 | 42.4 | 46.6 |
| All 12 registries | 215 | 89,638 | 71.5 | 88.9 | 68,547 | 51.9 | 52.6 |
| 2000 Census (from CDC)a | 3141 | 100,227 | 80.0 | 92.0 | 76,794 | 54.4 | 59.1 |
The Centers for Disease Control and Prevention (CDC) report covers 84% of the population (CDC reference http://apps.nccd.cdc.gov/uscs/Table.aspx?Group=3f&Year=2005&Display=n).
Figure 1 shows the SMMD by registry. On average, the SMMD in the USA is 0.41. Of the 12 registries, only two (Utah and Iowa) were below the national average, indicating that the SMMDs in Utah and Iowa were below the national average.
Figure 1.
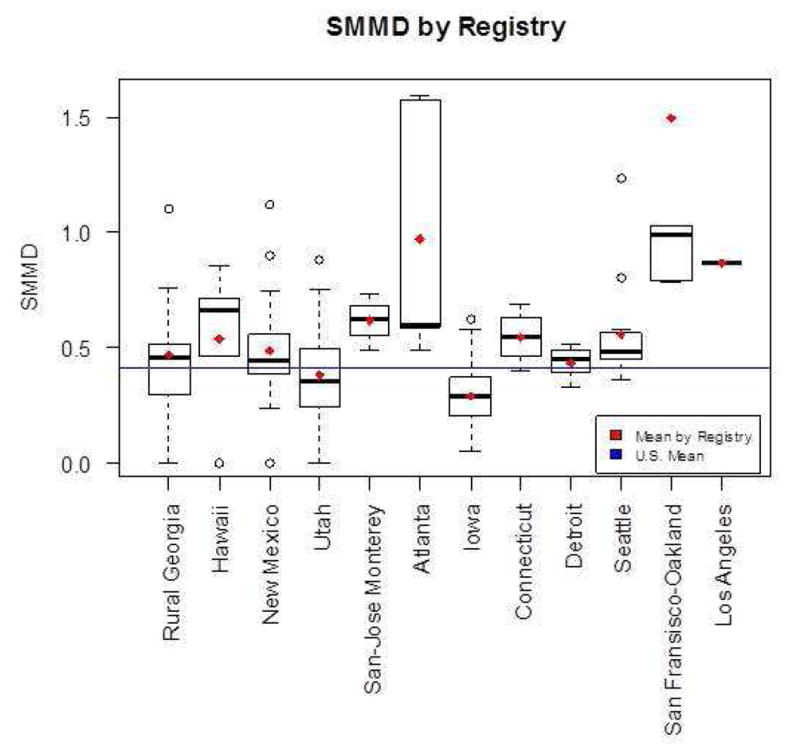
Sexual Minority Men Density by Registry. Plotted means in red and blue are calculated over the counties included in the individual registries or over the entire U.S. respectively. (The bottom and top of the box are the 25th and 75th percentile and the band near the middle of the box is the median. The ends of the whiskers represent the lowest datum still within 1.5 interquartile range (IQR) of the lower quartile, and the highest datum still within 1.5 IQR of the upper quartile. The dotted line represent the range from the lower(higher) quartile to the lowest(highest) datum that is within 1.5 IQR. IQR is the difference between the 75th and the 25th percentile.)
Figure 2 shows the SMWD by registry. The average SMWD for the nation is 0.43. In contrast to the results for men, only eight of the 12 SEER registries (Hawaii, New Mexico, San-Jose Monterey, Atlanta, Connecticut, Seattle, San Francisco and Los Angeles) had an SMWD that was higher than the national average.
Figure 2.
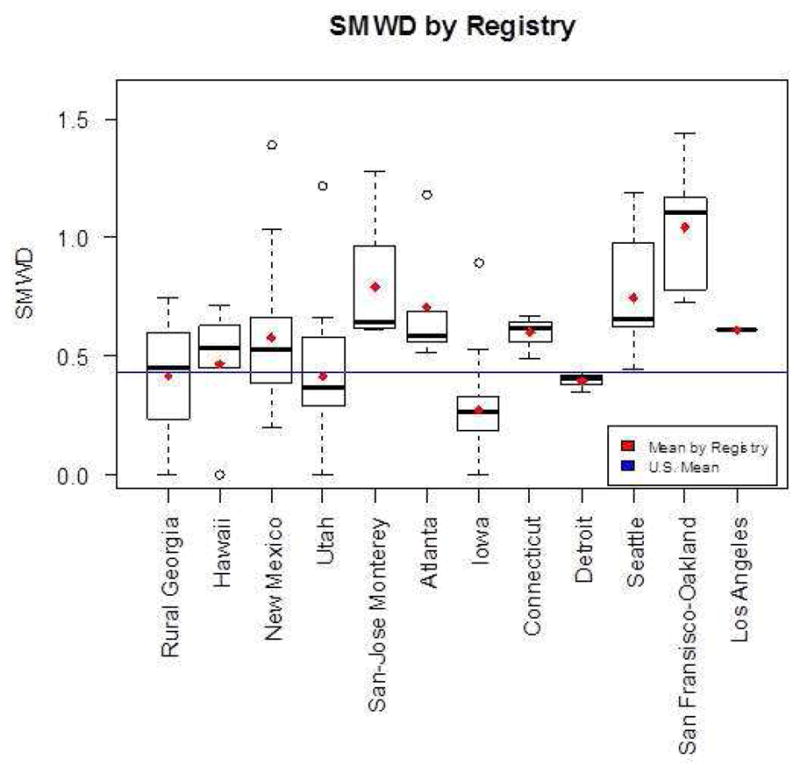
Sexual Minority Women Density by Registry. Plotted means in red and blue are calculated over the counties included in the individual registries or over the entire U.S. respectively. (The bottom and top of the box are the 25th and 75th percentile and the band near the middle of the box is the median. The ends of the whiskers represent the lowest datum still within 1.5 interquartile range (IQR) of the lower quartile, and the highest datum still within 1.5 IQR of the upper quartile. The dotted line represents the range from the lower(higher) quartile to the lowest(highest) datum that is within 1.5 IQR. IQR is the difference between the 75th and the 25th percentile.)
Table 2 shows the multiple regression results for the incidence of lung cancer in the male and female populations. Age and registry were controlled for, as well as poverty, education and race. In these fully adjusted models, the incidence rate ratio of 1.05 shows that with each unit increase in SMMD, the incidence of lung cancer in men increased by 5%. This reflects a positive significant relationship between SMMD and the incidence of lung cancer. Among women, a significant negative relationship was found, indicating that an increase in SMWD was associated with a lower incidence of lung cancer; a unit increase in SMWD decreased the incidence of lung cancer by 17%. In both models for men and women, education level and race were significantly associated with the incidence of lung cancer. For men, a significant positive association was found between poverty and the incidence of lung cancer. The association between education and the incidence of lung cancer was negative, indicating that a higher level of education was associated with a lower incidence of lung cancer in both men and women. Black race was positively associated with the incidence of lung cancer among both men and women, indicating more cases of lung cancer compared with their White counterparts. A negative association with the incidence of lung cancer was found for both men and women of other races, suggesting fewer cases of lung cancer compared with White men and women.
Table 2.
Multiple regression model for lung cancer incidence in the male and female populationa
| Male population | Female population | |||||||||
|---|---|---|---|---|---|---|---|---|---|---|
| Parameter | Estimate | IRR | 95%CI | P-value | Estimate | IRR | 95%CI | P-value | ||
| Sexual minority density | 0.05 | 1.05 | 1.04 | 1.07 | <0.0001 | −0.19 | 0.83 | 0.79 | 0.88 | <0.0001 |
| Poverty level | 0.00 | 1.00 | 1.00 | 1.01 | 0.0008 | 0.00 | 1.00 | 1.00 | 1.00 | 0.2089 |
| Percent with high school education or higher | −0.01 | 0.99 | 0.99 | 0.99 | <0.0001 | −0.01 | 0.99 | 0.99 | 1.00 | 0.0003 |
| Black vs white | 0.36 | 1.43 | 1.40 | 1.46 | <0.0001 | 0.04 | 1.05 | 1.02 | 1.07 | 0.0008 |
| Other vs white | −0.67 | 0.51 | 0.50 | 0.53 | <0.0001 | −1.00 | 0.37 | 0.35 | 0.38 | <0.0001 |
IRR, incidence rate ratio; CI, confidence interval.
Results also adjusted for age and registry.
Table 3 shows the fully adjusted regression models for mortality due to lung cancer. Among men, a positive association was found between SMMD and mortality. Poverty, education and race were significantly associated with mortality, indicating that higher levels of poverty, lower education and Black race increase deaths due to lung cancer in men, whereas men of other races had lower mortality rates due to lung cancer. Modelling mortality rates for lung cancer for women, a significant negative association was found between SMWD and mortality. Black race and education were not significantly associated with deaths due to lung cancer, while a significantly negative association was found between other race and mortality due to lung cancer. Higher levels of poverty were associated with more deaths due to lung cancer in women.
Table 3.
Multiple regression model for lung cancer mortality in the male and female populationa
| Male population | Female population | |||||||||
|---|---|---|---|---|---|---|---|---|---|---|
| Parameter | Estimate | MRR | 95%CI | P-value | Estimate | MRR | 95%CI | P-value | ||
| Sexual minority density | 0.03 | 1.03 | 1.01 | 1.05 | 0.0083 | −0.14 | 0.87 | 0.82 | 0.92 | <0.0001 |
| Poverty level | 0.00 | 1.00 | 1.00 | 1.01 | 0.0253 | 0.01 | 1.01 | 1.00 | 1.01 | <0.0001 |
| Percentage with high school or higher education | −0.01 | 0.99 | 0.99 | 0.99 | <0.0001 | −0.00 | 1.00 | 0.99 | 1.00 | 0.1206 |
| Black vs White | 0.35 | 1.42 | 1.39 | 1.46 | <0.0001 | −0.02 | 0.98 | 0.95 | 1.01 | 0.1897 |
| Other vs White | −0.84 | 0.43 | 0.42 | 0.45 | <0.0001 | −1.23 | 0.29 | 0.28 | 0.30 | <0.0001 |
MRR, mortality rate ratio; CI, confidence interval.
Results also adjusted for age and registry.
Discussion
This study found higher incidence and mortality rates for lung cancer in geographical areas with greater SMMD. The results for women differed from the results for men; areas with a higher SMWD had significantly lower incidence and mortality rates for lung cancer. The other results are consistent with the findings of other studies, indicating that Black men have higher incidence and mortality rates for lung cancer than White men, while the incidence and mortality rates for lung cancer do not differ significantly between White and Black women.18,35 Consistent with these studies, no differences were found between Black and White women with respect to deaths due to lung cancer, but Black women had a higher incidence of lung cancer.
Previous studies have suggested that higher levels of poverty and low educational attainment significantly increase the incidence and mortality rates for lung cancer in both men and women.32 The present results for men confirm this finding, as both poverty and low educational attainment were significantly associated with higher incidence and mortality rates for lung cancer. However, in this study, the incidence and mortality rates for lung cancer in women had a more complex pattern, indicative of confounding between poverty and educational status. When controls were made for poverty alone, a significant association was found for both the incidence and mortality rates of lung cancer among women (results not shown). However, when controls were made for both poverty and education, poverty was no longer significantly associated with the incidence of lung cancer, whereas in the models of mortality due to lung cancer, a significant association was found for poverty but not for education. This pattern may be indicative of the complex relationship between education and lung cancer in women. A previous study36 that focused on temporal trends in mortality due to lung cancer in men and women found differences over time between men and women with respect to education. Among White women, deaths due to lung cancer increased for those with fewer than 12 years of education, comparing 1993 rates with 2001 rates; over the same period, deaths due to lung cancer among Black women were stable at every level of education.36
Most importantly, these analyses are an ambitious attempt to overcome the nonexistent surveillance of sexual minorities. The approach relied on available population-based data, the US Census, which has previously been linked with SEER data in an effort to compensate for a lack of individual data in SEER.15–20 The results presented here on geographical SMMD data were consistent in that it was possible to show that SMMD is significantly associated with incidence and mortality rates for lung cancer. The data on SMWD are also consistent, indicating a significant association with incidence and mortality rates for lung cancer. However, contrary to expectations, the association was found to be negative, indicating that areas with greater SMWD have lower incidence and mortality rates for lung cancer.
The inconsistency of these findings by sex is of concern because there are reliable data that both sexual minority men and women have higher smoking rates compared with their heterosexual counterparts;9,10 therefore, it was reasonable to expect that both greater SMMD and SMWD areas would have significantly higher incidence and mortality rates for lung cancer. It is questionable whether the considerable latency period of lung cancer may contribute to the inconsistency of these findings by sex. These analyses did not compare rates by sex directly; instead, the male and female populations were analysed separately. However, it may be that there are insufficient longitudinal surveillance data on smoking behaviours by sexual orientation, as the earliest studies are from the 1980s.9,10 Due to the extended latency period of lung cancer, it is conceivable that the recently documented increased smoking behaviours in sexual minority women compared with heterosexual women may not have existed for a sufficient period to result in elevated lung cancer in sexual minority women. It may be that the expected differences will be seen in future years. Studies of the general population have clearly shown that temporal trends in the incidence and mortality rates for lung cancer follow historical smoking behaviours. In the general population, studies of the incidence of lung cancer closely mirror smoking behaviours, with the prevalence of smoking among women peaking about 20 years after that for men.7 Specifically, the prevalence of smoking among men peaked at 67% during the 1940s, and the mortality rate due to lung cancer for men peaked at 91 out of 100,000 in 1990, indicating 40–50 years between the peak smoking rate and the peak in mortality. Among women, the prevalence of smoking peaked in the 1960s and the mortality rate due to lung cancer peaked in 1999 at about 41 out of 100,000, about 40 years after the peak smoking rate.37 Similar temporal data on sexual orientation and smoking are not available. It is not known when the higher prevalence of smoking among sexual minority women compared with heterosexual women peaked, making it possible that the lower incidence and mortality rates for lung cancer in areas with greater SMWD may be reversed at some point in the future.
A novel methodological strategy was used in this study in an attempt to approximate population-level disparities for sexual minority populations. Ideally, additional data could have been considered, such as temporal smoking data for the SEER counties on which these analyses are based. Ecological analyses or area-based measures have been widely used in studies that focused on the relationship between socioeconomic status and health, when individual-level measures have not been available.20,38–41 Based on a number of methodological studies with both aggregate and individual-level data, weak to moderate correlation has been shown between area and individual-level variables; others have suggested that they measure different constructs.42 The limitations of this approach are recognized and inference is at the level of the county, rather than the level of the individual. It is hoped that with respect to sexual minority status, future research will seek to substantiate the link between sexual orientation and lung cancer identified by this study. This ecological study describes the relationship between the density of sexual minorities and lung cancer. This is similar to earlier studies that focused on the incidence of breast cancer and colorectal cancer, showing a positive association between SMWD and the incidence of breast cancer, and a positive association between greater SMMD and SMWD and the incidence of colorectal cancer.25,27
Ideally, individual population-based data on sexual minorities are needed to address the question of lung cancer disparities due to sexual orientation. However, while it is resource-intensive yet feasible to systematically assess the sexual orientation of breast cancer cases using a cancer registry,26 a similar approach is not conceivable for lung cancer due to the short survival time. Moreover, because of the high mortality rates for lung cancer, it is not possible to use population-based surveys of cancer survivors that include measures of sexual orientation.
This novel methodological strategy is particularly valuable for an ecological examination of the lung cancer burden, which may be the most sensible approach for the time being in light of the limitations of the available data. Another strength of this study is that controls were made for poverty, education and race, which are linked to lung cancer. If the data had been available, models would have included controls for smoking rates. This ecological approach to lung cancer is in line with other ecological approaches, which linked state-specific tobacco control efforts to lower smoking and the incidence of lung cancer.43
Acknowledgments
Funding
This work was supported by the National Cancer Institute at the National Institutes of Health (1 R03 CA130067-01A1).
Footnotes
Ethical approval
As all data were de-identified public-use data files, the protocol was deemed to be exempt from Institutional Review Board review.
Competing interests
None declared.
Publisher's Disclaimer: This is a PDF file of an unedited manuscript that has been accepted for publication. As a service to our customers we are providing this early version of the manuscript. The manuscript will undergo copyediting, typesetting, and review of the resulting proof before it is published in its final citable form. Please note that during the production process errors may be discovered which could affect the content, and all legal disclaimers that apply to the journal pertain.
References
- 1.Witschi H. A short history of lung cancer. Toxicol Sci. 2001;64:4–6. doi: 10.1093/toxsci/64.1.4. [DOI] [PubMed] [Google Scholar]
- 2.Kazerouni N, Alverson CJ, Redd SC, Mott JA, Mannino DM. Sex differences in COPD and lung cancer mortality trends – United States, 1968–1999. J Womens Health. 2004;13:17–23. doi: 10.1089/154099904322836410. [DOI] [PubMed] [Google Scholar]
- 3.Pinsky PF. Racial and ethnic differences in lung cancer incidence: how much is explained by differences in smoking patterns? (United States) Cancer Causes Control. 2006;17:1017–24. doi: 10.1007/s10552-006-0038-2. [DOI] [PubMed] [Google Scholar]
- 4.Villeneuve PJ, Mao Y. Lifetime probability of developing lung cancer, by smoking status, Canada. Can J Public Health. 1994;85:385–8. [PubMed] [Google Scholar]
- 5.Centers for Disease Control and Prevention. The health consequences of smoking: a report of the Surgeon General. Atlanta, GA: Centers for Disease Control and Prevention; 2004. Contract No.: RR-1. [PubMed] [Google Scholar]
- 6.American Cancer Society. Cancer facts and figures 2009. Atlanta, GA: American Cancer Society; 2009. [Google Scholar]
- 7.Jemal A, Siegel R, Ward E, Hao Y, Xu J, Thun MJ. Cancer statistics, 2009. CA Cancer J Clin. 2009;59:225–49. doi: 10.3322/caac.20006. [DOI] [PubMed] [Google Scholar]
- 8.The President’s Cancer Panel. Annual report 2006–2007. US Department of Health and Human Services; 2007. Promoting healthy lifestyles: policy, program, and personal recommendations for reducing cancer risk. [Google Scholar]
- 9.Lee JG, Griffin GK, Melvin CL. Tobacco use among sexual minorities in the USA, 1987 to May 2007: a systematic review. Tob Control. 2009;18:275–82. doi: 10.1136/tc.2008.028241. [DOI] [PubMed] [Google Scholar]
- 10.Ryan H, Wortley PM, Easton A, Pederson L, Greenwood G. Smoking among lesbians, gays, and bisexuals: a review of the literature. Am J Prev Med. 2001;21:142–9. doi: 10.1016/s0749-3797(01)00331-2. [DOI] [PubMed] [Google Scholar]
- 11.Bowen DJ, Boehmer U. The lack of cancer surveillance data on sexual minorities and strategies for change. Cancer Causes Control. 2007;18:343–9. doi: 10.1007/s10552-007-0115-1. [DOI] [PubMed] [Google Scholar]
- 12.Frisch M, Biggar RJ, Engels EA, Goedert JJ Group A-CMRS. Association of cancer with AIDS-related immunosuppression in adults [see comment] JAMA. 2001;285:1736–45. doi: 10.1001/jama.285.13.1736. [DOI] [PubMed] [Google Scholar]
- 13.Allardice GM, Hole DJ, Brewster DH, Boyd J, Goldberg DJ. Incidence of malignant neoplasms among HIV-infected persons in Scotland. Br J Cancer. 2003;89:505–7. doi: 10.1038/sj.bjc.6601139. [DOI] [PMC free article] [PubMed] [Google Scholar]
- 14.Grulich AE, Wan X, Law MG, Coates M, Kaldor JM. Risk of cancer in people with AIDS. AIDS. 1999;13:839–43. doi: 10.1097/00002030-199905070-00014. [DOI] [PubMed] [Google Scholar]
- 15.Gumpertz ML, Pickle LW, Miller BA, Bell BS. Geographic patterns of advanced breast cancer in Los Angeles: associations with biological and sociodemographic factors (United States) Cancer Causes Control. 2006;17:325–39. doi: 10.1007/s10552-005-0513-1. [DOI] [PubMed] [Google Scholar]
- 16.Reynolds P, Hurley SE, Quach AT, Rosen H, Von Behren J, Hertz A, et al. Regional variations in breast cancer incidence among California women, 1988–1997. Cancer Causes Control. 2005;16:139–50. doi: 10.1007/s10552-004-2616-5. [DOI] [PubMed] [Google Scholar]
- 17.Eschbach K, Mahnken JD, Goodwin JS. Neighborhood composition and incidence of cancer among Hispanics in the United States. Cancer. 2005;103:1036–44. doi: 10.1002/cncr.20885. [DOI] [PMC free article] [PubMed] [Google Scholar]
- 18.Ward E, Jemal A, Cokkinides V, Singh GK, Cardinez C, Ghafoor A, et al. Cancer disparities by race/ethnicity and socioeconomic status. CA Cancer J Clin. 2004;54:78–93. doi: 10.3322/canjclin.54.2.78. [DOI] [PubMed] [Google Scholar]
- 19.O’Malley CD, Le GM, Glaser SL, Shema SJ, West DW. Socioeconomic status and breast carcinoma survival in four racial/ethnic groups: a population-based study. Cancer. 2003;97:1303–11. doi: 10.1002/cncr.11160. [DOI] [PubMed] [Google Scholar]
- 20.Singh G, Miller B, Hankey B, Edwards B. Monograph NIH Publication No 03-5417. Bethesda, MD: National Cancer Institute; 2003. Area socioeconomic variations in U.S. cancer incidence, mortality, stage, treatment, and survival, 1975–1999. [Google Scholar]
- 21.Carpenter C, Gates GJ. Gay and lesbian partnership: evidence from California. Demography. 2008;45:573–90. doi: 10.1353/dem.0.0014. [DOI] [PMC free article] [PubMed] [Google Scholar]
- 22.Gates GJ. Same-sex couples and the gay, lesbian, bisexual population: new estimates from the American Community Survey. Los Angeles, CA: The Williams Institute on Sexual Orientation Law and Public Policy UCLA School of Law; 2006. [Google Scholar]
- 23.Ost J, Gates G. The gay and lesbian atlas. Washington, DC: The Urban Institute Press; 2005. [Google Scholar]
- 24.Boehmer U, Clark M, Timm A, Ozonoff A. Two means of sampling sexual minority women: how different are the samples of women? J LGBT Health Res. 2008;4:143–51. doi: 10.1080/15574090903110786. [DOI] [PubMed] [Google Scholar]
- 25.Boehmer U, Ozonoff A, Timm A. County-level association of sexual minority density with breast cancer incidence: results from an ecological study. Sex Res Social Policy. 2011;8:139–45. [Google Scholar]
- 26.Boehmer U, Clark M, Glickman M, Timm A, Sullivan M, Bradford J, et al. Using cancer registry data for recruitment of sexual minority women: successes and limitations. J Women’s Health. 2010;19:1289–97. doi: 10.1089/jwh.2009.1744. [DOI] [PubMed] [Google Scholar]
- 27.Boehmer U, Ozonoff A, Miao X. An ecological analysis of colorectal cancer incidence and mortality: differences by sexual orientation. BMC Cancer. 2011;11:400. doi: 10.1186/1471-2407-11-400. [DOI] [PMC free article] [PubMed] [Google Scholar]
- 28.Sears RB, Gates G, Rubenstein WB. The Williams Project on Sexual Orientation Law and Public Policy. Los Angeles: UCLA School of Law; 2005. Same-sex couples and same-sex couples raising children in the United States: data from Census 2000. [Google Scholar]
- 29.Bowen D, Bradford J, Powers D, McMorrow P, Linde R, Murphy B, et al. Comparing women of differing sexual orientations using population-based sampling. Women Health. 2004;40:19–34. doi: 10.1300/j013v40n03_02. [DOI] [PubMed] [Google Scholar]
- 30.Simmons T, O’Connell M. Census 2000 Special Reports. U.S. Department of Commerce Economics and Statistics Administration, U.S. Census Bureau; 2003. Married-couple and unmarried-partner households: 2000. [Google Scholar]
- 31.Day JC. Population projections of the united states by age, sex, race, and hispanic origin: 1995 to 2050. Washington, DC: U.S. Census Bureau; 1996. [Google Scholar]
- 32.Clegg LX, Reichman ME, Miller BA, Hankey BF, Singh GK, Lin YD, et al. Impact of socioeconomic status on cancer incidence and stage at diagnosis: selected findings from the surveillance, epidemiology, and end results: National Longitudinal Mortality Study. Cancer Causes Control. 2009;20:417–35. doi: 10.1007/s10552-008-9256-0. [DOI] [PMC free article] [PubMed] [Google Scholar]
- 33.Krieger N, Chen JT, Waterman PD, Rehkopf DH, Subramanian SV. Painting a truer picture of US socioeconomic and racial/ethnic health inequalities: the Public Health Disparities Geocoding Project. Am J Public Health. 2005;95:312–23. doi: 10.2105/AJPH.2003.032482. [DOI] [PMC free article] [PubMed] [Google Scholar]
- 34.American Cancer Society. Cancer facts and figures 2011. Atlanta, GA: American Cancer Society; 2000. [Google Scholar]
- 35.Chu KC, Miller BA, Springfield SA. Measures of racial/ethnic health disparities in cancer mortality rates and the influence of socioeconomic status. J Natl Med Assoc. 2007;99:1092–104. [PMC free article] [PubMed] [Google Scholar]
- 36.Kinsey T, Jemal A, Liff J, Ward E, Thun M. Secular trends in mortality from common cancers in the United States by educational attainment, 1993–2001. J Natl Cancer Inst. 2008;100:1003–12. doi: 10.1093/jnci/djn207. [DOI] [PMC free article] [PubMed] [Google Scholar]
- 37.Giovino GA. Epidemiology of tobacco use in the United States. Oncogene. 2002;21:7326–40. doi: 10.1038/sj.onc.1205808. [DOI] [PubMed] [Google Scholar]
- 38.Diez-Roux AV, Kiefe CI, Jacobs DR, Jr, Haan M, Jackson SA, Nieto FJ, et al. Area characteristics and individual-level socioeconomic position indicators in three population-based epidemiologic studies. Ann Epidemiol. 2001;11:395–405. doi: 10.1016/s1047-2797(01)00221-6. [DOI] [PubMed] [Google Scholar]
- 39.Diez Roux AV, Merkin SS, Hannan P, Jacobs DR, Kiefe CI. Area characteristics, individual-level socioeconomic indicators, and smoking in young adults: the coronary artery disease risk development in young adults study. Am J Epidemiol. 2003;157:315–26. doi: 10.1093/aje/kwf207. [DOI] [PubMed] [Google Scholar]
- 40.Dominguez-Berjon F, Borrell C, Rodriguez-Sanz M, Pastor V. The usefulness of area-based socioeconomic measures to monitor social inequalities in health in Southern Europe. Eur J Public Health. 2006;16:54–61. doi: 10.1093/eurpub/cki069. [DOI] [PubMed] [Google Scholar]
- 41.Soobader M, LeClere FB, Hadden W, Maury B. Using aggregate geographic data to proxy individual socioeconomic status: does size matter? Am J Public Health. 2001;91:632–6. doi: 10.2105/ajph.91.4.632. [DOI] [PMC free article] [PubMed] [Google Scholar]
- 42.Diez-Roux AV. Multilevel analysis in public health research. Annu Rev Public Health. 2000;21:171–92. doi: 10.1146/annurev.publhealth.21.1.171. [DOI] [PubMed] [Google Scholar]
- 43.Cokkinides V, Bandi P, McMahon C, Jemal A, Glynn T, Ward E. Tobacco control in the United States – recent progress and opportunities. CA Cancer J Clin. 2009;59:352–65. doi: 10.3322/caac.20037. [DOI] [PubMed] [Google Scholar]