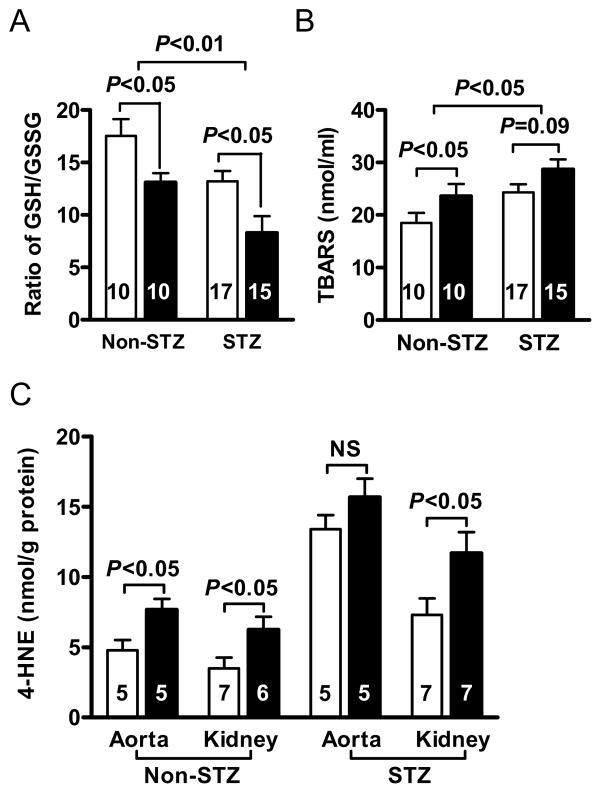
Figure 4.
(A) Ratios of reduced/oxidized glutathione (GSH/GSSG) of erythrocytes. (B) Plasma thiobarbituric acid reactive substances (TBARS). (C) 4-hydroxynonenal (4-HNE) in aorta and kidney cortex in Lias+/−Apoe−/− (black bars) and Lias+/+Apoe−/− mice (open bars). The numbers inside bars indicate number of animals. Results are expressed as mean ± SEM.

