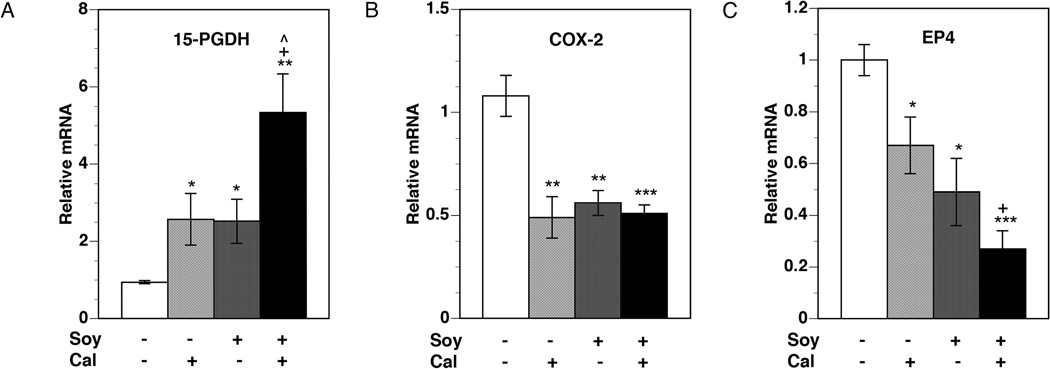
Figure 3. Changes in tumor mRNA expression of PG pathway genes.
PC-3 xenografts were harvested from mice at the end of four weeks of treatment. Total RNA was isolated from harvested tumor tissue and mRNA levels of 15-PGDH (A), COX-2 (B), and PG receptor EP4 (C) were analyzed by qRT-PCR, as described in Materials and Methods. Relative mRNA expression for each gene in tumors from control mice was set at 1. Values represent mean ± SE of 6–11 measurements in each group. * p < 0.05, ** p < 0.01, and *** p < 0.001 compared to control. + p < 0.05 compared to calcitriol. ^ p< 0.05 compared to 20%-soy.

