

Summary
Purpose
Mossy fiber sprouting (MFS) is a frequent finding following status epilepticus (SE). The present study aimed to test the feasibility of using manganese-enhanced magnetic resonance imaging (MEMRI) to detect MFS in the chronic phase of the well-established pilocarpine (Pilo) rat model of temporal lobe epilepsy (TLE).
Methods
To modulate MFS, cycloheximide (CHX), a protein synthesis inhibitor, was co-administered with Pilo in a sub-group of animals. In vivo MEMRI was performed 3 months after induction of SE and compared to the neo-Timm histological labeling of zinc mossy fiber terminals in the dentate gyrus (DG).
Key findings
Chronically epileptic rats displaying MFS as detected by neo-Timm histology had a hyperintense MEMRI signal in the DG, while chronically epileptic animals that did not display MFS had minimal MEMRI signal enhancement compared to non-epileptic control animals. A strong correlation (r = 0.81, P<0.001) was found between MEMRI signal enhancement and MFS.
Significance
This study shows that MEMRI is an attractive non-invasive method to detect mossy fiber sprouting in vivo and can be used as an evaluation tool in testing therapeutic approaches to manage chronic epilepsy.
Keywords: Mossy fiber sprouting, epilepsy, pilocarpine, MRI, manganese, animal models
1. Introduction
Chronic epilepsy is associated with structural and functional brain abnormalities. Two common histological findings in temporal lobe epilepsy (TLE) are hippocampal sclerosis and axonal reorganization (Babb, et al. 1991, Babb, et al. 1992, Buckmaster, et al. 1997, Mello, et al. 1993, Tauck, et al. 1985). The most frequent reorganization following epileptogenesis is mossy fiber sprouting (MFS) in the dentate gyrus (DG), which is present in both humans and animal models (Babb, et al. 1991, Cronin, et al. 1988, Sutula, et al. 1989, Tauck & Nadler 1985). Mossy fibers are dentate granule cell axons that project to CA3 hippocampal pyramidal cells (Amaral, et al. 2007). It has been proposed that the severity of MFS correlates with the severity of TLE and with the frequency of spontaneous recurrent seizures (Chang, et al. 2003).
In the pilocarpine (Pilo) model of TLE, as well as in other experimental models, status epilepticus (SE) causes massive neuronal death in the CA3 and hilus regions (Buckmaster & Dudek 1997, Shin, et al. 1994, Tauck & Nadler 1985). This results not only in the local loss of synapses but also leads to the formation of new synaptic connections (sprouting) between mossy fibers and the dendritic trees of granule cells. This recurrent innervation leads to the formation of abnormal neuronal circuits that have been associated with enhanced hippocampal excitability (Shin & McNamara 1994). However, there is disagreement as to the significance of such circuits (Longo, et al. 2002, Williams, et al. 2002) in the generation of spontaneous seizures. Apart from some conflicting data (Toyoda, et al. 2005, Williams, et al. 2002), it has been clearly demonstrated that co-administration of cycloheximide (CHX), a protein synthesis inhibitor, with Pilo does not interfere with SE induction and is able to prevent subsequent MFS in the chronic phase of this TLE model (Longo, et al. 1997, Longo, et al. 1998).
Because hippocampal morphological changes in epilepsy are progressive, it would be useful to develop tools to investigate time-resolved alterations, such as MFS, over the course of untreated seizures. In animal models, in vivo analysis of the hippocampus using MRI has been usually limited to morphological studies (Bouilleret, et al. 2000, Briellmann, et al. 1999, Briellmann, et al. 2007, Cook, et al. 1992, Niessen, et al. 2005, Parker, et al. 2003, Van Paesschen, et al. 1995, Wolf, et al. 2002), and detailed studies of changes in hippocampal circuitry using in vivo MRI are still in the early stages.
Administration of the divalent manganese ion (Mn2+) has been shown to be an effective method to enhance MRI contrast in vivo (Silva, et al. 2004). Using the manganese-enhanced MRI (MEMRI) technique, previous studies showed an association of the hyperintense MEMRI signal of the DG with MFS in the kainate model of TLE (Immonen, et al. 2008, Nairismägi, et al. 2005). In the present study, we hypothesized that MEMRI could be used to evaluate different levels of MFS in vivo in chronic epileptic animals. We tested this hypothesis by comparing the MEMRI signal in the DG during the chronic phase of the Pilo model of TLE. After co-treatment with CHX, two groups of epileptic animals were observed, those with and without MFS.
2. Methods
2.1. Animal model
The Ethical Committee of the Universidade Federal de São Paulo approved all experiments (Experimental Protocol 0750/07). Adult male Wistar rats (250–300 g) were housed in groups of five and kept on a standard light/dark cycle (12/12 h) with lights on at 7:00 AM and with ad libitum access to food and water. Seizures were induced by i.p. injections of pilocarpine hydrochloride (Pilo, 320 mg/kg, Vegeflora). Scopolamine methyl bromide (M-sc, 1 mg/kg, i.p., Sigma) was administered 30 minutes prior to Pilo to reduce its peripheral effects. One subgroup of animals also received a single dose of cycloheximide (CHX, 1 mg/kg, i.p., Sigma) 30 minutes prior to Pilo. To reduce the mortality rate, all animals received a single dose of thionembutal (25 mg/kg, i.p., Cristalia) 90 minutes after the onset of status epilepticus (SE). Three groups of animals were used. The CHX–Pilo group (n=30) received all of the above-mentioned drugs. The Pilo group (n=25) was injected with all of the drugs except CHX. The control group (n=5) received saline instead of the drugs. The behavioral data analysis was performed by video monitoring the animals for 12 hours daily, from SE induction until MRI acquisition day (for 3 months). The number of spontaneous recurrent seizures (SRS) per animal is based on recordings of the previous 6 weeks (Monday-Friday; 4 hours/day; total of 120 hours) before MRI. Seizures were scored according to Racin’s scale (Racine 1972). The study design is shown in Figure 1.
Figure 1.

Temporal diagram depicting the groups, treatments and procedures used in the present study. The animals were divided into three groups: (1) CHX–Pilo animals received cycloheximide (CHX), methyl-scolpolamine (M-sc), Pilo (pilocarpine) and Thio (thionembutal) at the times and doses described above; (2) Pilo animals were similarly injected with the same drugs except for CHX; and (3) control animals received saline instead of all of the drugs, except Thio. Three months after these initial procedures, all animals received a single systemic dose of MnCl2 solution (60 mg/kg, i.p.) 24 hours prior to MRI acquisition and perfusion.
2.2. MRI experiments
The MRI acquisitions and subsequent histological analyses were performed in all control animals (n=5) and in a random subset of animals from the CHX-Pilo (n=5) and Pilo groups (n=5). Three months after SE, MnCl2 (60 mg/kg, i.p.) was administered to these 15 animals (Figure 1). The injected solution consisted of 100 mM MnCl2-4H2O (Sigma-Aldrich) in 400 mM bicine buffer (Silva, et al. 2004). The pH was adjusted to 7.4 using 1 M NaOH. Animals were scanned 24 hours after the injections. MRIs were obtained in a 2 Tesla/30 cm superconducting magnet (Oxford Instruments 85310HR) interfaced to a Bruker Avance AVIII console (Bruker-Biospin, Inc., Billerica, MA, USA) running Paravision 5.0. A crossed saddle radiofrequency coil (Papoti 2006) was used as a head probe in animals anesthetized with ketamine/xylazine (95/12 mg/kg, i.p.). A T1-weighted 3D FLASH sequence (TR = 200 ms, TE = 5.8 ms, flip angle = 90°, 4 averages, 40 minutes/animal) was acquired. A volume of 40 × 40 × 11.2 mm3 was covered with 192 × 192 × 16 points, producing a spatial resolution of 208 × 208 × 700 μm3. A T2-weighted (TR = 4000 ms, TE = 67.1 ms, 8 averages, 17 minutes/animal) RARE sequence was used with the same spatial resolution immediately after the T1-weighted image to determine the hippocampal volume. All images were acquired 3 months after induction of SE (Figure 1).
2.3. MRI data analysis
All MRI data were analyzed using the Paravision 5.1 software. One author (JMM), blinded to the group’s identity, manually outlined the region of interest (ROI) representing the DG. This was drawn from a single coronal section of the 3D T1-weighted volume located 3.6 mm caudal to the bregma (Paxinos, et al. 1998), with anatomic boundaries defined as illustrated in Figure 2. At this rostro-caudal level, the hippocampus extends 7 mm from midline to lateral. The ventral border is formed by the lateral ventricle and its cerebrospinal fluid. The dorsal border is formed by the hippocampal fissure. The cut line inside the DG was drawn connecting the inferior and superior tips of the molecular layer. Confirmation of the accuracy of the ROI contour for each animal was achieved by superimposing the corresponding Nissl histological DG map of each compatible section over the MRI on the computer screen. Based on the atlas, the area corresponding to the DG was between 1.5 – 4.5 mm from the midline and 2.8 – 3.8 mm below the cortical surface in the MRI (Figure 2). The relative MEMRI signal enhancement in the DG was calculated as the ratio of the mean signal intensity in the ROI to the mean signal intensity of the adjacent corpus callosum. MEMRI hyperintensity was considered when a relative increase in signal intensity was observed when compared to controls, as previously described (Immonen, et al. 2008). Based on analysis of the MEMRI, the intensity results varied from 0.945 (control animals) to 1.170 (animals that exhibited MEMRI hyperintensity).
Figure 2.
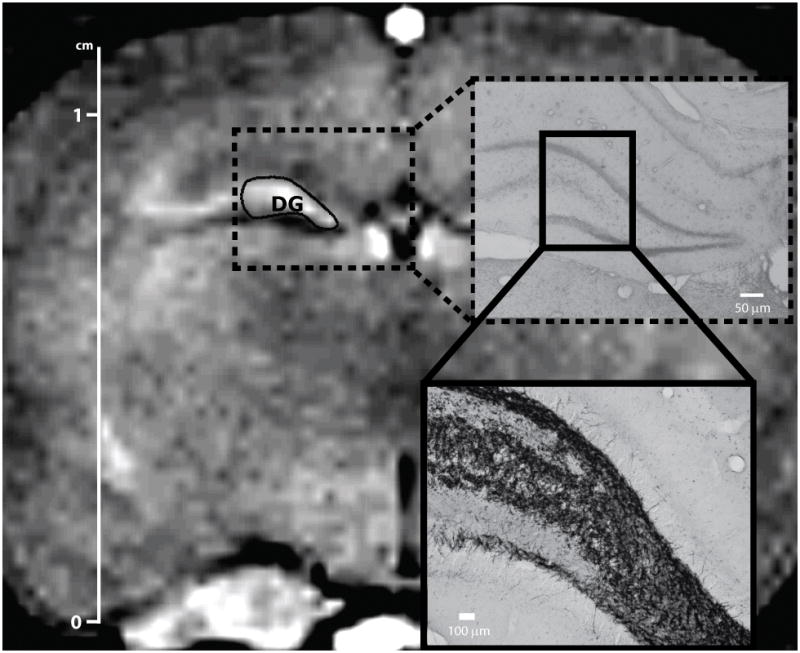
The manually drawn ROIs in the T1-weighted image delimit the dentate gyrus area. The right panels indicate the rostro-caudal level of the hippocampal area under MRI (upper right) and histological analysis (lower right) at 3.6 mm caudal from the bregma (rat brain atlas of Paxinos, et al. 1998). Scale bars: 1 cm (MEMRI); 50 μm (neo-Timm).
The hippocampal volume was assessed from six regularly separated coronal sections of the T2-weighted images from 2.12 – 4.16 mm (rostral portion) and from 4.8 – 6.04 mm (caudal portion) caudal to bregma (Paxinos & Watson 1998), multiplied by slice thickness. The volume of 40 × 40 × 11.2 m3 was covered with 192 × 192 × 16 points, producing a spatial resolution of 208 × 208 × 700 μm3.
2.4. Histology
2.4.1. Fixation and tissue processing
After imaging, the rats were deeply anesthetized with chloral hydrate and sequentially perfused through the heart with the following: (1) 25 mL of Millonig’s buffer; (2) 50 mL of 0.1% sodium sulfide fixative in Millonig’s buffer; (3) 100 mL of 3% glutaraldehyde; and (4) 200 mL of 0.1% sodium sulfide fixative in Millonig’s buffer. The brains were removed from the skull and immersed in 30% sucrose overnight.
Brains were cut on a cryostat (40-μm thick sections). One of three consecutive coronal sections was mounted onto gelatin-coated slides and processed for neo-Timm staining (Mello, et al. 1993) to detect abnormal growth of granule cell axons (mossy fiber sprouting) (Sloviter 1982). The solutions for this procedure consisted of 240 mL of 50% gum arabic with 10.25 g of citric acid, 9.45 g of sodium citrate in 30 mL of ddH2O, 3.73 g of hydroquinone in 60 mL of ddH2O and a 2 mL solution of 0.51 g of silver nitrate in 3 mL of ddH2O. The batches were processed with a developing time of 45 minutes. The slides were washed twice in distilled water for 5 min each, dehydrated through a sequence of alcohol and xylene and coverslipped with Canada balsam.
The intensity of sprouting in the supragranular layer and hilus was evaluated by quantitatively measuring gray scale values using the NIH Image J software (http://rsbweb.nih.gov/ij/index.html). The gray scale values for the supragranular layer and the hilus were compared to the adjacent corpus callosum (baseline value). Prior to further processing, the original Bruker files were converted to Analyze 7.5 format. The 3D datasets from both the Pilo and CHX-Pilo groups were registered to the Control images using the automatic algorithm of MIPAV (Center for Information Technology, NIH, Bethesda, MD, USA). Subsequently, all images were normalized based on the signal intensity of the rat head muscles, and their dynamic range was expanded to cover the full range. Color images from all three groups were generated to highlight the signal intensity differences in the hippocampus region.
The intensity of sprouting was referred to as the neo-Timm densitometry and varied from 10.7 (no staining in the supragranular layer) to 118 (intense staining in the supragranular layer). Sections were assessed across three different levels (rostral, medium and caudal) of the hippocampus bilaterally, corresponding to levels 2.8, 3.8 and 4.8 mm caudal to the bregma (Paxinos & Watson 1998) to exclude any possible rostro-caudal variability.
Scores were used for MRI and histology analyses to put emphasis on the results. The scores for the supragranular area varying from “−” to “+++” are summarized in Table 1. Threshold levels for the MEMRI signal intensity and neo-Timm densitometry were defined as the value of the average + 2 SEM from the controls.
Table 1.
Scores for MEMRI intensity and neo-Timm densitometry.
| Score | MEMRI intensity | Neo-Timm densitometry |
|---|---|---|
| − | Threshold | 10.7–29.4 (No staining) |
| + | 10% increase | 29.4 – 49.0 |
| ++ | 10–15% increase | 49.1 – 73.5 |
| +++ | > 15% increase | > 73.5 |
2.5. Statistical analysis
The behavioral data related to SE induction, latency to SE, latency to first observed spontaneous seizure, number of spontaneous seizures per animal, and total number of spontaneous seizures were analyzed using Fisher’s exact test. The MEMRI signal, hippocampal volumetry and neo-Timm densitometry data are presented as the mean ± SEM. Data were analyzed using a one-way ANOVA followed by the Tukey-Kramer post-hoc test with the statistical significance set to P<0.05 for each analysis. Pearson’s correlation coefficient (r) was derived to investigate the relationship between MEMRI hyperintensity and neo-Timm densitometry.
3. Results
Sixty percent of animals from both the Pilo (15/25) and CHX-Pilo (18/30) groups developed status epilepticus within latencies of 30 ± 7 and 47 ± 7 min, respectively. The latency to the first observed spontaneous seizure was shorter for CHX-Pilo group (8±3 days) compared to the Pilo group (32 ± 13 days; P=0.005). Spontaneous recurrent seizures (SRS) were recorded in 7 animals from the Pilo group and 8 animals from the CHX-Pilo group. Both groups had a similar number of SRS/animal in 120 hours (1.7 ± 2.2 for Pilo group; 1.6 ± 1.5 for CHX-Pilo group) and total number of observed seizures (12 SRS for Pilo group or 0.1 seizures/hour; 13 SRS for CHX-Pilo group or 0.1 seizures/hour). Representative MEMRI (AC) and neo-Timm staining micrographs (D–F) of the DG from the three groups, CHX-Pilo MFS-negative, Control and Pilo MFS-positive animals, respectively, are shown in Figure 3. Pilo-treated animals had a higher DG MEMRI hyperintensity (1.113 ± 0.012) than Controls (0.992 ± 0.003) or animals receiving CHX-Pilo (1.030 ± 0.033, P<0.05). Similarly, neo-Timm densitometry analysis showed that the Pilo-treated group had more MFS in the dentate supragranular layer (65.34 ± 5.52) than the CHX-Pilo (40.91 ± 6.10) and Control (21.72 ± 1.76, P<0.05) groups (Figure 3). No differences were detected in the hilar neo-Timm staining in any groups (Pilo: 115.45 ± 6.70; CHX-Pilo: 123.78 ± 9.90; Control: 107.79 ± 11.14; P>0.05, NS).
Figure 3.

T1-weighted MEMRI (A–C) and photomicrographs (D–F) representative of CHX-treated MFS-negative (left panel), Control (middle panel) and Pilo-treated MFS-positive (right panel) animals, respectively. The dentate gyrus region from MEMRI (A–C) was enlarged and converted from the gray scale into a colored scale. The Pilo animal showed MFS in the supragranular layer (s, black arrowheads) and MEMRI hyperintensity in DG, while the CHX and Control animals did not. MRI data from the three groups were normalized to the muscle signal intensity to minimize possible signal differences. Scale bars = 50μm.
The rostral hippocampal volume was lower in both experimental groups than in the controls (Pilo: 17.57 ± 0.72 mm3; CHX-Pilo: 17.74 ± 0.78 mm3, Control: 20.85 ± 0.31 mm3, P<0.05). However, this difference was not maintained when the total hippocampal volume was analyzed (Pilo: 68.54 ± 2.44 mm3; CHX-Pilo: 68.45 ± 2.28 mm3, Control: 76.05 ± 3.72 mm3).
As shown in Table 2, one animal in the Pilo group (named Pilo-5) showed a low level of MFS or MEMRI hyperintensity. In addition, while 2 of the animals in the CHX-Pilo group did not show signs of MFS, the other 3 presented some mossy fiber sprouting. On this basis, epileptic animals (from both Pilo and CHX-Pilo groups) were distributed into two groups, MFS-positive or MFS-negative, according to the presence or absence of MFS (Table 2). Animals in which the neo-Timm density was two standard deviations above the control average were considered as MFS-positive. Figure 4 shows that MFS-positive animals (85.32 ± 8.2) also exhibited MEMRI hyperintensity (1.11 ± 0.01; Figure 4A and B and Table 2), which was significantly different from control and MFS-negative groups (P<0.05). Epileptic animals that did not have MFS (21.33 ± 3.3) had a relatively low MEMRI signal (0.97 ± 0.06; Figure 4A and B), which was similar to control levels (MFS 21.72 ± 1.76; MEMRI intensity 1.00 ± 0.003). Interestingly, the one-way ANOVA analysis demonstrated that epileptic animals that had intense MFS also had a reduction in the hippocampal MRI volume (MFS-positive: 65.72 ±0.85; MFS-negative: 71.12 ±1.92; control: 76.05 ±3.72; P<0.05). The dispersion graph in Figure 4C considers data from all of the animals and demonstrates a strong correlation between MFS and MEMRI hyperintensity (r = 0.81, P<0.001). When the MEMRI signal intensity was compared to the MFS densitometry in the same single rostro-caudal level (3.6 mm caudal from the bregma), a similar correlation value (r = 0.78, P<0.001) was obtained.
Table 2.
Results based on scores for MEMRI intesnsity and neo-Timm densitometry for each animal used in the study. The scores vary from “−” (lower signal) to “+++” (higher signal).
| Animal | MEMRI signal | Neo-Timm densitometry | Groups |
|---|---|---|---|
| CHX-Pilo 1 | + | + | MFS+ |
| CHX-Pilo 2 | − | − | MFS− |
| CHX-Pilo 3 | − | − | MFS− |
| CHX-Pilo 4 | ++ | + | MFS+ |
| CHX-Pilo 5 | ++ | ++ | MFS+ |
| Pilo-1 | + | ++ | MFS+ |
| Pilo-2 | +++ | +++ | MFS+ |
| Pilo-3 | ++ | ++ | MFS+ |
| Pilo-4 | + | + | MFS+ |
| Pilo-5 | + | − | MFS− |
| Control-1 | − | − | control |
| Control-2 | − | − | control |
| Control-3 | − | − | control |
| Control-4 | − | − | control |
| Control-5 | − | − | control |
Gray areas indicate animals (except those from Control group) without mossy fiber sprouting (MFS).
Figure 4.

Results based on the presence or absence of mossy fiber sprouting (MFS) three months after status epilepticus (SE). MEMRI signal intensity (A) and neo-Timm densitometry (B) for control, MFS-positive and MFS-negative rats. Statistical significance was evaluated using a one-way ANOVA followed by the Tukey-Kramer post-hoc test. Differences were identified between MFS-positive and MFS-negative animals (#P<0.05) and MFS-positive and control animals (*P<0.05). Error bars = 1 SEM. Neo-Timm densitometry and MEMRI signal intensity are strongly correlated (Pearson’s correlation coefficient r=0.81, P<0.001) in the dispersion graph (C).
4. Discussion
The present study, using the pilocarpine model of chronic temporal lobe epilepsy, was designed to understand the effect of mossy fiber sprouting on MEMRI signal intensity in the dentate gyrus. MFS was modulated using cycloheximide treatment. The results show that chronically epileptic MFS-positive rats, as detected by neo-Timm histology, also had a hyperintense MEMRI signal in the DG. However, chronically epileptic animals that did not display MFS had a minimal MEMRI signal in the same brain region. These findings led us to conclude that MEMRI is a suitable tool for the study of MFS in chronically epileptic animals.
The pilocarpine model replicates several phenomenological features of human TLE and can be used as an experimental system to study the basic mechanisms of epileptogenesis (Ben-Ari 1985, Buckmaster & Dudek 1997, Turski, et al. 1989). Neuronal loss in several hippocampal subfields and reorganization of mossy fibers into the molecular layer of the fascia dentata were observed in the TLE model in our experiments and in previous studies (Mello et al. 1993; Furtado et al., 2002, Santhakumar et al., 2005, Jiao and Nadler, 2007). These observations are similar to the changes seen in hippocampi from patients with hippocampal sclerosis (Babb, et al. 1991, Mello, et al. 1993, Sutula, et al. 1989, Tauck & Nadler 1985).
Until now, the assessment of aberrant mossy fiber sprouting in an experimental model of TLE has only been reported in resected tissue (Danscher 1981), which restricts longitudinal studies. In animal models and in humans, a common histological technique to evaluate MFS is neo-Timm’s staining (Babb, et al. 1991, Babb, et al. 1992, Buckmaster & Dudek 1997, Claiborne, et al. 1989, Cronin & Dudek 1988, Leite, et al. 1991, Longo & Mello 1998, Mello, et al. 1993, Nairismägi, et al. 2005, Sloviter 1982, Sutula, et al. 1989, Tauck & Nadler 1985). In the present report, we found a strong positive correlation between MFS detected with MEMRI and neo-Timm densitometry.
Our findings are in agreement with previous studies using the systemic kainic acid model that showed MEMRI hyperintensity in animals with MFS in the hippocampal DG (Immonen, et al. 2008, Nairismägi, et al. 2005). These authors suggested that MEMRI would be more suitable to detect mossy fiber sprouting than neurodegeneration, gliosis or seizure-activity in the epileptic hippocampus of rats. Corroborating this suggestion, our results show a strong correlation (r = 0.81) between MFS and MEMRI hyperintensity in animals systemically injected with MnCl2, a finding that was previously observed only after entorhinal cortex manganese injections (Nairismägi, et al. 2005). Thus, this study proposes that systemic administration of MnCl2 is a less invasive strategy to study the progression of histopathological findings in animal models of TLE. The advantage of using systemic manganese instead of intracerebral injection is to avoid possible susceptibility artifacts produced by the needle path close to the region of interest; “in loco” injections are used for T1 FLASH 3D gradient recalled echo-based sequence. In addition, our results replicate the previous findings that CHX treatment does not interfere with the induction of spontaneous recurrent seizures (SRS) but can prevent the development of MFS (Longo & Mello 1997). Epileptic rats in which MFS was suppressed by CHX were similar in MEMRI hyperintensity in the DG compared to non-epileptic controls. The mechanisms by which cycloheximide acts to reduce or even prevent mossy fiber sprouting could be related to the reduction of hilar neuron loss, as reported previously (Bengzon, et al. 1997, Covolan, et al. 2000, Schreiber, et al. 1993).
It is important to note that the MEMRI hyperintensities reported here were obtained from a large ROI that includes most regions of the DG, including the hilus and the supragranular layer. Therefore, in addition to the supragranular layer, the hilus also contributes to the MEMRI signal. However, when neo-Timm densitometry was performed separately for each DG area, no differences in the hilus were identified between epileptic animals (with or without MFS) and their controls. In contrast, as shown in Fig. 3D-F, neo-Timm densitometry revealed significant differences in the supragranular layer between groups. These findings imply that the strong correlation between neo-Timm densitometry and MEMRI hyperintensity is specific to the supragranular region and indicative of MFS.
The specific mechanisms for the correlation between MEMRI hyperintensity produced by MnCl2 in epileptic animals and MFS remain to be established. However, several hypotheses may be considered based on electrophysiological and cellular findings. The first is related to the intracellular concentration of manganese. The increased contrast provided in vivo by Mn2 + is proportional to the ionic concentration entering excitable cells through voltage-gated calcium channels (Silva, et al. 2004), making the signal changes strongly dependent on the local density and/or activity of the cells. Thus, a possible explanation for the accumulation of Mn2+ in mossy fibers of epileptic animals could be due to the hyperexcitability induced by the cellular influx of Ca2+ in the epileptic condition. However, previous studies have shown that dentate granule cells become less excitable with mossy fiber sprouting progression (Harvey, et al. 2005); thus, the excitability of the dentate gyrus cannot be considered the key factor in manganese ion accumulation. A second possibility relates to the fact that as a divalent cation, Mn2+ can compete with and replace Zn2+ (Alvestad, et al. 2007), an abundant neuromodulator in mossy fiber synaptic buttons (Frederickson, et al. 1983). An increased concentration of Zn2+ associated with MFS could lead to increased Mn2+ and thus the increased MEMRI signal. Further research is needed to investigate this possibility.
5. Conclusion
Our results corroborate and reinforce the idea that MEMRI hyperintensity observed in chronic epileptic rats reflects MFS in the supragranular layer. In addition to the strong correlation between the MEMRI signal and the presence of MFS, we demonstrated that animals with suppressed MFS following CHX administration had no increased MEMRI signal in the DG. In summary, systemic injection of MnCl2 and subsequent MEMRI appears to be a promising technique for in vivo studies of MFS.
Acknowledgments
Financial Support: FAPESP CInAPCe Program 2005/56663-1 (CIERMag). J.M.M. was supported by an FAPESP fellowship 07/52911-6. This research was supported in part by the Intramural Research Program of the NIH, NINDS. We thank Vegeflora Extrações do Nordeste Ltda who kindly donated pilocarpine hydrochloride.
Footnotes
Disclosure of conflicts of interest
None of authors has any conflict of interest to disclose.
We affirm that we have read the Journal’s position on issues involved in ethical publication and affirm that this report is consistent with those guidelines.
References
- Alvestad S, Goa PE, Qu H, Risa O, Brekken C, Sonnewald U, Haraldseth O, Hammer J, Ottersen OP, Håberg A. In vivo mapping of temporospatial changes in manganese enhancement in rat brain during epileptogenesis. Neuroimage. 2007;38:57–66. doi: 10.1016/j.neuroimage.2007.07.027. [DOI] [PubMed] [Google Scholar]
- Amaral DG, Lavenex P. Hippocampal neuroanatomy. In: Andersen P, Morris R, Amaral DG, Bliss T, O’Keefe J, editors. The hippocampus book. Oxford University Press; 2007. pp. 37–114. [Google Scholar]
- Babb TL, Kupfer WR, Pretorius JK, Crandal PH, Levesque MF. Synaptic reorganizaton by mossy fibers in human epileptic fascia dentata. Neuroscience. 1991;42:351–363. doi: 10.1016/0306-4522(91)90380-7. [DOI] [PubMed] [Google Scholar]
- Babb TL, Pretorius JK, Kupfer W, Mathern GW, Crandal PH, Levesque MF. Aberrant synaptic reorganization in human epileptic hippocampus: evidence for feedforward excitation. Dendron. 1992;1:7–25. [Google Scholar]
- Ben-Ari Y. Limbic seizure and brain damage produced by kainic acid: mechanisms and relavance to human temporal lobe epilepsy. Neuroscience. 1985;14:375–403. doi: 10.1016/0306-4522(85)90299-4. [DOI] [PubMed] [Google Scholar]
- Bengzon J, Kokaia Z, Elmér E, Nanobashvili A, Kokaia M, Lindvall O. Apoptosis and proliferation of dentate gyrus neurons after single and intermittent limbic seizures. Proc Natl Acad Sci U S A. 1997;94:10432–10437. doi: 10.1073/pnas.94.19.10432. [DOI] [PMC free article] [PubMed] [Google Scholar]
- Bouilleret V, Nehlig A, Marescaux C, Namer IJ. Magnetic resonance imaging follow-up of progressive hippocampal changes in a mouse model of mesial temporal lobe epilepsy. Epilepsia. 2000;41:642–650. doi: 10.1111/j.1528-1157.2000.tb00223.x. [DOI] [PubMed] [Google Scholar]
- Briellmann RS, Jackson GD, Mitchell LA, Fitt GJ, Kim SE, Berkovic SF. Occurrence of hippocampal sclerosis: Is one hemisphere or gender more vulnerable? Epilepsia. 1999;40:1816–1820. doi: 10.1111/j.1528-1157.1999.tb01604.x. [DOI] [PubMed] [Google Scholar]
- Briellmann RS, Wellard RM, Masterton RAJ, Abbott DF, Berkovic SF, Jackson GD. Hippocampal sclerosis: MR prediction of seizure intractability. Epilepsia. 2007;48:315–323. doi: 10.1111/j.1528-1167.2006.00932.x. [DOI] [PubMed] [Google Scholar]
- Buckmaster PS, Dudek FE. Network properties of dentate gyrus in epileptic rats with hilar neuron loss and granule cell axon reorganization. J Neurophysiol. 1997;77:2685–2696. doi: 10.1152/jn.1997.77.5.2685. [DOI] [PubMed] [Google Scholar]
- Chang BS, Lowenstein DH. Epilepsy. N Engl J Med. 2003;349:1257–1266. doi: 10.1056/NEJMra022308. [DOI] [PubMed] [Google Scholar]
- Claiborne BJ, Rea MA, Terrian DM. Detection of zinc in isolated nerve terminals using a modified Timm’s sulphide-silver method. J Neurosci Methods. 1989;30:17–22. doi: 10.1016/0165-0270(89)90069-1. [DOI] [PubMed] [Google Scholar]
- Cook MJ, Fish DR, Shorvon SD, Straughan K, Stevens JM. Hippocampal volumetric and morphometric studies in frontal and temporal lobe epilepsy. Brain. 1992;115:1001–1015. doi: 10.1093/brain/115.4.1001. [DOI] [PubMed] [Google Scholar]
- Covolan L, Ribeiro L, Longo B, Mello L. Cell damage and neurogenesis in the dentate granule cell layer of adult rats after pilocarpine- or kainate-induced status epilepticus. Hippocampus. 2000;10:169–180. doi: 10.1002/(SICI)1098-1063(2000)10:2<169::AID-HIPO6>3.0.CO;2-W. [DOI] [PubMed] [Google Scholar]
- Cronin J, Dudek FE. Chronic seizures and collateral sprouting of dentate mossy fibers after kainic acid treatment in rats. Brain Res. 1988;474:181–184. doi: 10.1016/0006-8993(88)90681-6. [DOI] [PubMed] [Google Scholar]
- Danscher G. Histochemical demonstration of heavy metals. A revised version of the sulphide silver method suitable for both light and eletronmicroscopy. Histochemistry. 1981;71:1–16. doi: 10.1007/BF00592566. [DOI] [PubMed] [Google Scholar]
- Frederickson CJ, Klitenick MA, Manton WI, Kirkpatrick JB. Cytoarchitectonic distribution of zinc in the hippocampus of man and the rat. Brain Res. 1983;273:335–339. doi: 10.1016/0006-8993(83)90858-2. [DOI] [PubMed] [Google Scholar]
- Harvey BD, Sloviter RS. Hippocampal granule cell activity and c-Fos expression during spontaneous seizures in awake, chronically epileptic, pilocarpine-treated rats: implications for hippocampal epileptogenesis. J Comp Neurol. 2005;488(4):442–463. doi: 10.1002/cne.20594. [DOI] [PubMed] [Google Scholar]
- Immonen RJ, Kharatishvili I, Sierra A, Einula C, Pitkänen A, Gröhn OH. Manganese enhanced MRI detects mossy fiber sprouting rather than neurodegeneration, gliosis or seizure-activity in the epileptic rat hippocampus. Neuroimage. 2008;40:1718–1730. doi: 10.1016/j.neuroimage.2008.01.042. [DOI] [PubMed] [Google Scholar]
- Leite JP, Lemos T, Cavalheiro EA. Spontaneous seizures in rats is related to the intensity of hippocampal Timm’s staining. Epilepsia. 1991;32(Suppl 1):37. [Google Scholar]
- Longo BM, Mello LEAM. Blockade of pilocarpine- or kainate-induced mossy fiber sprouting by cycloheximide does not prevent subsequent epileptogenesis in rats. Neurosci Lett. 1997;226:163–166. doi: 10.1016/s0304-3940(97)00267-x. [DOI] [PubMed] [Google Scholar]
- Longo BM, Mello LEAM. Supragranular mossy fiber sprouting is not necessary for spontaneous seizures in the intrahippocampal kainate model of epilepsy in the rat. Epilepsy Res. 1998;32:172–182. doi: 10.1016/s0920-1211(98)00049-7. [DOI] [PubMed] [Google Scholar]
- Longo BM, Sanabria ER, Gabriel S, Mello LE. Electrophysiologic abnormalities of the hippocampus in the pilocarpine/cycloheximide model of chronic spontaneous seizures. Epilepsia. 2002:203–208. doi: 10.1046/j.1528-1157.43.s.5.4.x. [DOI] [PubMed] [Google Scholar]
- Mello LE, Cavalheiro EA, Tan AM, Kupfer WR, Pretorius JK, Babb TL, Finch DM. Circuit mechanisms of seizures in the pilocarpine model of chronic epilepsy: cell loss and mossy fiber sprouting. Epilepsia. 1993;34:985–995. doi: 10.1111/j.1528-1157.1993.tb02123.x. [DOI] [PubMed] [Google Scholar]
- Nairismägi J, Pitkäen A, Narkilahti S, Huttunen J, Kauppinen RA, Gröhn OHJ. Manganese-enhanced magnetic resonance imaging of mossy fiber plasticity in vivo. Neuroimage. 2005;30:130–135. doi: 10.1016/j.neuroimage.2005.09.007. [DOI] [PubMed] [Google Scholar]
- Niessen HG, Angenstein F, Vielhaber S, Frisch C, Kudin A, Elger CE, Heinze H, Scheich H, Kunz WS. Volumetric magnetic resonance imaging of functionally relevant structural alterations in chronic epilepsy after pilocarpine-induced status epilepticus in rats. Epilepsia. 2005;46:1021–1026. doi: 10.1111/j.1528-1167.2005.60704.x. [DOI] [PubMed] [Google Scholar]
- Papoti D. Instituto de Física de São Carlos. Universidade de São Paulo; São Carlos: 2006. Transdutores de RF para experimentos de imagens de pequenos animais; p. 144. [Google Scholar]
- Parker GJM, Chard DT. Volume and atrophy. In: Tofts P, editor. Quantitative MR I of the brain: measuring changes caused by disease. Wiley; 2003. pp. 143–201. [Google Scholar]
- Paxinos G, Watson C. The rat brain in stereotaxic coordinates. Academic Press; 1998. [DOI] [PubMed] [Google Scholar]
- Racine R. Modification of seizure activity by electrical stimulation. II. Motor seizure. Electroencephalogr Clin Neurophysiol. 1972;32:281–294. doi: 10.1016/0013-4694(72)90177-0. [DOI] [PubMed] [Google Scholar]
- Schreiber S, Tocco G, Najm I, Thompson R, Baudry M. Cycloheximide prevents kainate-induced neuronal death and c-fos expression in adult rat brain. J Molec Neurosci. 1993;4:149–159. doi: 10.1007/BF02782498. [DOI] [PubMed] [Google Scholar]
- Shin C, McNamara JO. Mechanism of epilepsy. Annu Rev Med. 1994;45:379–389. doi: 10.1146/annurev.med.45.1.379. [DOI] [PubMed] [Google Scholar]
- Silva AC, Lee JH, Aoki I, Korestky AP. Manganese-enhanced magnetic resonance imaging (MEMRI): methodological and pratical considerations. NMR Biomed. 2004;17:532–543. doi: 10.1002/nbm.945. [DOI] [PubMed] [Google Scholar]
- Sloviter RS. A simplified Timm stain procedure compatible with formaldehyde fixation and routine paraffin embedding of rat brain. Brain Res Bull. 1982;8:771–774. doi: 10.1016/0361-9230(82)90104-6. [DOI] [PubMed] [Google Scholar]
- Sutula T, Cascino G, Cavazos J, Parada I, Ramirez L. Mossy fiber synaptic reorganization in the epileptic human temporal lobe. Ann Neurol. 1989;26:321–330. doi: 10.1002/ana.410260303. [DOI] [PubMed] [Google Scholar]
- Tauck DL, Nadler JV. Evidence of functional mossy fiber sprouting in hippocampal formation of kainic acid-treated rats. J Neurosci. 1985;5:1016–1022. doi: 10.1523/JNEUROSCI.05-04-01016.1985. [DOI] [PMC free article] [PubMed] [Google Scholar]
- Toyoda I, Buckmaster PS. Prolonged infusion of cycloheximide does not block mossy fiber sprouting in a model of temporal lobe epilepsy. Epilepsia. 2005;46:1017–1020. doi: 10.1111/j.1528-1167.2005.04605.x. [DOI] [PubMed] [Google Scholar]
- Turski L, Ikonomidou C, Turski WA, Bortolotto ZA, Cavalheiro EA. Cholinergic mechanisms and epileptogenesis. The seizures induced by pilocarpine: a novel experimental model of intractable epilepsy. Synapse. 1989;3:154–171. doi: 10.1002/syn.890030207. [DOI] [PubMed] [Google Scholar]
- Van Paesschen W, Sisodyia S, Connelly A, Duncan JS, Free SL, Raymond AA. Quantitative hippocampal MRI and intractable temporal lobe epilepsy. Neurology. 1995;45:2233–2240. doi: 10.1212/wnl.45.12.2233. [DOI] [PubMed] [Google Scholar]
- Williams PA, Wuarin JP, Dou P, Ferraro DJ, Dudek FE. Reassessment of the effects of cycloheximide on mossy fiber sprouting and epileptogenesis in the pilocarpine model of temporal lobe epilepsy. J Neurophysiol. 2002;88:2075–2087. doi: 10.1152/jn.2002.88.4.2075. [DOI] [PubMed] [Google Scholar]
- Wolf OT, Dyakin V, Patel A, Vadasz C, de Leon MJ, McEwen BS, Bulloch K. Volumetric structural magnetic resonance imaging (MRI) of the rat hippocampus following kainic acid (KA) treatment. Brain Res. 2002;934:87–96. doi: 10.1016/s0006-8993(02)02363-6. [DOI] [PubMed] [Google Scholar]