Abstract
When compared to spleen or lymph node cells, resident peritoneal cavity cells respond poorly to T-cell activation in vitro. The greater proportional representation of macrophages in this cell source has been shown to actively suppress the T-cell response. Peritoneal macrophages exhibit an immature phenotype (MHC class IIlo, B7lo) that reduces their efficacy as antigen-presenting cells. Furthermore, these cells readily express inducible nitric oxide synthase (iNOS), an enzyme that promotes T-cell tolerance by catabolism of the limiting amino acid arginine. Here, we investigate the ability of exogenous T-cell costimulation to recover the peritoneal T-cell response. We show that CD28 ligation failed to recover the peritoneal T-cell response and actually suppressed responses that had been recovered by inhibiting iNOS. As indicated by cytokine ELISpot and neutralizing monoclonal antibody (mAb) treatment, this ‘cosuppression' response was due to CD28 ligation increasing the number of interferon (IFN)-γ-secreting cells. Our results illustrate that cellular composition and cytokine milieu influence T-cell costimulation biology.
Keywords: CD28, costimulation, macrophages, suppression
Introduction
Collaboration between antigen-presenting cells (APCs) and T lymphocytes is a key checkpoint in the regulation of adaptive immunity. T-cell activation requires that APCs provide two signals: processed (peptide) antigen complexed with the class II major histocompatibility complex (MHC) to engage the T-cell receptor (signal 1) and a costimulatory signal via CD80/86 (B7) engagement of CD28 on the T cell (signal 2).1, 2 Since the T-cell receptor and CD28 are expressed constitutively by resting/naive T cells appropriate APC expression of class II MHC and B7 molecules is a major checkpoint for controlling T-cell activation. Improper expression of these receptor ligand combinations can promote T-cell anergy or apoptosis.3 The great majority of costimulation studies are conducted in vitro with low APC/T cell ratios inherent to the natural composition of conventional lymphoid tissue.4 There has been little investigation of the effect high APC/T cell ratios could have on T-cell activation. This is important to consider because of the paralyzed T-cell function seen in tumor microenvironments enriched with immunosuppressive, myeloid cells.5
High myeloid/T cell ratios temper T-cell function, both at the end of normal immune responses and in tumors where essential T-cell effector functions have been abrogated.6, 7, 8, 9, 10, 11 APCs dampen T-cell function by several means, including the expression of enzymes that consume critical amino acids, production of immunoregulatory hormones and cytokines, and generation of regulatory T cells.7, 9, 12 We have shown that cultures of peritoneal cavity (PerC) cells inherently have high macrophage (Mφ) to T cell ratios (Mφ/T).4, 13 Interferon (IFN)-γ released by activated T cells triggers the Mφs to express indoleamine 2,3-dioxygenase (IDO) and inducible nitric oxide synthase (iNOS), enzymes that inhibit T-cell activation by depleting tryptophan and arginine.12, 13, 14 With their naturally high Mφ/T cell ratios, these cultures mimic an essential feature of tumor microenvironments. This provides a model to assess immunomodulatory strategies for promoting immunity under conditions of myeloid suppression.
In the studies described herein, we determined whether costimulation could increase the PerC T-cell response liberated by inhibiting iNOS. Since PerC Mφs have an immature phenotype (MHC class IIlo, B7lo), we reasoned that CD28 ligation would costimulate T cells in these cultures.13, 15 In contrast, we found that CD28 ligation suppressed the T-cell proliferative response. This observation is discussed with respect to the consideration of myeloid/lymphoid ratios in experimental design when assessing the efficacy of immunomodulatory drugs.
Materials and methods
Mice
Two- to four-month-old male and female mice, bred and maintained at Rider University, were handled in accord with NIH, Animal Welfare Act and Rider University IACUC guidelines. Breeding pairs of BALB/c, C57BL/6J, IFN-γRKO (B6.129S7Ifngr/J), IL-10KO (B6.129P2-IL-10tm1Cyn/J), iNOSKO (B6.129P2-Nos2tm1Lau/J), CD28KO (B6.129S2-Cd28tm1Mak/J), CD40KO (B6.129P2-Cd40tm1Kik/J) and CD80/86KO or B7KO (B6.129S4-Cd80tm1ShrCd86tm2Shr/J) mice were obtained from the Jackson Laboratory (Bar Harbor, ME, USA). PDL1KO mice were provided by the laboratory of Dr Arlene Sharpe, Harvard Medical School (Cambridge, MA, USA).
Preparation of cell suspensions and cell culture
Lymph node (LN) cell suspensions were obtained by gentle disruption of the organ between the frosted ends of sterile glass slides. PerC cells were obtained by flushing the peritoneum with 10 ml warm (37°C) Hanks Balanced Salt Solution supplemented with 3% fetal calf serum (Hyclone, Logan, UT, USA). Viable cell counts were determined by Trypan blue exclusion. Various dilutions (0.33×10⁶–4.0×10⁶/ml) of cells, in RPMI-1640 culture media (Life Technologies, Grand Island, NY, USA) supplemented with 10% fetal calf serum, 0.1 mM nonessential amino acids, 100 U/ml penicillin, 100 µg/ml streptomycin, 50 µg/ml gentamicin, 2 mM L-glutamine, 2×10⁻⁵ M 2-ME and 10 mM HEPES, were incubated in a humidified atmosphere of 5% CO2 at 37°C in 96-well ‘U'-, ‘V'- or flat-bottom microtiter plates (Corning Costar, Fisher Scientific, Pittsburgh, PA). For anti-CD3 stimulation soluble anti-CD3ε monoclonal antibody (mAb) (clone 145-2C11)16 (eBioscience, San Diego, CA, USA), was added at 1.0 µg/ml. Where exogenous costimulation was tested anti-CD28 (clone 37.51),17 or an isotype-matched hamster IgG control (eBioscience) was added at 1.0 µg/ml or B7.1-Fc or B7.2-Fc (R&D Systems, Minneapolis, MN, USA) were added at 5.0–10.0 µg/ml. Mitogen (concanavalin A (ConA)) and superantigen (Staphylococcal enterotoxin B (SEB)) (Sigma Chemical, St Louis, MO, USA) were added at 2 and 5 µg/ml, respectively. Anti-IFN-γ mAb (XMG1.2; eBioscience) or anti-IL-10 mAb (JES5-2A5; eBioscience) at 5–10 µg/ml were added at culture initiation. Based on prior studies, to inhibit arginine catabolism in IFN-γRKO mice the arginase (ARG) inhibitor N-w-hydroxy-nor-L-arginine (1-NA; CalBiochem, San Diego, CA, USA) was added; to inhibit arginine catabolism in C57BL/6J mice the iNOS inhibitor NG-monomethyl-L-arginine (1-MA; CalBiochem) was added.12, 13 Optimal concentrations of all reagents were determined in titration experiments. Proliferative responses were measure by adding 1 µCi of [3H] thymidine (Moravek Radiochemicals, Brea, CA, USA) after 44 h of incubation. The plates were frozen 4 h after radiolabeling, then thawed for harvesting onto filter paper mats using a semi-automated cell harvester (Skatron Instruments, Richmond, VA, USA). Radioactivity was measured by liquid scintillation spectrometry. For each experiment, 3–5 wells were established for each test group.
IFN-γ ELISpot
Following overnight incubation of cells plated as described above, IFN-γ ELISpot assays were conducted as described by the manufacturer (eBioscience).
Statistical analysis and costimulation index (CI)
T-cell proliferative responses or number of IFN-γ-secreting cells (IFN-γSCs) are presented as the average c.p.m. or cell number±SEM. All data sets were compared using the Student's t-test with P values below 0.05 defined as significant. The costimulation (or cosuppression when values <1.0) index is defined as the average costimulated (CD3+CD28 stimulation) c.p.m. divided by the average control (CD3 stimulation alone) c.p.m. All results are representative of at least three or more independent experiments that generated statistically valid results each time they were conducted.
Results
CD28 ligation costimulates LN but not PerC T cells
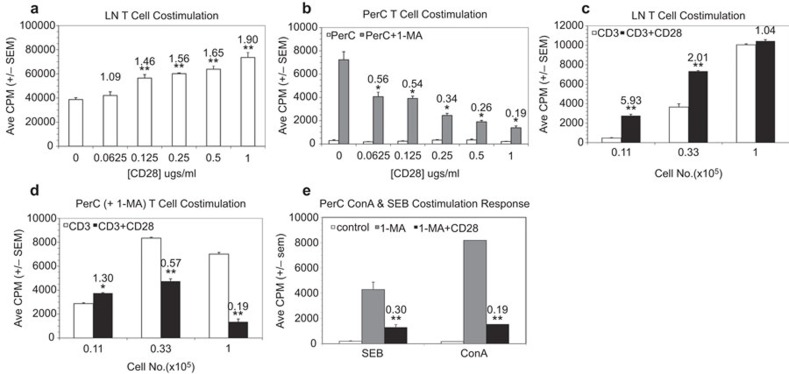
Prior research has shown that resident Mφs suppress the activation of PerC T cells.4, 13 Mφ-mediated suppression in C57BL/6J PerC cell culture is blocked by the addition of the iNOS inhibitor 1-MA. Considering that resident PerC Mφs are CD80lo, CD86lo we reasoned that T-cell costimulation was limiting and that CD28 ligation could enhance the T-cell activation evidenced in PerC cell cultures treated with 1-MA.13 However, the opposite result was observed. While LN cell suspensions responded with an increase in T-cell proliferation to increasing concentrations of anti-CD28 (P<0.005; Figure 1a), PerC cells exhibited a progressively diminished response (P<0.05) relative to the control (1-MA alone, no costimulation; Figure 1b). Although a modest costimulatory response resulted from reducing the number of PerC cells cultured this did not approach that seen with LN cells (Figure 1c versus Figure 1d; Table 1). Cosuppression was most evident in PerC cultures that increased Mφ–T cell interaction (‘U'-bottom>‘V'-bottom>flat-bottom microtiter wells; Table 1). These results illustrate that cell culture composition and density can impact interpretation of T-cell costimulation biology.
Figure 1.
CD28 ligation costimulates LN T-cell proliferation but suppresses the peritoneal cavity T-cell response. (a, b) Effect of anti-CD28 concentration. C57BL/6J LN (a) or PerC cells±1-MA (b) were cultured at 2×10⁵ cells per well with anti-CD3±CD28 costimulation. The numbers above the histograms are CIs which represent the average cpm for the costimulated response divided by the average CPM for the uncostimulated response; for PerC cells, CI values represent ratios of the costimulated PerC+1-MA response to the control (uncostimulated) PerC+1-MA response. *P<0.05; **P<0.005. The addition of 1-MA had no effect on LN T-cell proliferation; anti-CD28 in the absence of anti-CD3 had no effect on LN or PerC T-cell responses. (c, d) Effect of cell concentration on the CD28 costimulation response. Titered numbers of C57BL/6J LN or PerC cells+1-MA were cultured ±CD28 costimulation. CI values reflect comparisons within each cell concentration. (e) CD28 ligation cosuppresses the PerC T-cell response to SEB and ConA. 1.25×10⁵ PerC cells, ±1-MA, were cultured with SEB or ConA. CI values represent the ratios of the costimulated PerC+1-MA response to the control (uncostimulated) PerC+1-MA response. LN responses to SEB were 17 597±405 (−CD28) and 19 916±409 (+CD28) and to ConA were 42 977±4314 (−CD28) and 38 604±3395 (+CD28). Each experiment is representative of at least three independent experiments that yielded comparable, statistically valid results. CI, costimulation index; ConA, concanavalin A; LN, lymph node; PerC, peritoneal cavity; SEB, Staphylococcal enterotoxin B; 1-MA; NG-monomethyl-L-arginine.
Table 1. Costimulation indices for LN and PerC T cellsa.
| Lymph node cellsb | 0.66×10⁵/well | 0.22×10⁵/well | 0.07×10⁵/well |
|---|---|---|---|
| Flat-bottom | 1.35 | 5.44 | 14.28 |
| U-bottom | 1.31 | 1.61 | 3.14 |
| V-bottom | 1.32 | 1.61 | 2.01 |
| Peritoneal cells3 | 0.66×10⁵/well | 0.22×10⁵/well | 0.07×10⁵/well |
|---|---|---|---|
| Flat-bottom | 1.17 | 2.42* | 1.81 |
| U-bottom | 0.66* | 0.83 | 1.20 |
| V-bottom | 0.73* | 1.15 | 1.96* |
Abbreviations: LN, lymph node; PerC, peritoneal cavity.
C57BL/6J LN or PerC cells were cultured with anti-CD3+1-MA (PerC)±anti-CD28. CI values determined as described in the ‘Methods' section; P values reflect comparisons of ±costimulation. C57BL/6J LN cells were 2%–3% myeloid, 85%–90% lymphoid (58% CD3+, CD4/CD8=1.13); PerC cells were 40%–45% myeloid, 25%–30% lymphoid (18% CD3+, CD4/CD8=1.82).4
All LN values P<0.005.
*P<0.05.
CD28 ligation cosuppresses superantigen and CD3-independent T-cell activation
The high frequency of T cells responsive to CD3 ligation invited speculation as to whether a milder form of T-cell stimulation would also be susceptible to CD28-mediated cosuppression. This was the case with the superantigen SEB, which triggered T-cell proliferation in the presence of 1-MA and was cosuppressed by CD28 ligation (Figure 1e). T-cell activation independent of CD3 engagement was tested using the mitogenic plant lectin ConA. This response was also cosuppressed (Figure 1e) indicating that regardless of how T cells were activated, ligation of the CD28 receptor can, under myeloid-enriched conditions, restrain T-cell proliferation.
Cosuppression is not due to Fc binding by the anti-CD28 mAb
To address the possibility that the anti-CD28 mAb triggered suppression via Fc binding, a species- and isotype-matched, non-specific mAb was tested. Unlike the hamster anti-CD28 mAb 37.51, the hamster nonspecific control mAb failed to cosuppress T-cell proliferation (Figure 2a). PerC T cells from mice lacking the CD28 receptor (CD28KO) were not affected by addition of the CD28 mAb and the addition of 1-MA did not increase their proliferation (Figure 2a). Furthermore, the CD28-binding fusion proteins B7.1-Fc and B7.2-Fc both cosuppressed the T-cell proliferative response of C57BL/6J PerC cells (Figure 2b). These observations reinforced that the CD28 receptor can serve as a negative regulator of T-cell proliferation.
Figure 2.
CD28 triggered cosuppression is not due to Fc binding by the anti-CD28 mAb. (a) 1.25×10⁵ C57BL/6J or CD28KO PerC cells±1-MA were cultured with anti-CD3±anti-CD28 mAb costimulation or with an isotype- and species-matched, non-specific mAb. CI values represent the ratio of the costimulated PerC+1-MA response to the control (uncostimulated) PerC+1-MA response. *P<0.05; **P<0.005. (b) 1.0×10⁵ C57BL/6J PerC cells were cultured with anti-CD3+1-MA alone or with CD28, B7.1-Fc, or B7.2-Fc costimulation. CI values represent the ratio of the costimulated response to the control (1-MA alone) response. Each experiment is representative of four independent trials that produced similar results. CI, costimulation index; mAb, monoclonal antibody; PerC, peritoneal cavity; 1-MA; NG-monomethyl-L-arginine.
CD28 ligation cosuppresses BALB/c PerC T cells
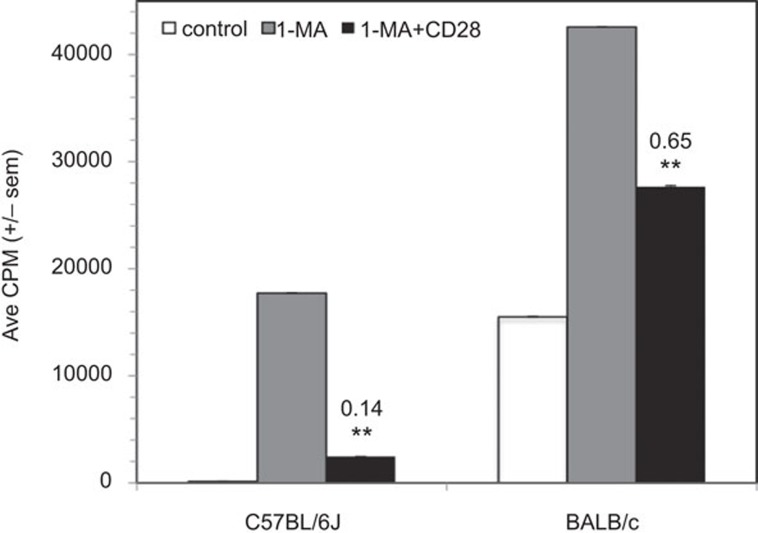
Prior research has shown that BALB/c PerC T cells are less suppressed by resident Mφ than those of C57BL/6J mice.4 Consistent with this observation, CD28 ligation cosuppressed BALB/c PerC T cells less than C57BL/6J PerC T cells (CI=0.65 versus 0.14; Figure 3). Regardless of the degree of cosuppression, this result illustrated that PerC T cells from two widely studied strains of mice exhibit reduced proliferative responses following CD28 ligation.18, 19
Figure 3.
CD28 ligation suppresses the BALB/c peritoneal cavity T-cell proliferative response. 1.5×10⁵ C57BL/6J or BALB/c PerC cells±1-MA were cultured with anti-CD3±anti-CD28. CI values represent the ratio of the CD28 costimulated response to the 1-MA alone response. *P<0.05; **P<0.005. The data presented are representative of six independent experiments that yielded similar results. CI, costimulation index; PerC, peritoneal cavity; 1-MA; NG-monomethyl-L-arginine.
Role of IFN-γ in CD28 cosuppression
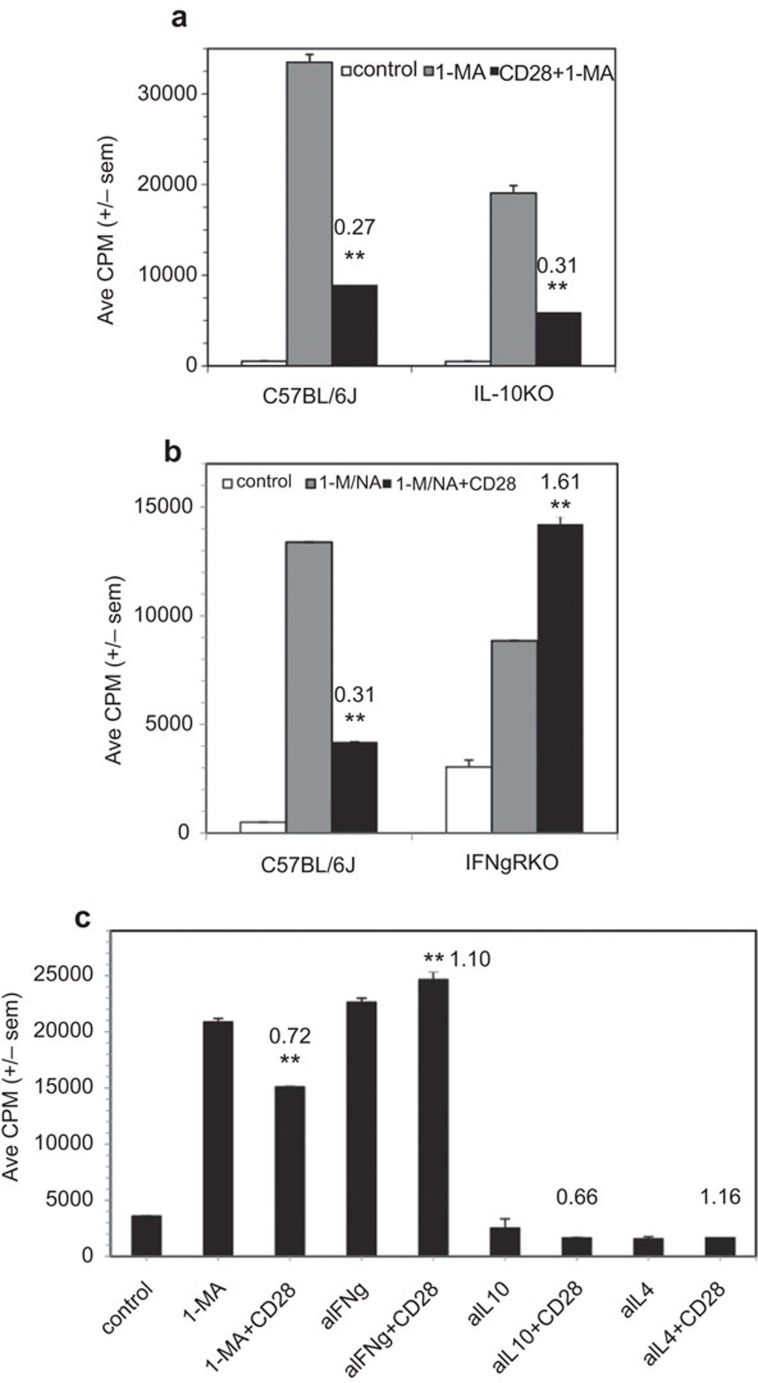
Since costimulation is known to increase T-cell cytokine production, we assessed whether increased production of a regulatory cytokine could be the mechanism for CD28-mediated cosuppression.20 IL-10 and IFN-γ are hallmark regulatory cytokines, so the role of these molecules was tested. The CD28-mediated cosuppression of PerC T cells from IL-10KO mice was no different than that seen for wild-type (C57BL/6J) mice (Figure 4a). In contrast, PerC T cells from IFN-γRKO mice were less suppressed by Mφs and were costimulated by CD28 ligation (Figure 4b). Direct evidence in C57BL/6J mice that IFN-γ plays a role in cosuppression was provided by the observation that the addition of a neutralizing anti-IFN-γ mAb released PerC T cells from Mφ suppression and negated CD28-mediated cosuppression. Neutralizing mAbs for IL-10 and IL-4 had no effect on recovering the T-cell proliferative response (Figure 4c).
Figure 4.
Role of IL-10 and IFN-γ in CD28 triggered cosuppression. (a) 1.5×10⁵ C57BL/6J or IL-10KO PerC cells±1-MA were cultured with anti-CD3±anti-CD28. (b) 1.5×10⁵ C57BL/6J PerC cells±1-MA or IFN-γRKO PerC cells±the arginase inhibitor 1-NA were stimulated with anti-CD3±anti-CD28. CI values represent the ratio of the CD28 costimulated response to the 1-MA or 1-NA (IFN-γRKO) alone response. The data presented are representative of three experiments with IL-10KO mice and seven with IFN-γRKO mice. (c) 1.25×10⁵ C57BL/6J PerC cells alone or with 1-MA or with neutralizing mAbs for either IFN-γ, IL-4 or IL-10, were cultured with anti-CD3±anti-CD28 costimulation. The CI values represent the ratios of the CD28 costimulated response to the 1-MA alone or the anticytokine mAb alone response. **P<0.005. The data presented are representative of five independent trials that yielded similar results. CI, costimulation index; IFN, interferon; mAb, monoclonal antibody; PerC, peritoneal cavity; 1-MA; NG-monomethyl-L-arginine; 1-NA, N-w-hydroxy-nor-L-arginine.
CD28 ligation increases the number of IFN-γSCs
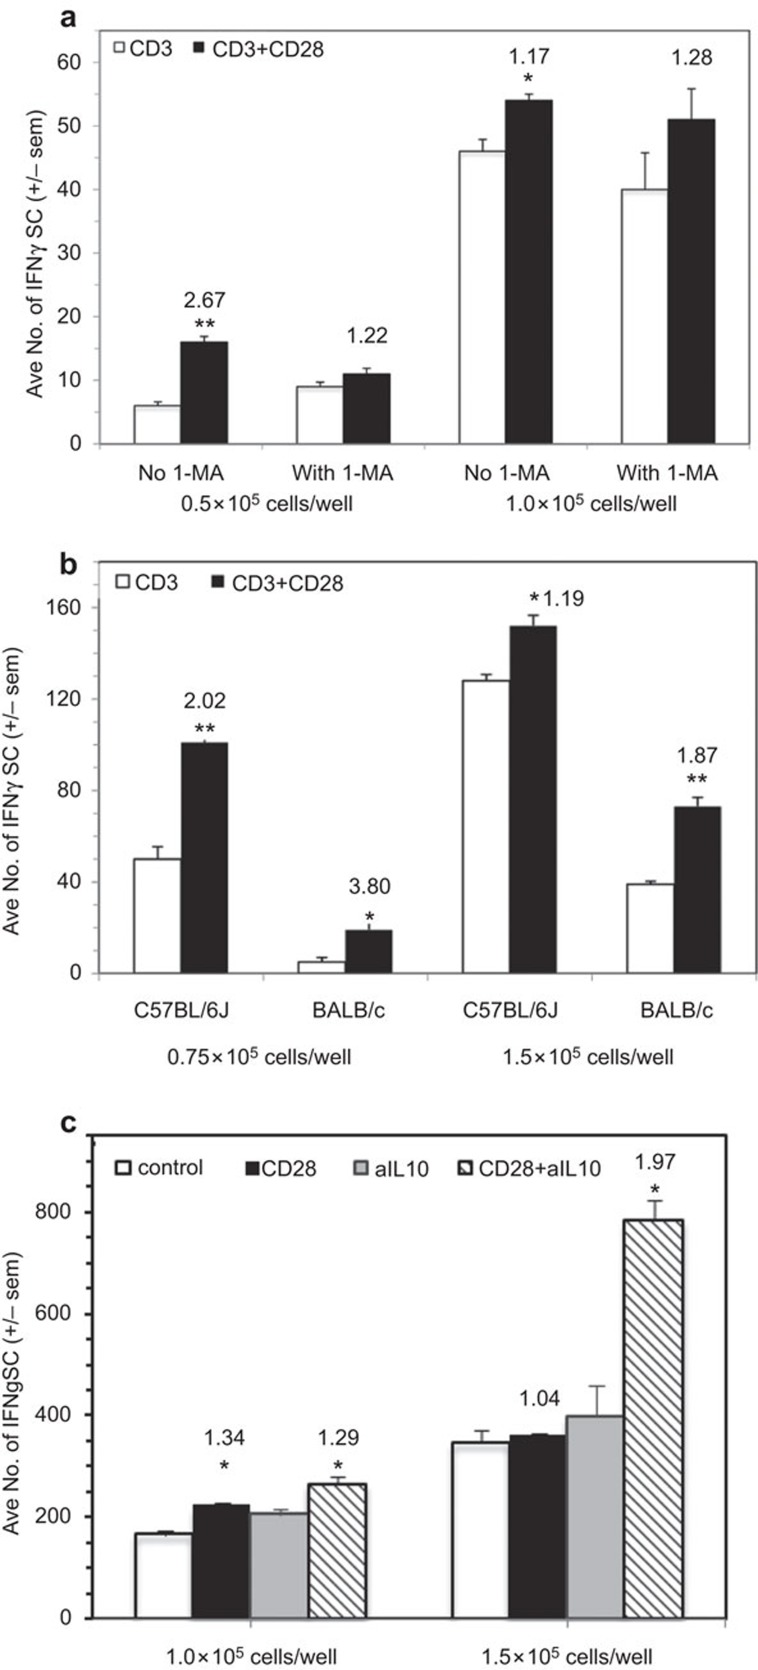
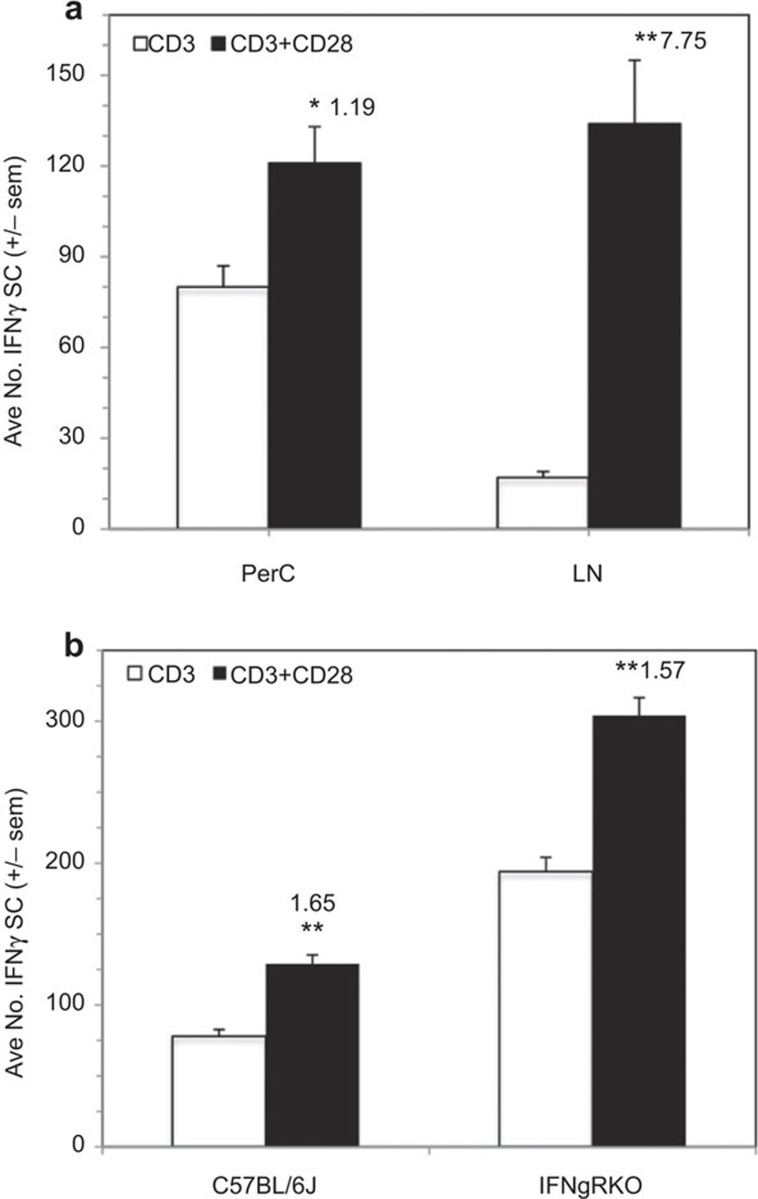
IFN-γ ELISpot assays were employed to measure the impact of CD28 ligation on IFN-γSC number. CD28 ligation costimulated an increase in the number of IFN-γSCs, particularly at low cell density, and the addition of 1-MA had little effect, particularly at increased cell density (Figure 5a). Consistent with the observation of less cosuppression of BALB/c PerC T-cell proliferation (Figure 3), there were fewer IFN-γSCs in this strain (Figure 5b). Although BALB/c PerC T cells consistently exhibited a greater costimulatory response, C57BL/6J PerC cells always had the greater number of IFN-γSCs (Figure 5b). C57BL/6J PerC cells exhibited the greatest numbers of IFN-γSCs, when a neutralizing anti-IL-10 mAb was included during their generation, particularly at high cell density (Figure 5c). However, the greatest costimulatory increase in IFN-γSC number followed CD28 ligation of LN cells (CI=7.75, Figure 6a). This increase occurred without suppression of LN T-cell proliferation (Figure 1). Likewise, IFN-γRKO PerC T cells, which had greater numbers of IFN-γSCs than C57BL/6J mice, were costimulated for both proliferation (Figure 4b) and IFN-γSC number (Figure 6b). These results illustrate that while CD28 ligation increases IFN-γSC production, both the cellular composition and the cytokine milieu of the culture determine whether the T cell proliferative response will be costimulated or cosuppressed.
Figure 5.
CD28 ligation increases the number of peritoneal cavity IFN-γ-SCs. (a) 0.5×10⁵ and 1.0×10⁵ C57BL/6J PerC cells±1-MA were cultured with anti-CD3±anti-CD28 as described in the ‘Methods' section. (b) 0.75×10⁵ and 1.5×10⁵ C57BL/6J or BALB/c PerC cells were cultured with anti-CD3±anti-CD28. (c) 1.0×10⁵ and 1.5×10⁵ C57BL/6J PerC cells alone or with a neutralizing anti-IL-10 mAb were cultured with anti-CD3 ±anti-CD28 costimulation. All CI values represent the ratio of the costimulated response to the uncostimulated response. *P<0.05; **P<0.005. The data shown are representative of three separate experiments that generated similar results. CI, costimulation index; IFN-γ-SC, interferon-γ-secreting cell; mAb, monoclonal antibody; PerC, peritoneal cavity.
Figure 6.
CD28 ligation increases IFN-γ-SC number for cells that exhibit a proliferative costimulatory response. (a) 1.5×10⁵ C57BL/6J PerC or LN cells were stimulated with anti-CD3±anti-CD28 costimulation. (b) 1.0×10⁵ C57BL/6J or IFN-γRKO PerC cells were stimulated with anti-CD3±anti-CD28 costimulation. CI values represent the ratio of the costimulated response to the uncostimulated response. *P<0.05; **P<0.005. The data shown are representative of three separate experiments that generated similar results. CI, costimulation index; IFN-γ-SC, interferon-γ-secreting cell; LN, lymph node; PerC, peritoneal cavity.
Role of cell surface molecules in CD28 receptor-mediated cosuppression
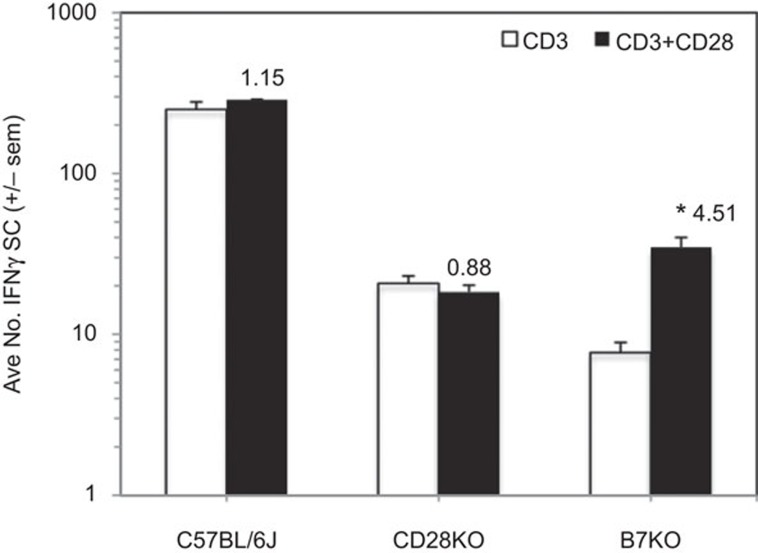
IFN-γ can increase the expression of molecules that either promote (CD40, CD80/B7.1, CD86/B7.2) or inhibit (CD274/B7H1/PDL1) T-cell activation.21 To determine if these molecules have a role in the T-cell biology described in the preceding experiments, the PerC cells of CD40KO, B7KO and PDL1KO mice were studied. While CD40KO and PDL1KO mice exhibited cosuppression analogous to that of C57BL/6J mice (Figure 7), the PerC T cells of B7KO mice were more similar to those of CD28KO mice (Figure 2a) in that the addition of 1-MA did not increase the T-cell proliferative response (Figure 7b). Furthermore, B7KO PerC T cell proliferation was costimulated by CD28 ligation. Both CD28KO and B7KO mice had fewer IFN-γSCs than wild-type C57BL/6J mice (Figure 8). Although costimulation significantly increased IFN-γSC number for the B7KO, the small number of these cells did not temper the proliferative response (Figure 7b). These data reinforce that the CD28-B7 receptor–ligand pathway can trigger immune suppression via increased production of IFN-γ.
Figure 7.
CD28 ligation cosuppresses peritoneal cavity T cells from CD40KO and PDL1KO mice but costimulates those from CD80/86KO (B7KO) mice. For both panels, 1.5×10⁵ PerC cells±1-MA were stimulated with anti-CD3±anti-CD28 costimulation. CI values represent the ratio of the CD28 costimulated response to the 1-MA treated, uncostimulated response. **P<0.005. The data shown are representative of three independent CD40KO experiments and eight separate PDL1KO experiments. CI, costimulation index; PerC, peritoneal cavity; 1-MA, NG-monomethyl-L-arginine.
Figure 8.
CD28KO and B7KO mice have low numbers of IFN-γ-SCs in their peritoneal cavity. PerC cells (1.5×10⁵) were stimulated with anti-CD3±anti-CD28. CI values represent the ratio of the CD28 costimulated response to the control response. *P<0.05. The data shown are representative of three separate trials that yielded similar data. IFN-γ-SC, interferon-γ-secreting cell; PerC, peritoneal cavity.
CD28 receptor-mediated cosuppression requires iNOS
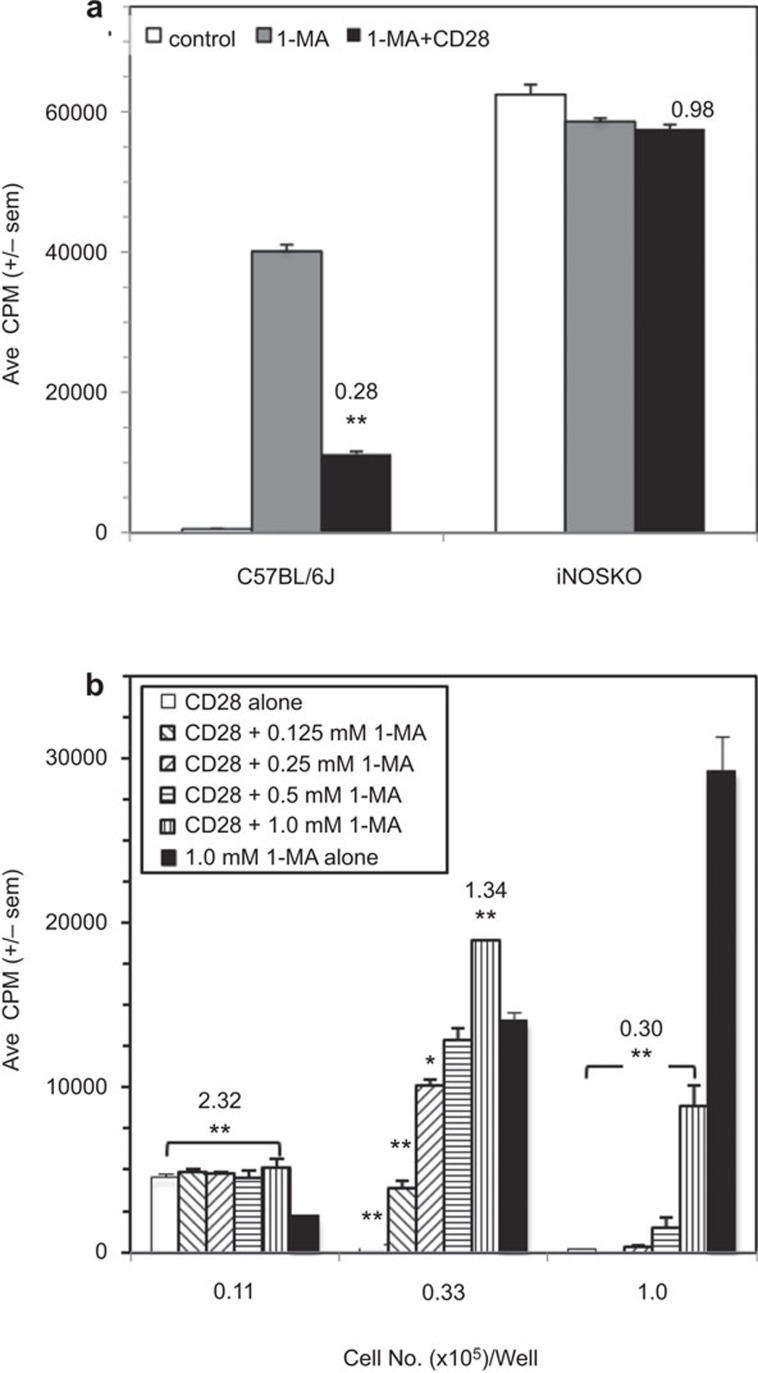
IFN-γ has been shown to inhibit T-cell proliferation by triggering Mφs to increase expression of the arginine-consuming enzyme iNOS.11, 13 To assess the role of iNOS in CD28-mediated cosuppression, PerC T cells from iNOSKO mice were studied. The data show that iNOS is essential for Mφ-mediated T-cell suppression and that CD28-triggered cosuppression does not occur for this strain (Figure 9a). As a direct test of the role of iNOS in C57BL/6J mice, their PerC cells were titered and tested for cosuppression with graded concentrations of the iNOS inhibitor 1-MA. The data show cosuppression at the highest (1.0×10⁵/well; CI≤0.30) and costimulation at the lower (0.33×10⁵ and 0.11×10⁵/well) concentrations of PerC cells tested (Figure 9b). However, cosuppression at the intermediate cell concentration (0.33×10⁵/well) returned as the inhibitor was diluted (CI values, relative to the 1 mM 1-MA control: CI1.0=1.34, CI0.5=0.91, CI0.25=0.72, CI0.125=0.28). There was only costimulation at the lowest PerC cell concentration (CI≥2.03). These data reinforce that iNOS is the mechanism for cosuppression and that cognate myeloid–lymphoid interaction is an essential element of this form of T-cell regulation.
Figure 9.
CD28 cosuppression requires iNOS. (a) 1.5×10⁵ C57BL/6J or iNOSKO PerC cells±1-MA were stimulated with anti-CD3±anti-CD28. CI values represent the ratio of the CD28 costimulated response to the 1-MA treated, uncostimulated response. (b) Titered numbers of C57BL/6J PerC cells cultured either alone or with titered concentrations of 1-MA, were stimulated with anti-CD3±anti-CD28. CI values represent the ratio of the CD28 costimulated response to the 1-MA treated, uncostimulated response at the highest 1-MA concentration (1.0 mM). For both panels, *P<0.05; **P<0.005. The arrows in (b) indicate that the P values carry down the 1-MA titration series. The data shown in (a) are representative of five similar experiments, for (b) for three similar experiments. CI, costimulation index; iNOS, inducible nitric oxide synthase; PerC, peritoneal cavityl; 1-MA, NG-monomethyl-L-arginine.
Discussion
The failure of PerC T cells to proliferate in response to CD3 ligation is not an intrinsic T-cell defect nor due to APC immaturity as T-cell purification and PerC cell titration can rescue this response (Figure 1d).4, 13 A surplus of natural costimulation, due to increased formation of immunological synapses inherent to the APC-rich composition of PerC cells, triggered a natural ‘braking system' with IFN-γ production promoting iNOS expression, arginine catabolism and lymphocyte proliferative paralysis.11, 14 CD28 ligation, rather than reversing this pathway, supplemented the natural costimulatory response and increased IFN-γ production and immune paralysis. This ‘cosuppression' revealed the significance of the myeloid/lymphoid composition of the cellular preparation targeted for costimulation. This observation is particularly relevant to current efforts to deploy immunomodulatory drugs to amend the aberrant immune regulation that is a hallmark of myeloid-rich tumor microenvironments.22 In vitro screening assays that can reproduce the immunosuppressive elements of tumor microenvironments will be essential to facilitate effective drug development.5, 10, 23, 24, 25, 26, 27, 28
The same anti-CD28 mAb (clone 37.51)17 that all prior in vitro research has revealed as costimulatory has been shown to inhibit T-cell expansion and cytokine production in vivo.29, 30, 31 Another anti-CD28 mAb (clone JJ319)32 tempers acute graft-versus-host disease.33, 34, 35 In these studies, CD28 blockade was thought to promote allograft tolerance by negating CD28/B7 interaction or by allowing CTLA-4/B7 interaction to costimulate IFN-γ production and IDO/iNOS expression.31, 34, 35 Since CTLA-4 ligation has been shown to restrict IFN-γ production, the tolerance observed more likely reflects a cosuppressive response, a hypothesis validated by research showing that in vivo administration of the 37.51 mAb activated T cells to produce the IFN-γ essential for tolerance.31, 36 Likewise, increased numbers of IFN-γSCs and regulatory T cells (Tregs) were noted following in vivo administration of the anti-CD28 mAb E18 and a monovalent Ab (Sc28AT) promoted allograft tolerance by increasing IDO and Tregs.37, 38 PerC Tregs are not a factor with in vitro cosuppression, because PerC cells from T cell-deficient nude and scid mice suppress exogenous T-cell proliferation via iNOS.13 The generation of Foxp3+ T cells is unlikely in short-term culture, particularly with IFN-γ and nitric oxide suppressing their generation.14, 39, 40, 41, 42 There is evidence, however, that IFN-γ-generated regulatory APCs can promote Treg development, a factor more likely in longer term, in vivo models of T-cell tolerance.43, 44
In vivo administration of 37.51 to BALB/c mice afforded protection from lethal septic shock via IL-10-mediated inhibition of tumor-necrosis factor-α production.45 This observation is consistent with the T-cell cytokine biology of BALB/c (Th2/IL-10) versus (Th1/IFN-γ) C57BL/6J mice. The lower number of IFN-γSCs and less cosuppression witnessed with BALB/c PerC cells (Figures 3 and 5b) could be due to cytokine antagonism via autocrine IL-10 production by PerC B-1 B cells or Bregs.23, 46 In support of this premise, B-1 B cell-deficient BALB.xid mice have PerC IFN-γSC numbers more similar to C57BL/6J mice rather than to BALB/c mice and exhibit cosuppression responses most like C57BL/6J mice.4 IL-10 still restrained PerC IFN-γSC production in C57BL/6J mice, particularly at higher cell density (Figure 5c). These results reinforce that culture density and cellular composition are important factors when interpreting T-cell suppression biology. Although the resolution of T cells into Th1/Th2/Th17/Treg subsets is well established, the functional plasticity of Mφs confounds their simple categorization as classically (M1) or alternatively activated (M2) cells.11, 47, 48 There is growing appreciation for the heterogeneity of myeloid cells being a key factor in the generation of distinct T-cell subsets.49
Direct evidence that the CD28/B7 pathway can temper immunity came with the observation that CD28KO and B7KO PerC T cells were not suppressed at culture densities that tempered C57BL/6J and PDL1KO T-cell proliferation (Figures 2 and 7). Peripheral T-cell viability depends upon the CD28/B7 pathway as both CD28KO and B7KO mice had reduced numbers of PerC CD4+ and CD8+ T cells relative to C57BL/6J controls.4 PerC IFN-γSC numbers were low for both of these mutants (Figure 8) and 1-MA was not required to inhibit iNOS and reveal their proliferative response (Figure 7). Even with costimulation, B7KO PerC IFN-γSC numbers did not reach the levels seen with BALB/c mice, which were sufficient to temper T-cell proliferation. Although the greatest number of IFN-γSCs were found in IFN-γRKO mice their PerC T cells responded to anti-CD3 and were costimulated by CD28 ligation (Figure 6b) revealing the critical role of IFN-γ signaling for suppression. Although these results suggest that T cells can be expanded in Mφ-rich environments, these cells may not be the IFN-γ-dependent effectors required for an optimal anti-tumor response.41, 50, 51
That PDL1KO PerC T cells were suppressed was surprising considering that PDL1 expression has been shown to restrict T-cell activation in lymphoid and normal tissue, as well as in tumors.52, 53, 54 Since PDL1 costimulates IL-10 production the absence of this ligand likely enhanced IFN-γ production and thus cosuppression (Figure 5c).55 In a similar fashion, fibroblastic reticular cells from PDL1KO mice were recently shown to have increased IFN-γ-dependent, iNOS-mediated T-cell suppression relative to wild-type control cells.56 Although the CI was lower for PDL1KO PerC T cells relative to the C57BL/6J control (Figure 7b), the proliferative differences were not statistically significant between these groups. Prior research has shown that neutralization of PDL1 on BALB/c Mφs leads to T-cell proliferative arrest by increasing IFN-γ/iNOS production; however, CD28 costimulation was not assessed in this study.57 Although these results suggest that PDL1 is not a significant factor in IFN-γ-/Mφ-mediated suppression, this molecule and other B7 homologs are clearly important in other regulatory pathways.2, 54, 58, 59, 60, 61 The complexity and variety of T cell–APC and T cell–T cell interactions among the B7 family members insure that there is more to learn regarding this important family of costimulatory/co-inhibitory molecules.2, 59, 60, 61
In summary, depending upon the myeloid composition of the target tissue, CD28 ligation can suppress rather than costimulate T-cell proliferation. Although this pathway may be more potent than CTLA-4-Ig in controlling T-cell activation, the ‘cytokine storm' that ensued following in vivo trials of a superagonist anti-CD28 mAb might have tempered enthusiasm for this strategy.31, 62, 63 This case certainly has made it clear that additional models must be developed to assess the safety of immunomodulatory biopharmaceuticals.64, 65, 66, 67
Acknowledgments
This work was supported by grants (R15 AI 060356-01, R15 CA 136901-01) to J Riggs from the NIH AREA program. D Silberman was supported by fellowships from the New Jersey Commission for Cancer Research and the Rider University Marvin Talmadge Memorial Research Fund. A Walker was supported by a Rider University Undergraduate Research Scholar Award and was the recipient of a Van Arman Scholarship Award from the Inflammation Research Association. We are grateful to A Sepulveda, S Wisniewski, S Homan and D Marshall for mouse husbandry.
References
- Schwartz R, Mueller D, Jenkins M, Quill H. T cell clonal anergy. Cold Spring Harbor Symp Quant Biol. 1989;54:605–610. doi: 10.1101/sqb.1989.054.01.072. [DOI] [PubMed] [Google Scholar]
- Greenwald R, Freeman G, Sharpe A. The B7 family revisited. Ann Rev Immunol. 2005;23:515–548. doi: 10.1146/annurev.immunol.23.021704.115611. [DOI] [PubMed] [Google Scholar]
- Manicassamy S, Pulendran B. Dendritic cell control of tolerogenic responses. Immunol Rev. 2011;241:206–227. doi: 10.1111/j.1600-065X.2011.01015.x. [DOI] [PMC free article] [PubMed] [Google Scholar]
- Composto G, Gonzalez D, Bucknum A, Silberman D, Taylor J, Kozlowski M, et al. Peritoneal T lymphocyte regulation by macrophages. Immunobiology. 2011;216:256–264. doi: 10.1016/j.imbio.2010.04.002. [DOI] [PMC free article] [PubMed] [Google Scholar]
- Nagaraj S, Gabrilovich D. Myeloid-derived suppressor cells in human cancers. Cancer J. 2010;16:348–353. doi: 10.1097/PPO.0b013e3181eb3358. [DOI] [PubMed] [Google Scholar]
- Hopken U, Lehmann I, Droese J, Lipp M, Schuler T, Rehm A. The ratio between dendritic cells and T cells determines the outcome of their encounter: proliferation versus deletion. Eur J Immunol. 2005;35:2851–2863. doi: 10.1002/eji.200526298. [DOI] [PubMed] [Google Scholar]
- Pollard J. Tumour-educated macrophages promote tumour progression and metastasis. Nat Rev Cancer. 2004;4:71–78. doi: 10.1038/nrc1256. [DOI] [PubMed] [Google Scholar]
- Drake C, Jaffee E, Pardoll D. Mechanisms of immune evasion by tumors. Adv Immunol. 2006;90:51–81. doi: 10.1016/S0065-2776(06)90002-9. [DOI] [PubMed] [Google Scholar]
- Rabinovich G, Gabrilovich D, Sotomayor E. Immunosuppressive strategies that are mediated by tumor cells. Ann Rev Immunol. 2007;25:267–296. doi: 10.1146/annurev.immunol.25.022106.141609. [DOI] [PMC free article] [PubMed] [Google Scholar]
- Denning T, Norris B, Medina-Contreras O, Manicassamy S, Geem D, Madan R, et al. Functional specialization of intestinal dendritic cell and macrophage subsets that control Th17 and regulatory T cell responses are dependent on the T cell/APC ratio, source of mouse strain, and regional localization. J Immunol. 2011;187:733–747. doi: 10.4049/jimmunol.1002701. [DOI] [PMC free article] [PubMed] [Google Scholar]
- Zhu B, Kennedy J, Wang Y, Sandoval-Garcia C, Cao L, Xiao S, et al. Plasticity of Ly-6Chi myeloid cells in T cell regulation. J Immunol. 2011;187:2418–2432. doi: 10.4049/jimmunol.1100403. [DOI] [PMC free article] [PubMed] [Google Scholar]
- Bronte V, Zanovello P. Regulation of immune responses by L-arginine metabolism. Nat Rev Immunol. 2005;5:641–654. doi: 10.1038/nri1668. [DOI] [PubMed] [Google Scholar]
- Matlack R, Yeh K, Rosini L, Gonzalez D, Taylor J, Silberman D, et al. Peritoneal macrophages suppress T-cell activation by amino acid catabolism. Immunology. 2006;117:386–395. doi: 10.1111/j.1365-2567.2005.02312.x. [DOI] [PMC free article] [PubMed] [Google Scholar]
- Hamilton M, Antiganano F, Rossum A, Boucher J, Bennewith K, Krystal G. TLR agonists that induce IFN-β abrogate resident macrophage suppression of T cells. J Immunol. 2010;185:4545–4553. doi: 10.4049/jimmunol.1002045. [DOI] [PubMed] [Google Scholar]
- Lagasse E, Weissman I. Flow cytometric identification of murine neutrophils and monocytes. J Immunol Meth. 1996;197:139–150. doi: 10.1016/0022-1759(96)00138-x. [DOI] [PubMed] [Google Scholar]
- Leo O, Foo M, Sachs D, Samelson L, Bluestone J. Identification of a monoclonal antibody specific for a murine T3 polypeptide. Proc Natl Acad Sci. 1987;84:1374–1378. doi: 10.1073/pnas.84.5.1374. [DOI] [PMC free article] [PubMed] [Google Scholar]
- Gross J, Callas E, Allison J. Identification and distribution of the costimulatory receptor CD28 in the mouse. J Immunol. 1992;149:380–388. [PubMed] [Google Scholar]
- Potter M. History of the BALB/c family. Curr Top Microbiol Immunol. 1985;122:1–5. doi: 10.1007/978-3-642-70740-7_1. [DOI] [PubMed] [Google Scholar]
- Paigen K. One hundred years of mouse genetics: an intellectual history. I. The classical period (1902–1980) Genetics. 2003;163:1–7. doi: 10.1093/genetics/163.1.1. [DOI] [PMC free article] [PubMed] [Google Scholar]
- Rochford R, Riggs J, Clavo A, Ernst D, Hobbs M. Differential effect of CD28 costimulation upon cytokine production by CD4+ and CD8+ T cells. Immunobiology. 2004;209:513–522. doi: 10.1016/j.imbio.2004.05.004. [DOI] [PubMed] [Google Scholar]
- Zou W, Chen L. Inhibitory B7-family molecules in the tumour microenvironment. Nat Rev Immunol. 2008;8:467–477. doi: 10.1038/nri2326. [DOI] [PubMed] [Google Scholar]
- Quezada S, Peggs K, Simpson T, Allison J. Shifting the equilibrium in cancer immunoediting: from tumor tolerance to eradication. Immunol Rev. 2011;241:104–18. doi: 10.1111/j.1600-065X.2011.01007.x. [DOI] [PMC free article] [PubMed] [Google Scholar]
- Bouaziz JD, Yanaba K, Tedder T. Regulatory B cells as inhibitors of immune responses and inflammation. Immunol Rev. 2008;224:201–214. doi: 10.1111/j.1600-065X.2008.00661.x. [DOI] [PubMed] [Google Scholar]
- Nishikawa H, Sakaguchi S. Regulatory T cells in tumor immunity. Int J Cancer. 2010;127:759–67. doi: 10.1002/ijc.25429. [DOI] [PubMed] [Google Scholar]
- Munn D. Indoleamine 2,3-dioxygenase, tumor-induced tolerance and counter-regulation. Curr Opin Immunol. 2006;18:220–225. doi: 10.1016/j.coi.2006.01.002. [DOI] [PubMed] [Google Scholar]
- Balkwill F, Charles K, Mantovani A. Smoldering and polarized inflammation in the initiation and promotion of malignant disease. Cancer Cell. 2005;7:211–217. doi: 10.1016/j.ccr.2005.02.013. [DOI] [PubMed] [Google Scholar]
- Martin-Orozco N, Dong D. Inhibitory costimulation and anti-tumor immunity. Semin Cancer Biol. 2007;17:288–96. doi: 10.1016/j.semcancer.2007.06.003. [DOI] [PMC free article] [PubMed] [Google Scholar]
- Wherry J. T cell exhaustion. Nat Immunol. 2011;12:492–499. doi: 10.1038/ni.2035. [DOI] [PubMed] [Google Scholar]
- Krummel M, Sullivan T, Allison J. Superantigen response and co-stimulation: CD28 and CTLA-4 have opposing effects on T cell expansion in vitro and in vivo. . Int Immunol. 1996;8:519–523. doi: 10.1093/intimm/8.4.519. [DOI] [PubMed] [Google Scholar]
- Perez V, van Parijs L, Biuckians A, Zheng X, Strom T, Abbas A. Induction of peripheral T cell tolerance in vivo requires CTLA-4 engagement. Immunity. 1997;6:411–417. doi: 10.1016/s1074-7613(00)80284-8. [DOI] [PubMed] [Google Scholar]
- Yu X, Bidwell S, Martin P, Anasetti C. CD28-specific antibody prevents graft-versus-host disease in mice. J Immunol. 2000;164:4564–4568. doi: 10.4049/jimmunol.164.9.4564. [DOI] [PubMed] [Google Scholar]
- Tacke M, Clark G, Dallman M, Hunig Y. Cellular distribution and costimulatory function of rat CD28. Regulated expression during thymocyte maturation and induction of cyclosporine A sensitivity of costimulated T cell responses by phorbol ester. J Immunol. 1995;154:5121–5127. [PubMed] [Google Scholar]
- Dengler T, Szabo G, Sido B, Nottmeyer W, Zimmerman R, Vahl C, et al. Prolonged allograft survival but not tolerance induction by modulating CD28 antibody JJ319 after high-responder heart transplantation. Transplantation. 1999;67:392–398. doi: 10.1097/00007890-199902150-00009. [DOI] [PubMed] [Google Scholar]
- Haspot F, Seveno C, Dugast AS, Coulon F, Renaudin K, Usal C, et al. Anti-CD28 antibody-induced kidney allograft tolerance related to tryptophan degradation and TCR-Class II-B7+ regulatory cells. Am J Transplant. 2005;5:2339–2348. doi: 10.1111/j.1600-6143.2005.01018.x. [DOI] [PubMed] [Google Scholar]
- Guillonneau C, Seveno C, Dugast AS, Li XL, Renaudin K, Haspot F, et al. 2007. Anti-CD28 antibodies modify regulatory mechanisms and reinforce tolerance in CD40Ig-treated heart allograft recipients. J Immunol. 2007;179:8164–8171. doi: 10.4049/jimmunol.179.12.8164. [DOI] [PubMed] [Google Scholar]
- Pandiyan P, Hege J, Krueger M, Quandt D, Brunner-Weinzierl C. High IFN-γ production of individual CD8 T lymphocytes is controlled by CD152 (CTLA-4) J Immunol. 2007;178:2132–2140. doi: 10.4049/jimmunol.178.4.2132. [DOI] [PubMed] [Google Scholar]
- Beyersdorf N, Ding X, Blank G, Dennehy K, Kerkau T, Hunig T. Protection from graft-versus-host disease with a novel B7 binding site-specific mouse anti-mouse CD28 monoclonal antibody. Blood. 2008;112:4328–4336. doi: 10.1182/blood-2008-03-146662. [DOI] [PubMed] [Google Scholar]
- Poirier N, Azimzadeh A, Zhang T, Dilek N, Mary C, Nguyen B, et al. Inducing CTLA-4-dependent immune regulation by selective CD28 blockade promotes regulatory T cells in organ transplantation. Sci Transl Med. 2010;2:17ra10. doi: 10.1126/scitranslmed.3000116. [DOI] [PMC free article] [PubMed] [Google Scholar]
- Chang J, Kim Y, Han S, Kang C. IFN-gamma-STAT 1 signal regulates the differentiation of inducible Treg: potential role for ROS-mediated apoptosis. Eur J Immunol. 2009;39:1241–1251. doi: 10.1002/eji.200838913. [DOI] [PubMed] [Google Scholar]
- Singh N, Yamamoto M, Takami M, Seki Y, Takezaki M, Mellor A, et al. CD4+CD25+ regulatory T cell resist a novel form of CD28- and Fas-dependent p53-induced T cell apoptosis. J Immunol. 2010;184:94–104. doi: 10.4049/jimmunol.0900753. [DOI] [PMC free article] [PubMed] [Google Scholar]
- Carrio R, Torroella-Kouri M, Libreros S, Garcia-Areas R, Iragavarapu-Charyulu V, Lopez D. Decreased accumulation of immune regulatory cells is correlated to the antitumor effect of IFN-γ overexpression in the tumor. Int J Oncol. 2011;39:1619–1627. doi: 10.3892/ijo.2011.1169. [DOI] [PubMed] [Google Scholar]
- Lee SW, Choi H, Eun SY, Fukuyama S, Croft M. Nitric oxide modulates TGF-β-directive signals to suppress Foxp3+ regulatory T cell differentiation and potentiate Th1 development. J Immunol. 2011;186:6972–6980. doi: 10.4049/jimmunol.1100485. [DOI] [PMC free article] [PubMed] [Google Scholar]
- Baban B, Chandler P, Sharma M, Pihkala J, Koni P, Munn D, et al. IDO activates regulatory T cells and blocks their conversion into Th17-like cells. J Immunol. 2009;183:2475–2483. doi: 10.4049/jimmunol.0900986. [DOI] [PMC free article] [PubMed] [Google Scholar]
- Dugast AS, Vanhove B. Immune regulation by non-lymphoid cells in transplantation. Clin Exp Immunol. 2009;156:25–34. doi: 10.1111/j.1365-2249.2009.03877.x. [DOI] [PMC free article] [PubMed] [Google Scholar]
- Wang R, Fang Q, Zhang L, Radvany L, Sharma A, Noben-Trauth N, et al. CD28 ligation prevents bacterial toxin-induced septic shock in mice by inducing IL-10 expression. J Immunol. 1997;158:2856–2861. [PubMed] [Google Scholar]
- Carter N, Vasconcellos R, Rosser E, Tulone C, Munoz-Suano A, Kamanaka M, et al. 2011. Mice lacking endogenous IL-10-producing regulatory B cells develop exacerbated disease and present with an increased frequency of Th1/Th17 but a decrease in regulatory T cells. J Immunol. 186:5569–5579. doi: 10.4049/jimmunol.1100284. [DOI] [PubMed] [Google Scholar]
- Biswas S, Mantovani A. Macrophage plasticity and interaction with lymphocyte subsets: cancer as a paradigm. Nat Immunol. 2010;11:889–896. doi: 10.1038/ni.1937. [DOI] [PubMed] [Google Scholar]
- Geissmann F, Gordon S, Hume D, Mowat A, Randolph G. Unravelling mononuclear phagocyte heterogeneity. Nat Rev Immunol. 2010;10:453–460. doi: 10.1038/nri2784. [DOI] [PMC free article] [PubMed] [Google Scholar]
- Hoechst B, Gamrekelashvili J, Manns M, Greten T, Korangy F. Plasticity of human Th17 cells and iTregs is orchestrated by different subsets of myeloid cells. Blood. 2011;117:6523–6541. doi: 10.1182/blood-2010-11-317321. [DOI] [PubMed] [Google Scholar]
- Blumenthal R, Campbell D, Hwang P, DeKruyff R, Frankel L, Umetsu D. Human alveolar macrophages induce functional inactivation in antigen-specific CD4 T cells. J Allergy Clin Immunol. 2001;107:258–264. doi: 10.1067/mai.2001.112845. [DOI] [PubMed] [Google Scholar]
- Borowski A, Boesteanu A, Mueller Y, Carafieds C, Topham D, Altman J, et al. Memory CD8+ T cells require CD28 costimulation. J Immunol. 2007;179:6494–6503. doi: 10.4049/jimmunol.179.10.6494. [DOI] [PubMed] [Google Scholar]
- Curiel T, Wei S, Dong H, Alvarez X, Cheng P, Mottram P, et al. Blockade of B7-H1 improves myeloid dendritic cell-mediated antitumor immunity. Nat Med. 2003;5:562–567. doi: 10.1038/nm863. [DOI] [PubMed] [Google Scholar]
- Latchman Y, Liang S, Wu Y, Chernova T, RSobel R, Klemm M, et al. PD-L1 deficient mice show that PD-L1 on T cells, antigen-presenting cells, and host tissues negatively regulates T cells. Proc Nat Acad Sci. 2004;101:10691–10696. doi: 10.1073/pnas.0307252101. [DOI] [PMC free article] [PubMed] [Google Scholar]
- Keir M, Butte M, Freeman G, Sharpe A. PD-1 and its ligands in tolerance and immunity. Ann Rev Immunol. 2008;26:677–704. doi: 10.1146/annurev.immunol.26.021607.090331. [DOI] [PMC free article] [PubMed] [Google Scholar]
- Dong H, Zhu G, Tamada K, Chen L. B7-H1, a third member of the B7 family, co-stimulates T-cell proliferation and interleukin-10 secretion. Nat Med. 1999;5:1365–1369. doi: 10.1038/70932. [DOI] [PubMed] [Google Scholar]
- Lukacs-Kornek V, Malhotra D, Fletcher A, Acton S, Elpek K, Tayalia P, et al. Regulated release of nitric oxide by nonhematopoietic stroma controls expansion of the activated T cell pool in lymph nodes. Nat Immunol. 2011;12:1096–1105. doi: 10.1038/ni.2112. [DOI] [PMC free article] [PubMed] [Google Scholar]
- Yamazaki T, Akiba H, Koyanagi A, Azuma M, Yagita H, Okumura K. Blockade of B7-H1 on macrophages suppresses CD4+ T cell proliferation by augmenting IFN-g-induced nitric oxide production. J Immunol. 2005;175:1586–1592. doi: 10.4049/jimmunol.175.3.1586. [DOI] [PubMed] [Google Scholar]
- Loke P, Allison J. PD-L1 and PD-L2 are differentially regulated by Th1 and Th2 cells. Proc Nat Acad Sci. 2003;100:5336–5341. doi: 10.1073/pnas.0931259100. [DOI] [PMC free article] [PubMed] [Google Scholar]
- Collins A, Brodie D, Gilbert R, Laboni A, Manso-Sancho R, Walse B, et al. The interaction properties of costimulatory molecules revisited. Immunity. 2002;17:201–210. doi: 10.1016/s1074-7613(02)00362-x. [DOI] [PubMed] [Google Scholar]
- Butte M, Keir M, Phamduy T, Sharpe A, Freeman G. Programmed death-ligand 1 interacts specifically with B7-1 costimulatory molecule to inhibit T cell responses. Immunity. 2007;27:111–122. doi: 10.1016/j.immuni.2007.05.016. [DOI] [PMC free article] [PubMed] [Google Scholar]
- Chen L. Co-inhibitory molecules of the B7-CD28 family in the control of T-cell immunity. Nat Rev Immunol. 2004;4:336–350. doi: 10.1038/nri1349. [DOI] [PubMed] [Google Scholar]
- Suntharalingam G, Perry M, Ward S, Brett S, Castello-Cortes A, Brunner M, et al. Cytokine storm in a phase I trial of the anti-CD28 monoclonal antibody TGN1412. New Engl J Med. 2006;355:1018–1028. doi: 10.1056/NEJMoa063842. [DOI] [PubMed] [Google Scholar]
- Hansel T, Kropshofer H, Singer T, Mitchell J, George A. The safety and side effects of monoclonal antibodies. Nat Rev Drug Disc. 2010;9:325–338. doi: 10.1038/nrd3003. [DOI] [PubMed] [Google Scholar]
- Stebbings R, Findlay L, Edwards C, Eastwood D, Bird C, North D, et al. ‘Cytokine Storm' in the phase I trial of monoclonal antibody TGN1412: understanding the causes to improve preclinical testing of immunotherapeutics. J Immunol. 2007;179:3325–3331. doi: 10.4049/jimmunol.179.5.3325. [DOI] [PubMed] [Google Scholar]
- St Clair E. The calm after the cytokine storm: lessons from the TGN1412 trial. J Clin Invest. 2008;118:1344–1347. doi: 10.1172/JCI35382. [DOI] [PMC free article] [PubMed] [Google Scholar]
- Sandilands G, Wilson M, Huser C, Jolly L, Sands W, McSharry C. Were monocytes responsible for initiating the cytokine storm in the TGH1412 clinical trial tragedy. Clin Exp Immunol. 2011;162:516–27. doi: 10.1111/j.1365-2249.2010.04264.x. [DOI] [PMC free article] [PubMed] [Google Scholar]
- Waldmann T. Effective cancer therapy through immunomodulation. Ann Rev Med. 2006;57:65–81. doi: 10.1146/annurev.med.56.082103.104549. [DOI] [PubMed] [Google Scholar]


