Summary
Background:
To study the impact of target motion in kV-CBCT imaging.
Material/Methods:
To simulate the respiratory movement, dynamic phantom was programmed to move in three-dimension with a period of four seconds and of two different amplitudes (PA1 and PA2). The targets of well defined geometries (cylinder, sphere, solid triangle, U-shaped and dumbbell) were made using wax. The static targets were CT imaged (reference image). Using CBCT, the targets in static and dynamic modes were imaged under full-fan beam. The line profiles along cranio-caudal direction, influence of target’s initial moving phase and volume estimation using auto-contouring tool were used to analyze the effects of target motion on CBCT imaging.
Results:
Comparing the line profiles of targets in CBCT with CT, the length of average HU spread was reduced by 42.54±1.85%, except the cylindrical target which is by 19.35% for PA1. The percentage difference in reconstructed volume of static targets imaged using CBCT and CT (HU WW −500 to 0) ranges from −1.32% to −5.94%. The volume losses for targets imaged in dynamic mode PA1 ranges from 14.35% to 30.95% and for PA2 it was 21.29% to 43.80%. The solid triangle and cylindrical targets suffered the maximum and minimum volume losses respectively.
Conclusions:
Non-gated CBCT imaging of the moving targets encounters significant loss of volumetric information, due to scatter artifacts. These may result in a systematic error in re-contouring when CBCT images are used for the re-planning work.
Keywords: kV-CBCT, target motion, re-contouring, systematic error
Background
Kilo-voltage cone beam computed tomography (kV-CBCT) integrated into the linear accelerator as a tool for image guided radiation therapy, was developed to acquire on-line volumetric and anatomical images [1]. The CBCT images are compared with the reconstructed radiograph from original treatment plan for the most accurate position setup [2–5]. In addition to guide the patient setup process, CBCT data acquired prior to the treatment be used to recalculate or verify the treatment plan based on the patient anatomy of the treatment day. This affords an effective means to adaptively modify the patient’s treatment plan during the course of a radiation therapy based on the dose that has already been delivered. But this application in image guidance depends on the image quality of CBCT [6].
Different from conventional CT, kV CBCT covers a much larger field of view (FOV) in the longitudinal direction and scatter poses a more severe problem in the resultant image. Also the gantry rotation speed is limited to ∼1 min by IEC regulation, which makes the CBCT more prone to motion artifacts [6]. The deteriorated image quality raises serious concerns about the precise estimation of reconstructed volume of moving targets which influence on the accurate dosimetric re-planning purposes. This study evaluated the changes in volumetric information of moving targets using in-house built dynamic phantom.
Material and Methods
An in-house built dynamic phantom capable of moving in three-dimensions was constructed (Figure 1). Each axis was build independently using stepper motor and lead screw assembly driven by individual stepper card. The positional accuracy of the phantom was 5 μm. To simulate the respiratory movement, in-house built dynamic phantom was made to move linearly with a period of four seconds and of two different programmed amplitudes (PA): (i) amplitude of 18 mm in cranio-caudal, 14 mm in anterior-posterior and 4 mm in lateral directions (PA1) and (ii) amplitude of 24 mm in cranio-caudal, 16 mm in anterior-posterior and 4mm in lateral directions (PA2) [7].
Figure 1.
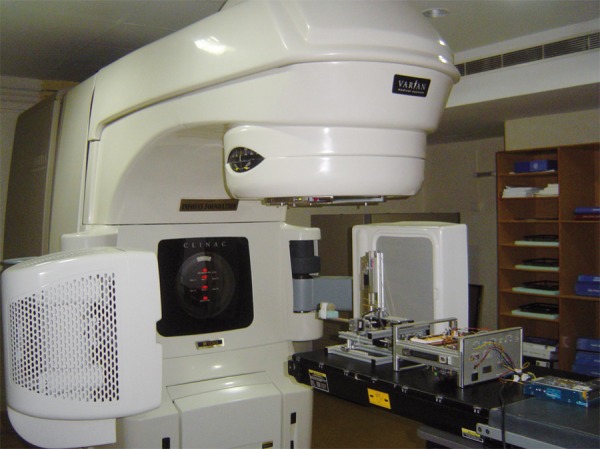
In-house built dynamic phantom having cylindrical targets was imaged in kV-CBCT integrated with Varian CL-2100 C/D.
The CBCT images in this work were acquired by the on-board imager (OBI®, Varian Medical Systems, Palo Alto, CA) integrated on a Varian CL-2100 C/D linear accelerator. In order to obtain the calibration curve of conventional CT and CBCT, Catphan-600 module CTP404 was used. The CTP404 has a diameter of 15 cm (longitudinal dimension is 16 cm) and contains different sizes inserts with seven different tissue substitute materials, air, PMP, LDPE, polystyrene, acrylic, Delrin and Teflon respectively. Their electron densities ranged from 0 to 2.16. The calibration of a CT scanner involves acquiring CT images, obtaining average HUs for each inserting materials, and plotting the HU as a function of the relative electron density. Similarly, the calibration curve was obtained for CBCT in full-fan and half-fan mode. The calibration curves of CT, full-fan CBCT and half-fan CBCT were compared. Cross sectional image of the phantom imaged using CT, full-fan and half-fan CBCT were shown in Figure 2A–C.
Figure 2.
(A). A cross-sectional image of CATPHAN 600 imaged using CT. (B) A cross-sectional image of CATPHAN 600 imaged using full-fan CBCT. (C) A cross-sectional image of CATPHAN 600 imaged using half-fan CBCT.
The targets of well defined geometries and known volume namely cylinder (42.3cc), sphere (21.1cc), solid triangle (27.2cc), U-shaped (38.9cc) and dumbbell (44.3cc) were made using wax. The purpose of different shaped targets is to understand the dependence of the reconstructed volume of targets as a function of shape and amplitude of its motion. Figure 3 shows the different shaped wax phantoms: Sphere, Cylinder, Solid triangle, Dumbbell and U-shaped.
Figure 3.
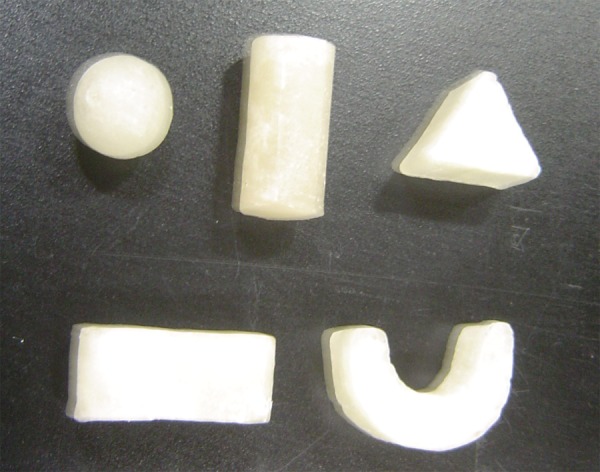
The different shaped wax targets: Sphere, Cylinder, Solid triangle, Dumbbell and U-shaped.
These targets were imaged in static mode using conventional CT with the imaging parameters of 120 kV, 250 mAs, and pitch 1.5 to yield images of 2 mm slice thickness. These CT images were considered as the reference images for the analysis.
During CBCT image acquisition the targets were fixed above the Styrofoam board and imaged at both static and dynamic modes under full-fan acquisition with bowtie filter and imaging parameters: 100 kV, 80 mA, and 512×512 resolution. In dynamic mode the images were acquired for both the PA1 and PA2. The volumetric data were reconstructed to yield images of 2 mm slice thickness;
In order to study the influence of initial moving phase during CBCT imaging, the spherical target is imaged eight times at random initial phases in dynamic mode (PA1). It is found that there was no significant change in volume (standard deviation =0.15).
The CT and CBCT images were exported to Eclipse treatment planning system (Version 8.6, Varian Medical Systems). The line profiles are obtained along cranio-caudal direction for static and dynamic targets in CBCT images. These profiles are compared with profiles of reference CT images.
Since the volume prediction using auto contouring technique highly depends on the window width levels (WW), it is mandatory to find the appropriate WW setting. From the CT images the average HU of the target was found to be −112±6 HU, hence the upper window level was chosen as 0 HU. It is found that in CT images the window width setting of −500 to 0 HU yield the volumes with less than one percent variation to the actual volumes. These volumes were considered as the reference volumes for comparison with CBCT images. In CBCT images the static and moving (PA1 & PA2) target volumes were delineated for various window width settings and were tabulated. The percentage differences in volume were determined and changes in reconstructed volume of moving targets were analyzed.
Results
The calibration curves of conventional CT, full-fan and half-fan mode CBCT are shown in Figure 4. In full-fan mode, the maximum differences in HU value compared with reference CT were less than 20 HU. For half-fan mode, bone material shows the maximum HU difference from CT of 40 HU. This study confirms the CBCT has the ability to generate images with HU values comparable to those in CT.
Figure 4.
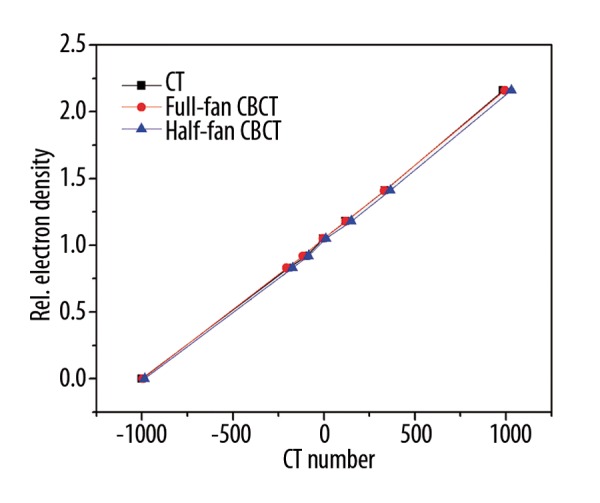
The calibration curves (CT number versus Relative electron density) for CT, full-fan and half-fan CBCT.
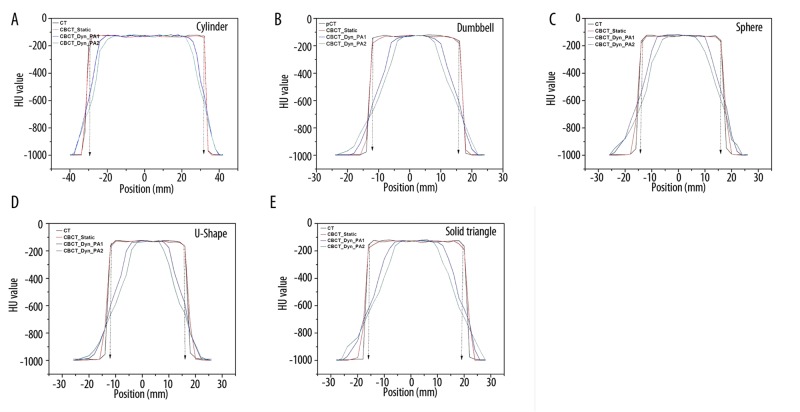
The line profile comparison of reference CT with static and dynamic CBCT images along cranial-caudal direction for various shaped targets are shown in Figure 5. It is found that the CT and static CBCT profiles of targets agree to within 5%. On the other hand, targets imaged in dynamic mode using CBCT shows a much greater variation. The actual length of the targets along cranio-caudal direction is shown in dash-dotted line for the CT profiles. Within the region of actual length, the length of average HU (−112±6 HU) spread in the targets was reduced by 42.54±1.85% and 55.79±1.80% except the cylindrical target where the length was reduced by 19.35% and 25.81% for PA1 and PA2 respectively. The solid triangle and U-shape targets suffered the maximum reduction in length of average HU. From the profiles, it is also found that, the spread of the reduced HU values outside the CT profile was for 6.4±0.9 mm and 8±1.4 mm for the targets moving in PA1 and PA2 respectively.
Figure 5.
The HU line profiles of the targets (A) cylinder, (B) dumbbell (C) sphere (D) U-shape (E) Solid triangle imaged with CT and CBCT in static and dynamic mode along cranio-caudal direction.
The change in reconstructed volume were evaluated on comparing the volumes of reference CT images and CBCT images (both static and dynamic) obtained using auto-contouring for WW −500 to 0 and WW −600 to 0. Also, in CBCT images, WW settings were adjusted for each target shapes so that the volume variation falls less than 1% when compared with the reference target volumes and the values were tabulated.
For the HU WW −500 to 0, the percentage difference in reconstructed volume of static targets imaged using CBCT and reference CT ranges from −1.32% to −5.94% (Table 1). The U-shaped target suffered the maximum volume loss. The volume losses for different targets imaged in dynamic mode for PA1 ranges from 14.35% to 30.95% and for PA2 it was 21.29% to 43.80%. The solid triangle and cylindrical targets suffered the maximum and minimum volume losses respectively. In Figure 6, the yellow line indicates the contouring of targets for HU WW −500 to 0. It obviously shows the volume loss for the targets imaged in dynamic modes using CBCT on comparison with reference CT.
Table 1.
The reconstructed volume (in cc) of the targets imaged with CBCT in static and dynamic modes obtained using auto-contouring for WW −500 to 0 and the percentage difference in volume with reference CT respectively.
| Targets | Reconstructed Volume using auto-contouring technique for WW −500 to 0 (in cc) | ||||||
|---|---|---|---|---|---|---|---|
| Reference CT volume | CBCT (static) | Volume difference (%) | CBCT (dynamic PA1) | Volume difference (%) | CBCT (dynamic PA2) | Volume difference (%) | |
| Dumbbell | 43.71 | 42.37 | −3.07 | 31.94 | −26.93 | 25.94 | −40.65 |
| Cylinder | 42.17 | 41.61 | −1.32 | 36.12 | −14.35 | 33.19 | −21.29 |
| U-shape | 38.19 | 35.92 | −5.94 | 27.82 | −27.15 | 22.02 | −42.34 |
| Solid triangle | 26.53 | 25.01 | −5.73 | 18.32 | −30.95 | 14.91 | −43.80 |
| Sphere | 20.68 | 20.13 | −2.66 | 15.65 | −24.32 | 12.24 | −40.81 |
Figure 6.
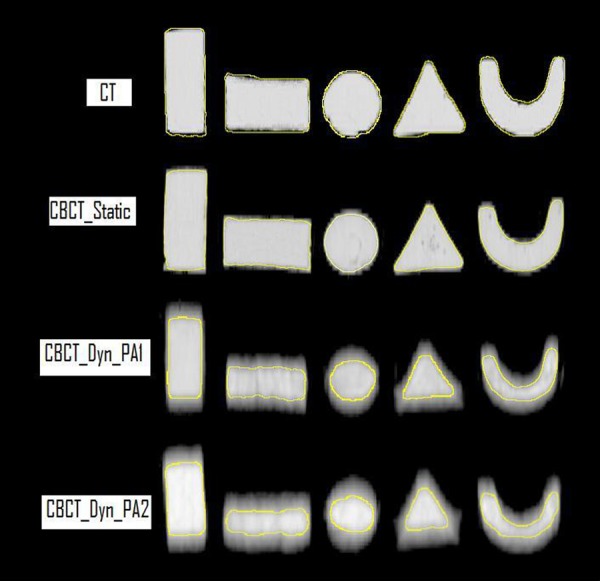
The reconstructed volume loss for the targets imaged in static and dynamic modes using CBCT on comparison with reference CT. The yellow line indicates the contouring of targets for HU WW −500 to 0.
Similarly for the HU WW −600 to 0 (Table 2), the volume losses for targets imaged in dynamic mode for PA1 were reduced and it ranges from 2.51% to 11.38% and for PA2 it was 5.76% to 21.07%. The solid triangle and cylindrical targets suffered the maximum and minimum volume losses respectively.
Table 2.
The reconstructed volume (in cc) of the targets with CBCT in dynamic modes obtained using auto-contouring for WW −600 to 0 and the percentage difference in volume with reference CT respectively.
| Targets | Reconstructed Volume using auto-contouring technique for WW −600 to 0 (in cc) | ||||
|---|---|---|---|---|---|
| Reference CT volume | CBCT (dynamic PA1) | Volume difference (%) | CBCT (dynamic PA2) | Volume difference (%) | |
| Dumbbell | 43.71 | 39.24 | −10.23 | 35.25 | −19.35 |
| Cylinder | 42.17 | 41.11 | −2.51 | 39.74 | −5.76 |
| U-shape | 38.19 | 35.91 | −5.97 | 30.68 | −19.66 |
| Solid triangle | 26.53 | 23.51 | −11.38 | 20.94 | −21.07 |
| Sphere | 20.68 | 19.34 | −6.48 | 16.65 | −19.49 |
Table 3 indicates that HU WW between −650/−620 to 0 and HU WW −675/−635 to 0 resulted in less than 1% volume losses for all the targets imaged using CBCT in dynamic mode PA1 and PA2 respectively.
Table 3.
The WW settings for which the volume of the targets is less than one percent variation with reference CT volumes.
| Targets | Ref. CT volume (cc) | CBCT (PA1) | CBCT (PA2) | ||||
|---|---|---|---|---|---|---|---|
| Volume (cc) | % difference | HU WW | Volume (cc) | % difference | HU WW | ||
| Dumbbell | 43.71 | 43.62 | −0.21 | −645 to 0 | 43.61 | −0.23 | −665 to 0 |
| cylinder | 42.17 | 42.03 | −0.33 | −620 to 0 | 42.11 | −0.14 | −635 to 0 |
| U-shape | 38.19 | 38.02 | −0.45 | −650 to 0 | 38.15 | −0.10 | −675 to 0 |
| Solid triangle | 26.53 | 26.30 | −0.87 | −650 to 0 | 26.33 | −0.75 | −675 to 0 |
| Sphere | 20.68 | 20.49 | −0.92 | −635 to 0 | 20.62 | −0.29 | −660 to 0 |
Discussion
There have been many studies and efforts to quantify and fix the motion artifacts on CBCT. Guckenberger et al. applied a probability density function (PDF) to identify the positions and moving extents of the diaphragmatic dome on fan beam CT as the indicators of liver motion. The unadjusted CBCT images were matched in range accordingly [8]. Snoke et al. acquired four-dimensional CBCT (4D-CBCT) and sorted the images at the same respiratory phases for reconstruction [9]. This method aided in estimation of average moving track, position and shape of the target and together reduces the geometrical uncertainties from respiration, and is similar to the clinically used gated system for radiotherapy. This technique is still limited in the smaller number of sorted images and the reduced reconstruction quality.
When using non-gated CBCT for the potential re-contouring and re-planning work, it is essential to understand the motion induced inaccuracy. From the study, on verifying the image quality of CBCT, the difference in HU values between CT and CBCT for the Catphan were less than 40 HU, Teflon shows the maximum variation in half-fan mode. Thus this study confirms the CBCT has the ability to generate images with HU values comparable to those in CT.
In CBCT, due to cone beam geometry, the influence of scatter radiation is more that of fan beam geometry [10,11]. In general, X-ray scatter reduces image contrast, increases image noise and may introduce reconstruction error into CBCT. Such artifacts are much worse for moving objects. Comparing the line profiles of static targets imaged in CBCT and CT images along cranio-caudal directions shows lesser variation within the region of actual length. But in case of moving targets, the length of average HU spread was reduced by 42.54±1.85% except the cylindrical target where the length was reduced by 19.35%. The spread of the reduced HU values outside the CT profile was for approximately 6 to 8mm for the moving targets. This is because of partial volume averaging at the edges of the targets similar to findings by James A Tanyi et al. in CT imaging [12].
In static condition, targets imaged in CBCT suffer reconstructed volume losses up to 6% on comparing with reference CT volume. In case of moving targets, the reconstructed volume losses show a significant variation. In our study, using two different amplitudes in three dimension moving with same frequency (15 cycles/min) for acquiring moving targets, the reconstructed volume losses obtained using auto-contouring for WW −500 to 0 ranges from 14.35% to 30.95% for PA1 and from 21.29% to 43.80% for PA2. When increasing the window width for auto-contouring technique (−600 to 0), the volume losses were reduced and it ranges from 2.51% to 11.38% for PA1 and from 5.76% to 21.07% for PA2. This indicates that the volume losses depend on the amplitude of motion and shape of the targets. Larger the amplitude of motion results in greater volume losses. The cylindrical target being more regular along the cranio-caudal direction suffers the minimum loss. Since the U-shape and solid triangle targets has narrow and sharp edge geometry along the cranio-caudal direction, the reconstructed volume losses were more pronounced.
In computed tomography (CT), the experiments and simulations shows significant distortions of true shape of an object when imaged at different initial phases of motion.[13] In our study, the CBCT imaging of spherical targets in different initial phases does not have significant impact on the estimated volume (standard deviation: 0.15). Unlike CT, the imaging of moving targets in CBCT yields lesser distortion of shape. But the CT number density was smeared at the edges which causes blurring of the targets. Hence while auto-contouring, the targets suffer loss of volumetric information. On the other hand the relaxed WW setting results in volume gain because of the scattered HU’s beyond the actual volume. This results often in less accurate three-dimensional contouring of gross target volume.
This study was limited to wax targets. Further investigations are required for various density targets under slow scan CBCT.
Conclusions
Accurate delineation of target volume in adaptive radio-therapy using kV-CBCT imaging is not only crucial for designing an appropriate and clinically effective treatment plan, but also necessary for accurate dose calculation. The study suggests a conclusion during non-gated CBCT acquisition: non-gated CBCT imaging of the moving targets can lead to significant loss of volumetric information and lesser distortion of shape. These may result in a systematic error in re-contouring when CBCT images are used for the re-planning work. Thus a failure in accurate delineation of target in the process of adaptive radiotherapy using CBCT imaging imposes a limitation on the therapeutic gains of conformally implemented RT techniques.
References:
- 1.Xing L, Thorndyke B, Schreibmann, et al. Overview of image guided radiation therapy. Med Dosim. 2006:91–112. doi: 10.1016/j.meddos.2005.12.004. [DOI] [PubMed] [Google Scholar]
- 2.Jaffray DA, Siewerdsen JH. Cone-beam computed tomography with a flat-panel imager: Initial performance characterization. Med Phys. 2000;27:1311–23. doi: 10.1118/1.599009. [DOI] [PubMed] [Google Scholar]
- 3.Jaffray DA, Siewerdsen JH, Wong JW, et al. Flat panel cone-beam computed tomography for image-guided radiation therapy. Int J Radiat Oncol Biol Phys. 2002;53:1337–49. doi: 10.1016/s0360-3016(02)02884-5. [DOI] [PubMed] [Google Scholar]
- 4.Yan D, Lockman D, Brabbins D, et al. An off-line strategy for constructing a patient-specific planning target volume in adaptive treatment process for prostate cancer. Int J Radiat Oncol Biol Phys. 2000;48:289–302. doi: 10.1016/s0360-3016(00)00608-8. [DOI] [PubMed] [Google Scholar]
- 5.Letourneau D, Wong R, Moseley D, et al. Online planning and delivery technique for radiotherapy of spine metastases using cone-beam CT: image quality and system performance. Int J Radiat Oncol Biol Phys. 2001;67:1229–37. doi: 10.1016/j.ijrobp.2006.09.058. [DOI] [PubMed] [Google Scholar]
- 6.Yang Y, Schreibmann E, Li T, et al. Evaluation of on-board kV cone-beam CT (CBCT)-based dose calculation. Phys Med Biol. 2007;52:685–705. doi: 10.1088/0031-9155/52/3/011. [DOI] [PubMed] [Google Scholar]
- 7.Stevens CW, Munden RF, Forster KM, et al. Respiratory-driven lung tumor motion is independent of tumor size, tumor location, and pulmonary function. Int J Radiat Oncol Biol Phys. 2001;51(1):62–68. doi: 10.1016/s0360-3016(01)01621-2. [DOI] [PubMed] [Google Scholar]
- 8.Guckenberger M, Sweeney RA, Wilbert J, et al. Image-guided radiotherapy for liver cancer using respiratory-correlated computed tomography and cone-beam computed tomography. Int J Radiat Oncol Biol Phys. 2008;71:297–304. doi: 10.1016/j.ijrobp.2008.01.005. [DOI] [PubMed] [Google Scholar]
- 9.Snoke JJ, Zijp L, Remeijer P, et al. Repiratory correlated cone beam CT. Med Phys. 2005;32:1176–86. doi: 10.1118/1.1869074. [DOI] [PubMed] [Google Scholar]
- 10.Siewerdsen JH, Jaffery DA. Cone-beam computed tomography with a flat-panel imager: magnitude and effects of x-ray scatter. Med Phys. 2001;28:220–31. doi: 10.1118/1.1339879. [DOI] [PubMed] [Google Scholar]
- 11.Yoo S, Ying FF. Dosimetric feasibility of cone-beam CT-based treatment planning compared to CT-based treatment planning. Int J Radiat Oncol Biol Phys. 2006;66:1553–61. doi: 10.1016/j.ijrobp.2006.08.031. [DOI] [PubMed] [Google Scholar]
- 12.Tanyi JA, Fuss M, Varchena V, et al. Phantom investigation of 3D motion-dependent volume aliasing during CT simulation for radiation therapy planning. Radiat Oncol. 2007;2:10. doi: 10.1186/1748-717X-2-10. [DOI] [PMC free article] [PubMed] [Google Scholar]
- 13.Chen GTY, Kung JH, Beaudette KP. Artifacts in computed tomography scanning of moving objects. Semin Radiat Oncol. 2004;14:19–26. doi: 10.1053/j.semradonc.2003.10.004. [DOI] [PubMed] [Google Scholar]


